With the move to HammerDB v3.0 as well as refactoring a lot of code the documentation moved to Docbook format. As with the Oracle best practice dcoument previously at v2 there was an SQL Server best practice document that is no longer included in the current documentation. As a number of people have asked for it it is published here.
CPU, Memory and I/O
The key dependence of performance is hardware related with the CPU being the most important factor on the levels of performance available from the rest of the system. At the next level from the CPU is memory with the best levels of performance available from having sufficient memory to cache all of the test database. Finally I/O performance is crucial with modern systems and CPUs available to drive high levels of throughput, In particular for OLTP workloads write performance to transaction logs is critical and often a major resource constraint. Solid State Disks (SSDs) are strongly recommended for both data areas and transaction logs to provide the I/O capabilities to match the CPU performance of up to date systems.
BIOS Settings
Systems are shipped with default BIOS and are not necessarily optimized for database performance. BIOS settings should be checked and settings verified with the vendor to ensure that they are advantageous to SQL Server Performance. A common error is to accept a default setting of “High Performance” that sets a subset of lower level BIOS settings without verifying what these are. A default setting of “High Performance” will often result in lower performance for a database environment.
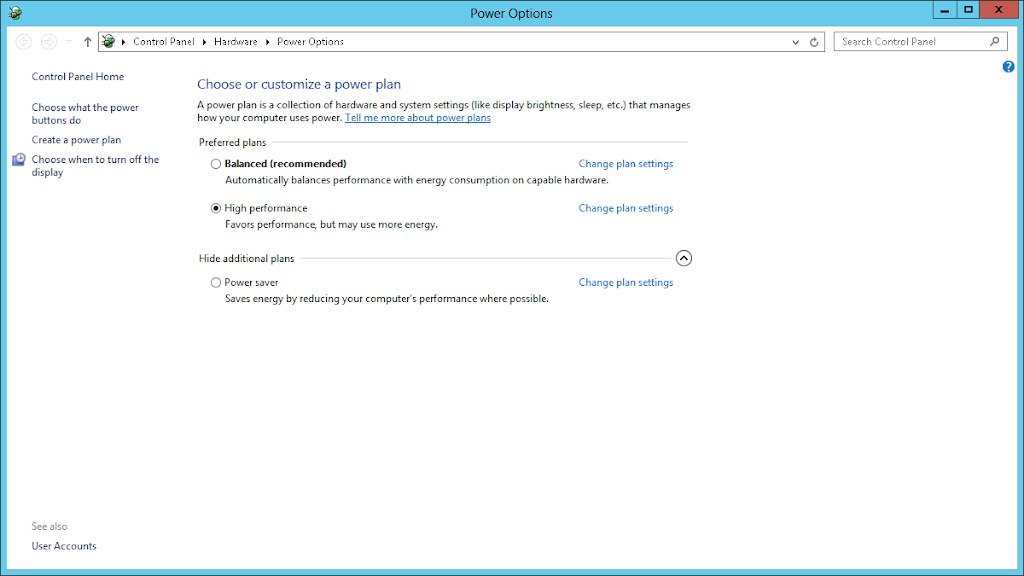
Power Options
Open the power options dialog and choose High Performance if not already selected.
Verify Single Threaded Performance
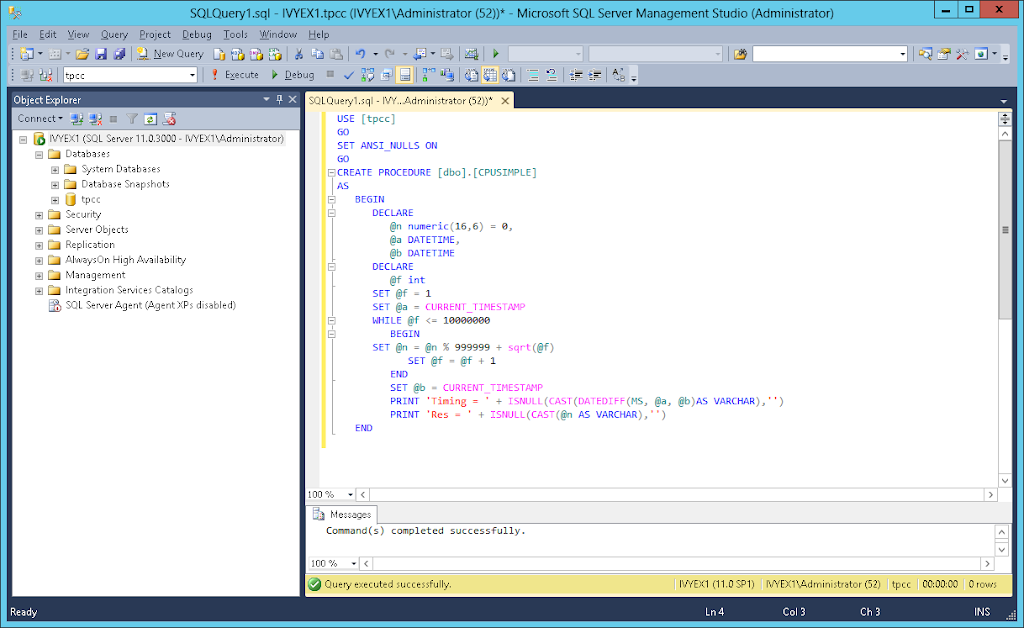
Verify that you achieve maximum CPU single threaded performance by creating and running the following stored procedure.
USE [tpcc]
GO
SET ANSI_NULLS ON
GO
CREATE PROCEDURE [dbo].[CPUSIMPLE]
AS
BEGIN
DECLARE
@n numeric(16,6) = 0,
@a DATETIME,
@b DATETIME
DECLARE
@f int
SET @f = 1
SET @a = CURRENT_TIMESTAMP
WHILE @f <= 10000000
BEGIN
SET @n = @n % 999999 + sqrt(@f)
SET @f = @f + 1
END
SET @b = CURRENT_TIMESTAMP
PRINT ‘Timing = ‘ + ISNULL(CAST(DATEDIFF(MS, @a, @b)AS VARCHAR),”)
PRINT ‘Res = ‘+ ISNULL(CAST(@n AS VARCHAR),”)
END
In any database (ie use [ database name ] ) create the stored procedure by running the code above as shown.
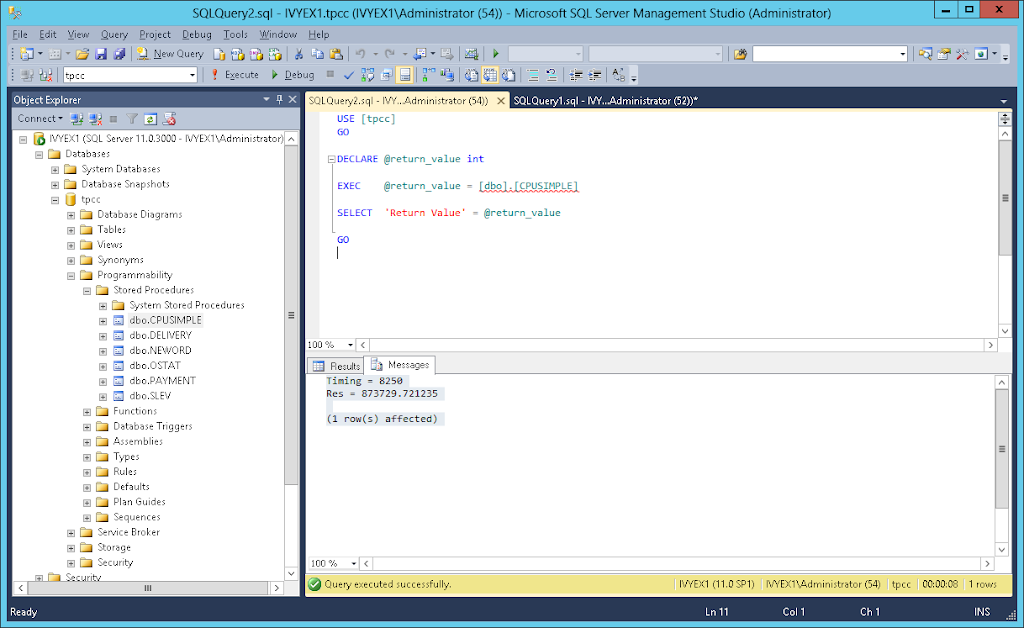
Right click on CPUSIMPLE and click execute stored procedure, Click OK and wait – if it runs OK then return value is 0 click on message to see the time the procedure took to run:
For example:
Timing = 8250
Res = 873729.721235
(1 row(s) affected)
In this case the stored procedure took 8.2 seconds to run. Actual performance will depend on your installed CPU however an up to date CPU would be expected to complete this routine in under 10 seconds. For more information on this test and troubleshooting view the older blog entry How to Maximise CPU Performance for SQL Server on Windows.
Network Bandwidth
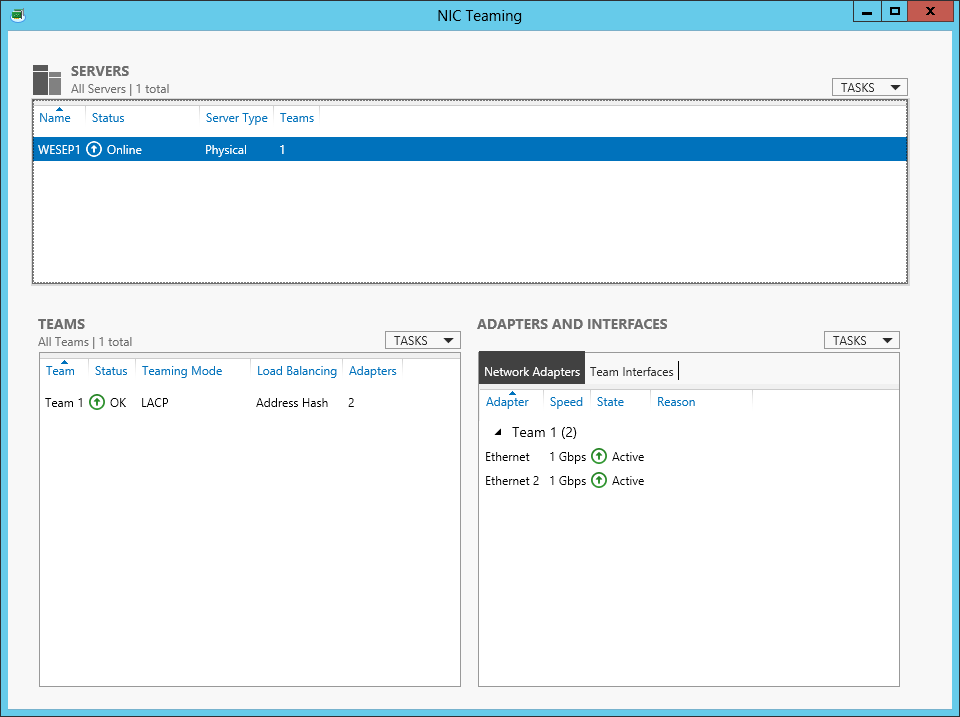
With a highly scalable system network utilisation may exceed Gigabit capacity between log generation server and SUT. To increase capacity you may use either use 10GbE or configure NIC teaming for multiple Gigabit Ethernet adapters on both the server and both the LACP compatible switch in LACP mode. Firstly the network switch must be configured to enable LACP using your switch documentation, then configure NIC teaming from the Server Management Window for the interfaces connected to the same switch as shown
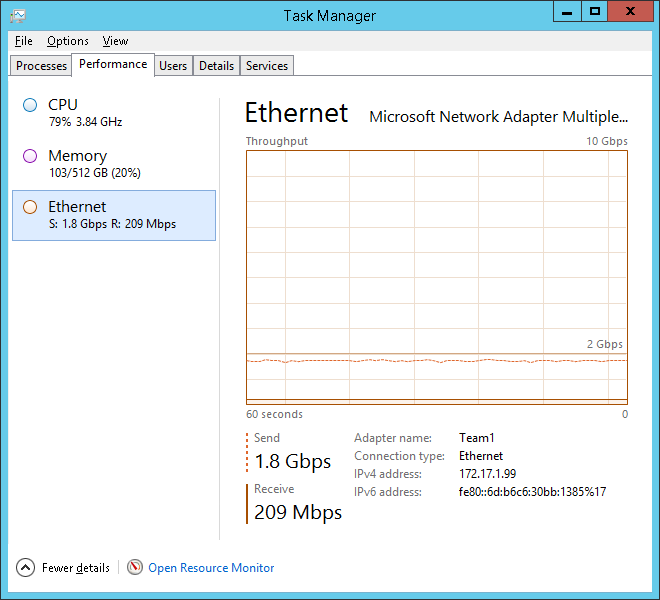
Confirm under Task Manager that Gigabit capacity has been exceeded whilst running a HammerDB workload.


SQL Server Properties
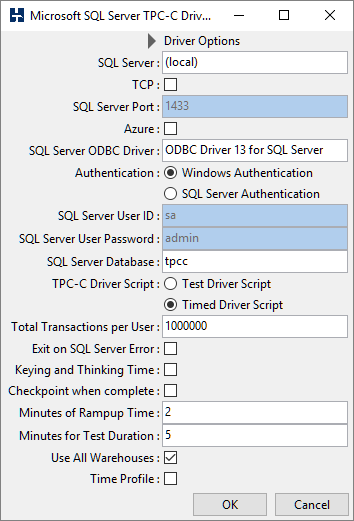
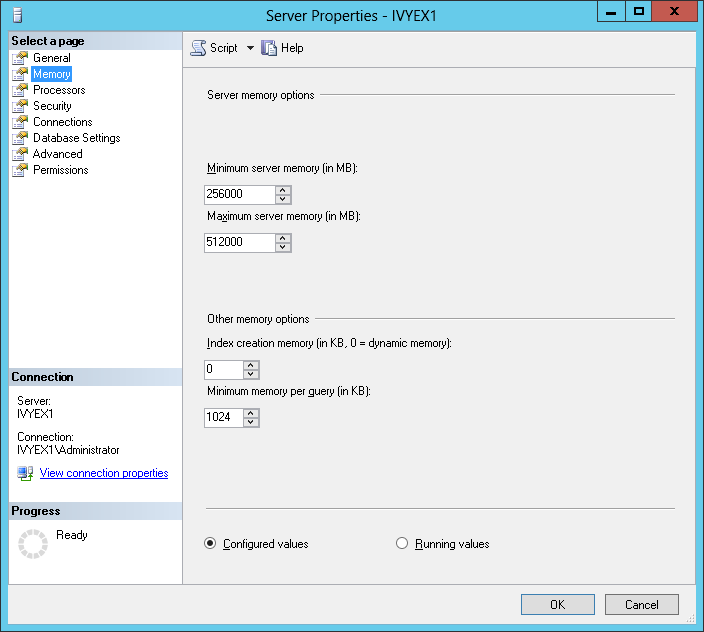
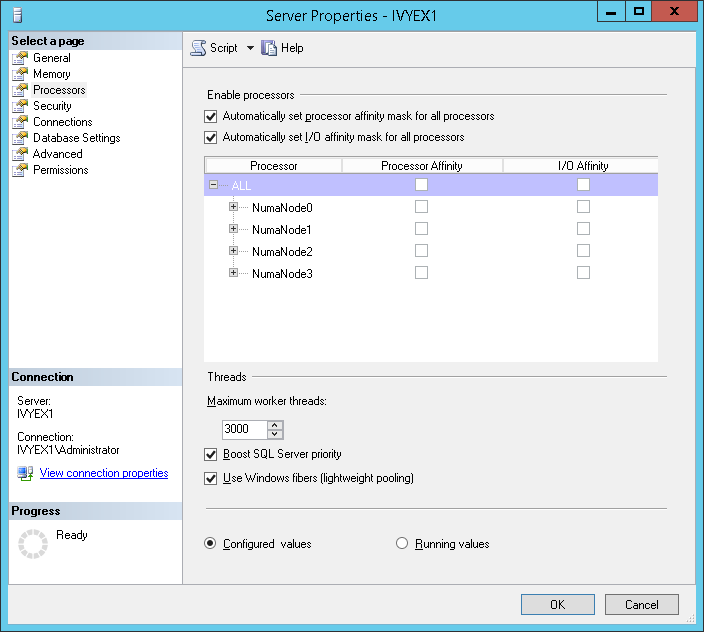
Configure SQL Server according to your available hardware, this can be done either with the graphical tools as shown or manually as follows, the following example shows a memory configuration of between 256GB and 512GB.
exec sp_configure ‘show advanced options’, ‘1’
reconfigure with override
exec sp_configure ‘min server memory’, 256000
exec sp_configure ‘max server memory’, 512000
exec sp_configure ‘recovery interval’,’32767′
exec sp_configure ‘max degree of parallelism’,’1′
exec sp_configure ‘lightweight pooling’,’1′
exec sp_configure ‘priority boost’, ‘1’
exec sp_configure ‘max worker threads’, 3000
exec sp_configure ‘default trace enabled’, 0
go
reconfigure with override
Also ensure that Processor Affinity is set automatically as shown.
Database Creation
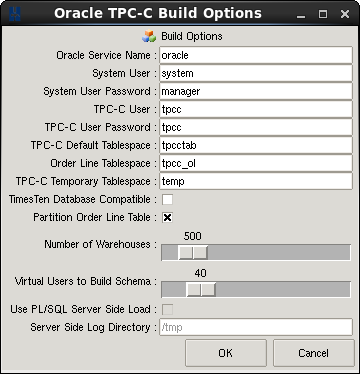
Building the HammerDB schema directly on the database server will be quicker as you will be able to take advantage of more cores and not be required to pass all of the data across the network.
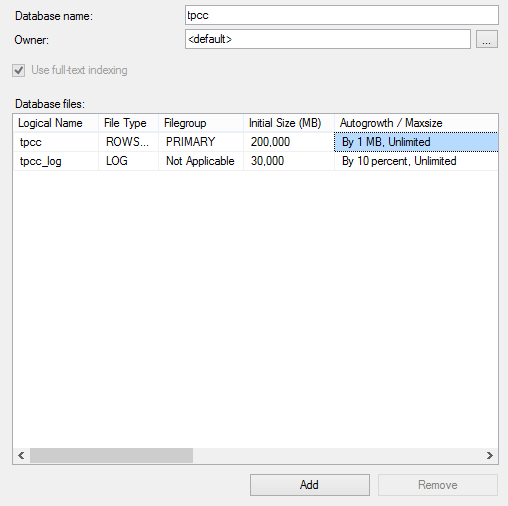
Firstly pre-create an empty database called tpcc (or any other name) as shown, this enables you to choose and configure your storage in advance. Ensure that the initial DATA files are sufficiently large (eg 200GB for 4 socket) to ensure that the files are not continually growing during a test at the expense of performance. You may also wish to configure the Autogrowth properties to ensure that if the file does grow it grows sufficiently to prevent additional performance impact.
Schema Build and Configure
Once built backup the TPCC database, a simple way is to stop SQL Server and copy the TPCC DATA and LOG to a backup directory. To restore the schema delete the existing schema, copy the DATA and LOG directories from backup and use the attach command to reattach the original database, configure the schema using the following commands.
ALTER DATABASE tpcc SET RECOVERY SIMPLE
GO
ALTER DATABASE tpcc SET TORN_PAGE_DETECTION OFF
GO
ALTER DATABASE tpcc SET PAGE_VERIFY NONE
GO
Partition the History Table
For highly scalable systems partitioning the history table can reduce insert contention either use the SQL Server Management Studio or run a statement as follows modifying the highlighted values according to the warehouse count for 1 partition per 100 warehouses.
USE [tpcc]
GO
BEGIN TRANSACTION
CREATE PARTITION FUNCTION[HISTORY_PART](int) AS RANGE LEFT FOR VALUES (1, 100,200, 300, 400, 500, 600, 700, 800, 900)
CREATE PARTITION SCHEME[HISTORY_PART] ASPARTITION [HISTORY_PART]TO ([PRIMARY],[PRIMARY],[PRIMARY],[PRIMARY],[PRIMARY],[PRIMARY],[PRIMARY],[PRIMARY],[PRIMARY],[PRIMARY],[PRIMARY])
CREATE CLUSTERED INDEX[ClusteredIndex_on_HISTORY_PART_634589363881526517]ON [dbo].[history]
(
[h_w_id]
)WITH (SORT_IN_TEMPDB = OFF, IGNORE_DUP_KEY = OFF, DROP_EXISTING = OFF, ONLINE = OFF) ON [HISTORY_PART]([h_w_id])
COMMIT TRANSACTION
Resize the Transaction Log
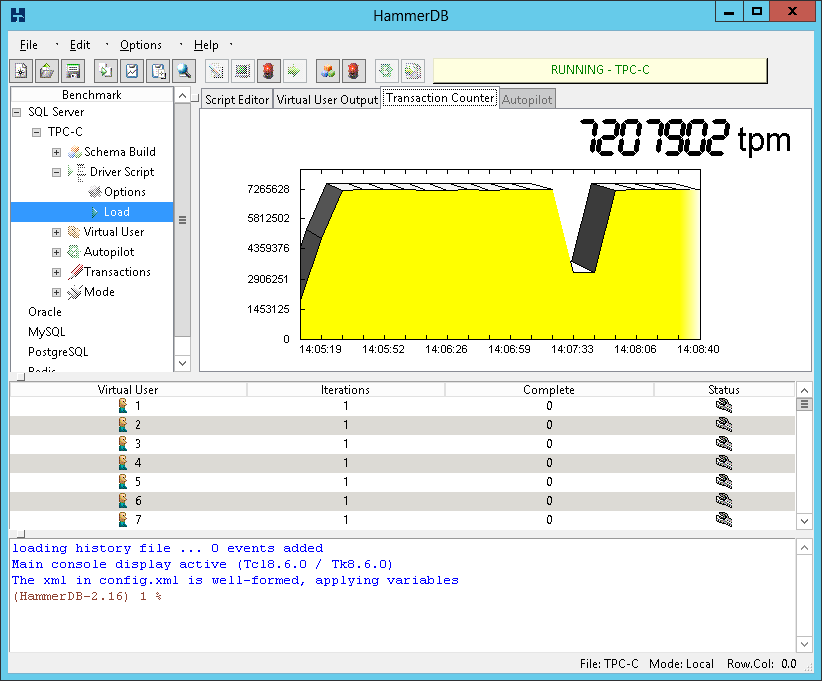
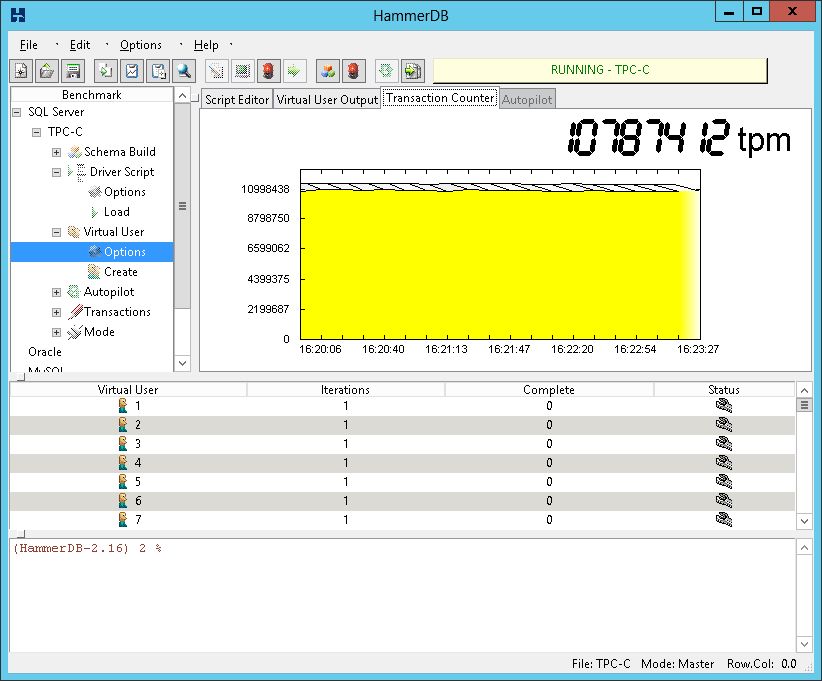
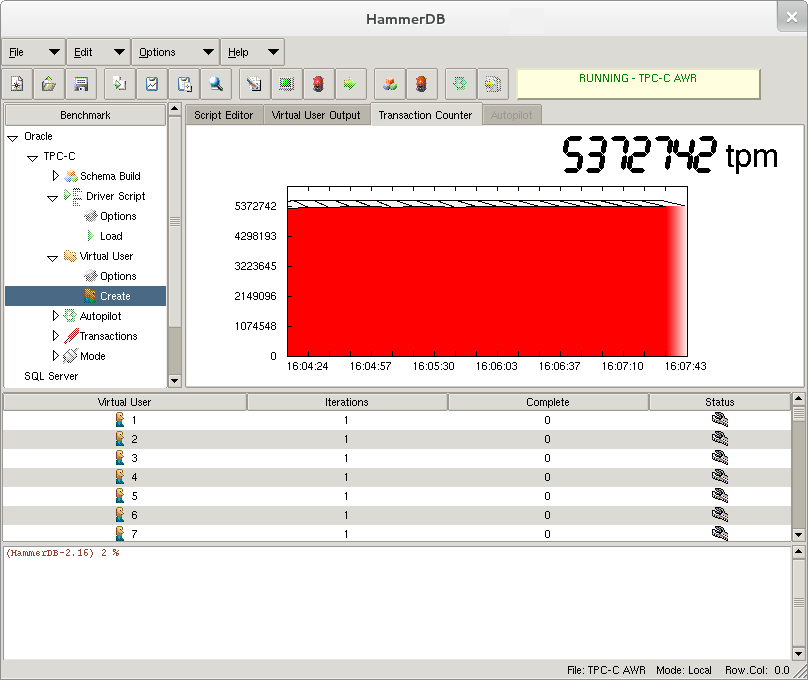
As the recovery interval has already been set to the maximum permitted a checkpoint will occur when the transaction log is 70% full, at high performance depending on the I/O write performance to your data files, the checkpoint produce an I/O effect noticeable in the HammerDB transaction counter as follows:
To observe the checkpoint set DBCC trace 3502, 3504 and 3605 and open the error log.
2014-01-15 14:04:35.18 spid56 DBCC TRACEON 3502, server process ID (SPID) 56. This is an informational message only; no user action is required.
2014-01-15 14:06:52.74 spid56 DBCC TRACEON 3504, server process ID (SPID) 56. This is an informational message only; no user action is required.
2014-01-15 14:06:52.74 spid56 DBCC TRACEON 3605, server process ID (SPID) 56. This is an informational message only; no user action is required.
The following example shows that the checkpoint took 14.7 seconds writing at 1GB/sec that coincided with the drop in performance.
2014-01-16 11:41:11.75 spid20s FlushCache: cleaned up 1932082 bufs with 948934 writes in 14739 ms (avoided 25317 new dirty bufs) for db 5:0
2014-01-16 11:41:11.75 spid20s average throughput: 1024.11 MB/sec, I/O saturation: 418155, context switches 562834
2014-01-16 11:41:11.75 spid20s last target outstanding: 31729, avgWriteLatency 26
2014-01-16 11:41:11.75 spid20s About to log Checkpoint end.
To postpone the checkpoint until after the test, resize the logfile. Being too small will cause checkpoints before the test is complete – too large impact will performance – the following example resizes the logfile to 64GB.
use tpcc
dbcc shrinkfile(‘tpcc_log’,truncateonly)
alter database tpcc modify file (name=‘tpcc_log’, size=64000)
dbcc loginfo(‘tpcc’)
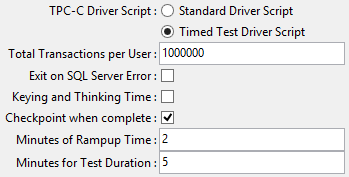
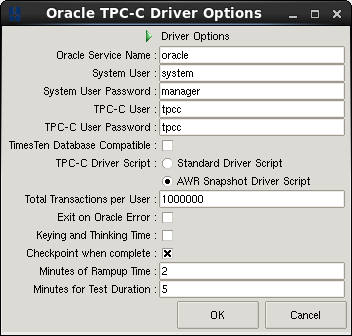
Select Checkpoint when complete to checkpoint after the timed test has completed.
Observe performance for an entire test to ensure that the transaction counter is level showing that SQL Server performance is consistent without a drop in performance for checkpoints.
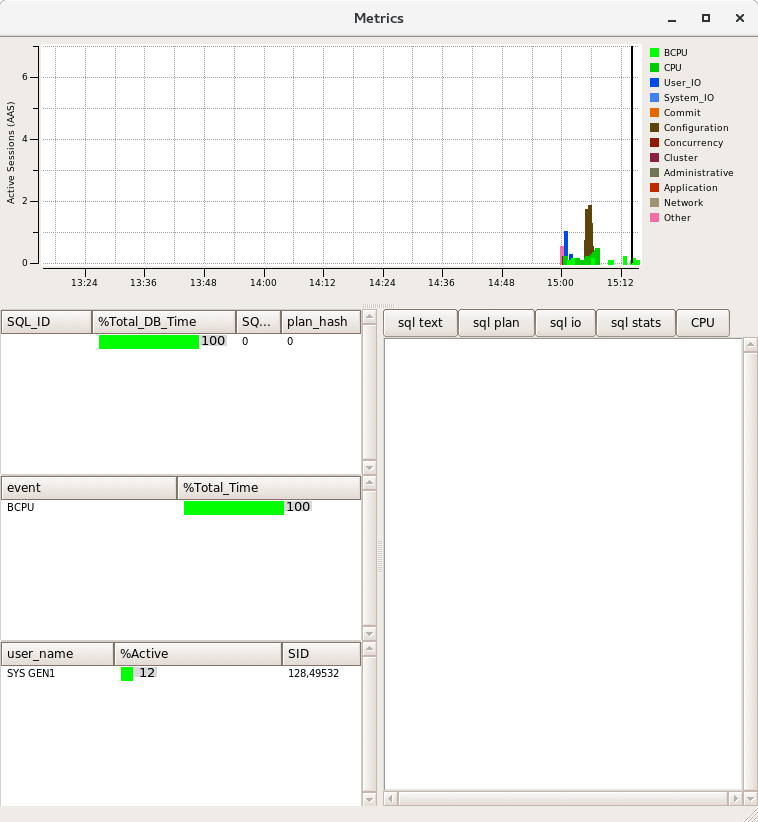
Monitoring
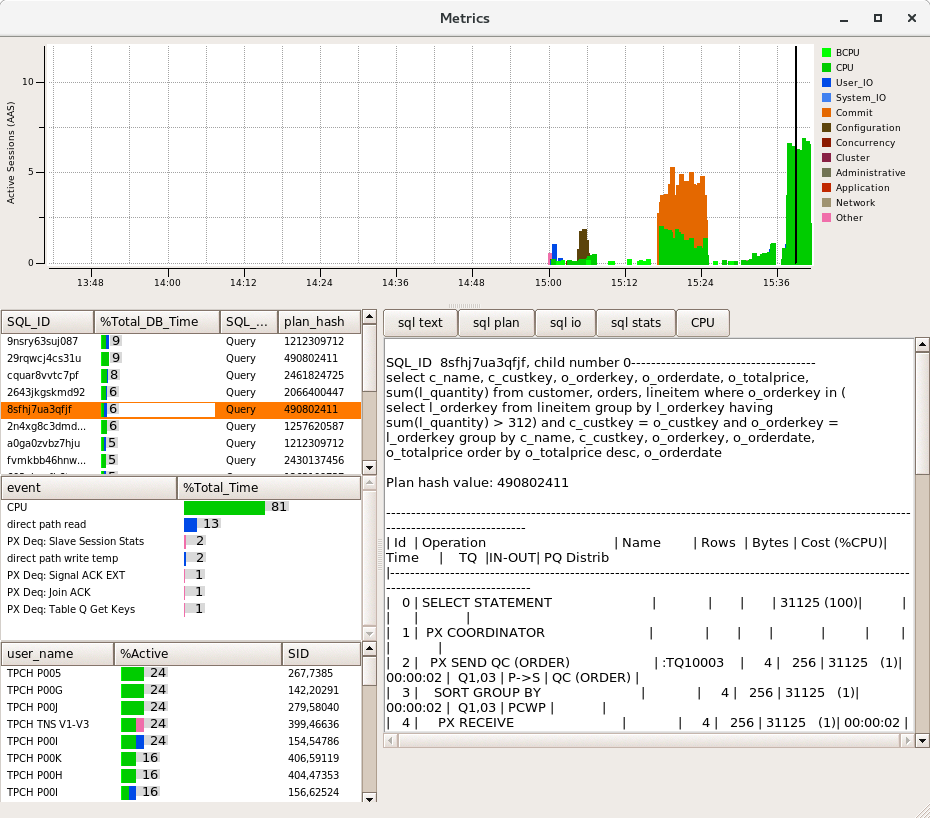
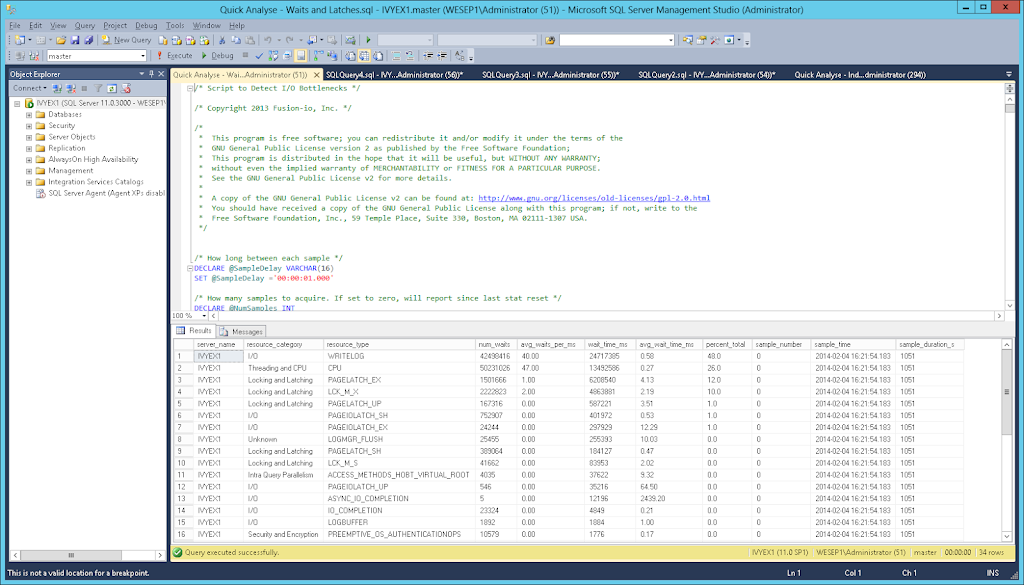
Use the Open Source Fusion-IO MS SQL Server scripts to identify the resource constraints. In this example WRITELOG is the main constraint and therefore adding LOG write I/O capacity is the best method to improve performance (as CPU is not saturated).
If the CPU is saturated on a single load generation client (and not the SUT Server) then multiple load test clients can be used using the “Master-Slave” functionality to drive a load from 2 clients simultaneously. If the CPU is not saturated on the Server without having identified other resource constraints such as I/O or network then increase the Virtual User count on the load generation client.
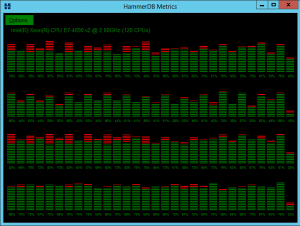
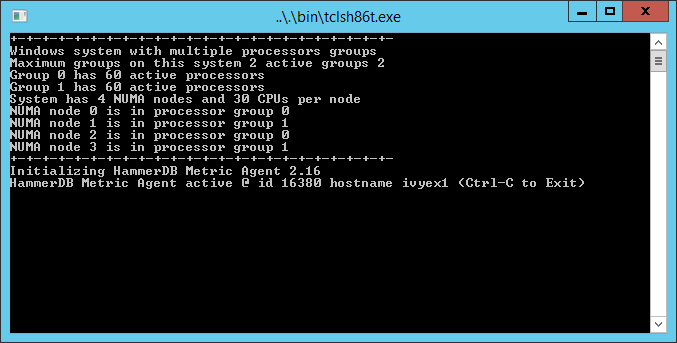
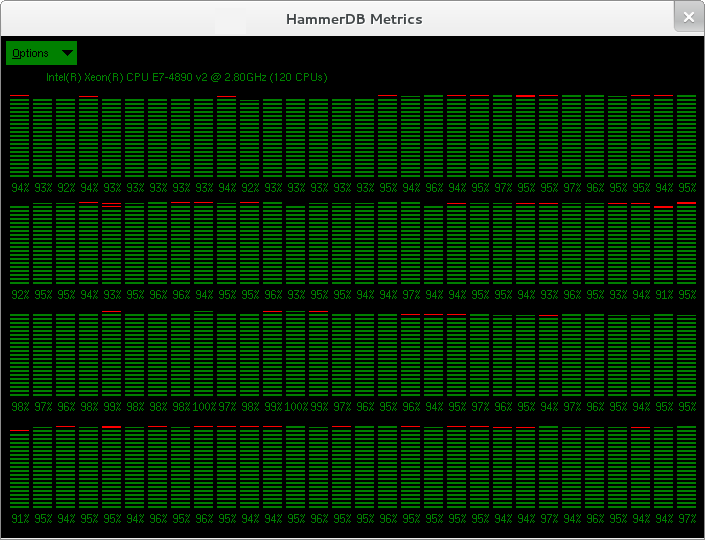
Processor Group Affinity
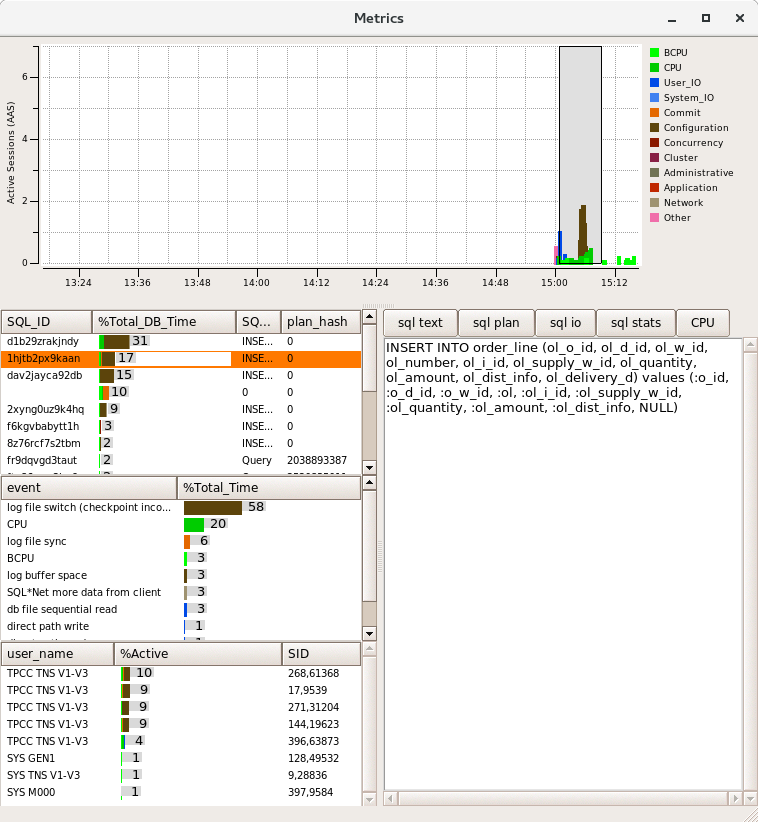
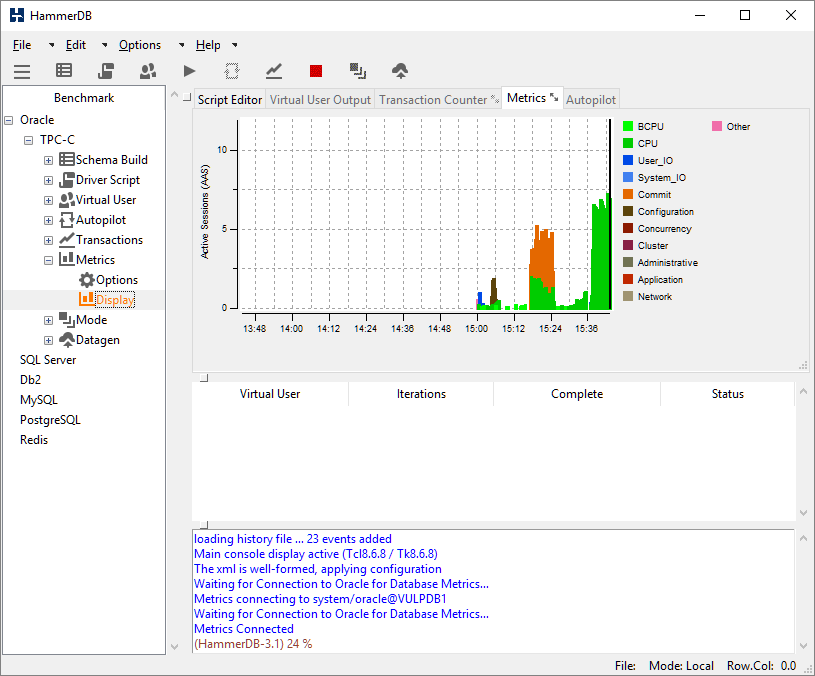
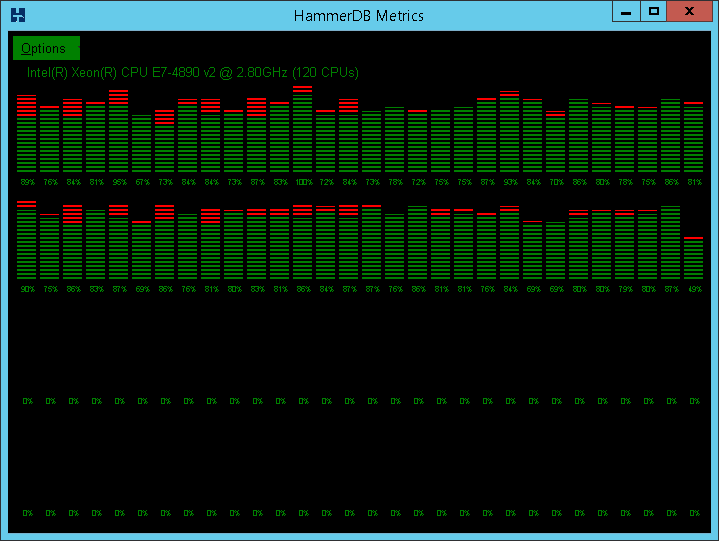
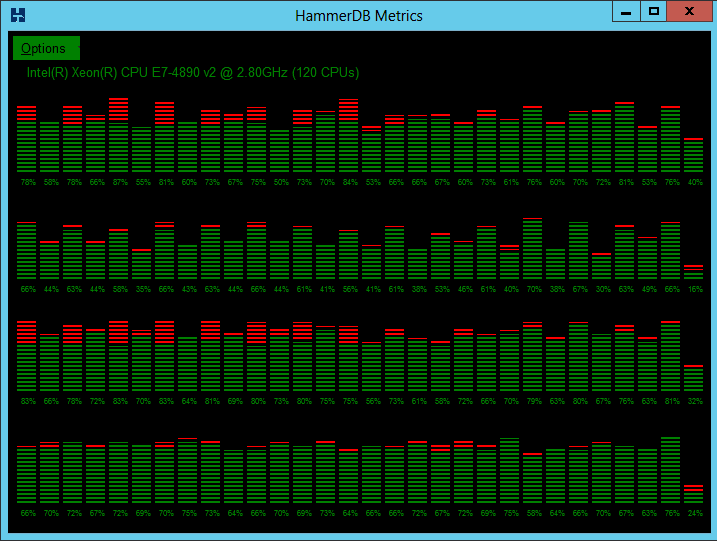
Windows Server 2008 and prior releases supported up to 64 CPUs only. Windows Server 2008 R2, 2012 and 2012 R2 supports up to 256 processors however divides these processors up into processor groups of 64 processors with handling of processor groups improving with each release of Windows. For example with 120 logical processors Windows Server 2012 R2 presents these CPUs as 2 Processor Groups of 60 logical processors each. HammerDB Metrics can be used to illustrate the usage of Processor Groups by SQL Server as shown.
Most applications (including the HammerDB client are restricted to operating within a single processor group). SQL Server is able to operate across multiple Processor Groups however may restrict client connections to a single Processor Group or subset of Processor Groups for an individual test.
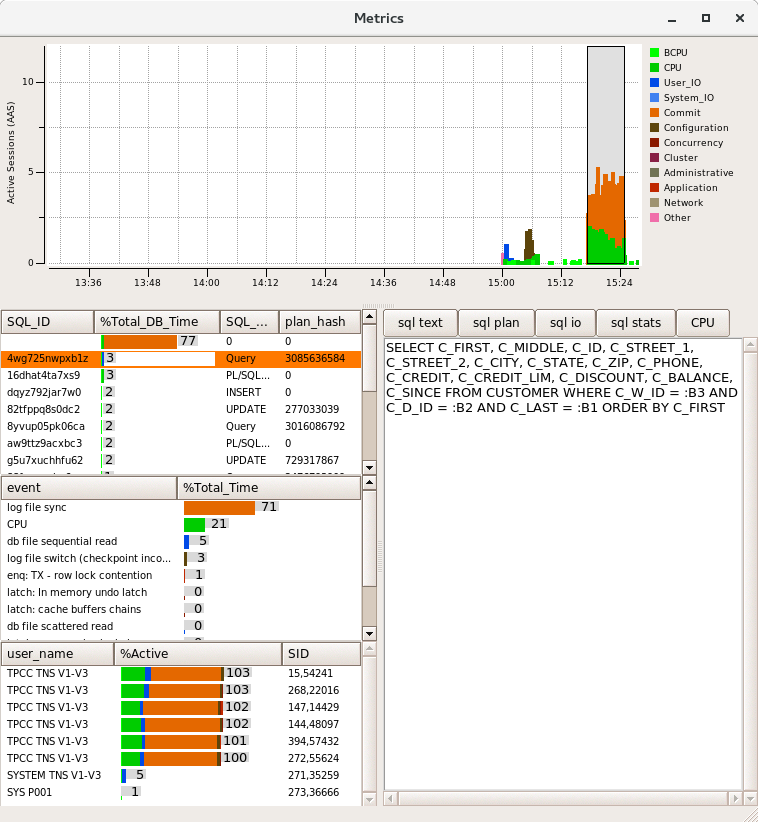
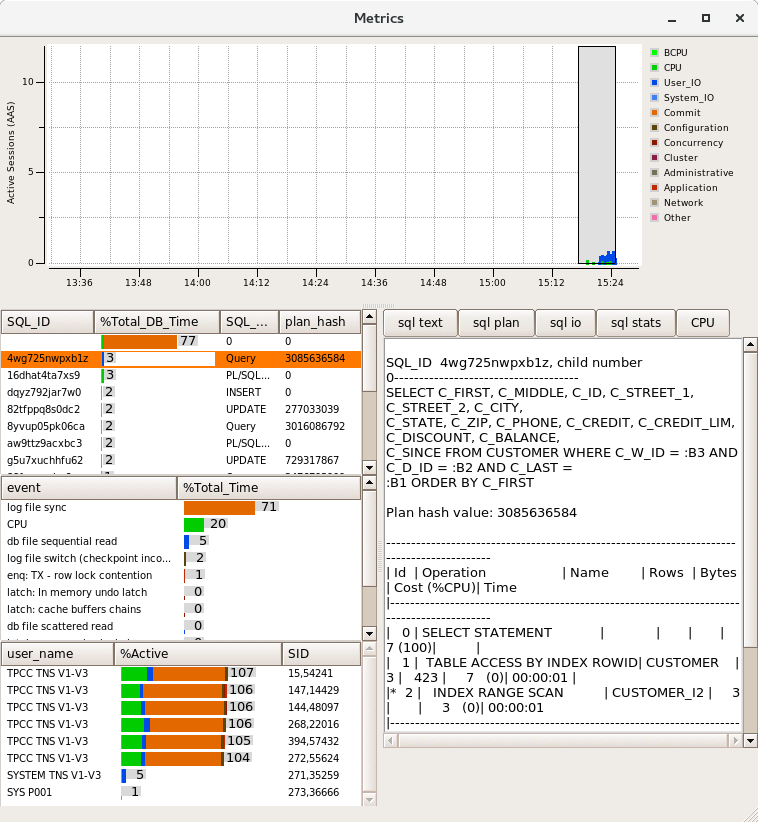
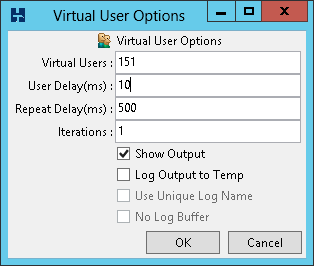
Once initially assigned sessions do not move between Processor Groups and therefore performance and CPU utilisation may be artificially limited. Using the FusionIO Monitoring Scripts previously referenced when this Processor Group limitation occurs the top wait event is shown as “Threading and CPU”. When running a test the aim is to achieve an even distribution of CPU utilization across all processors to result in good performance. Processor Group allocation is affected by modifying the allocation time. To achieve this balance, in the HammerDB virtual user options modify the User Delay parameter to 10ms, this means that the user will wait for 10ms after the previous user logged on.
A shortened connection time typically ensures an even distribution of connections across the server. Use the HammerDB Metrics tool to monitor the system to ensure good utilisation of system resources.