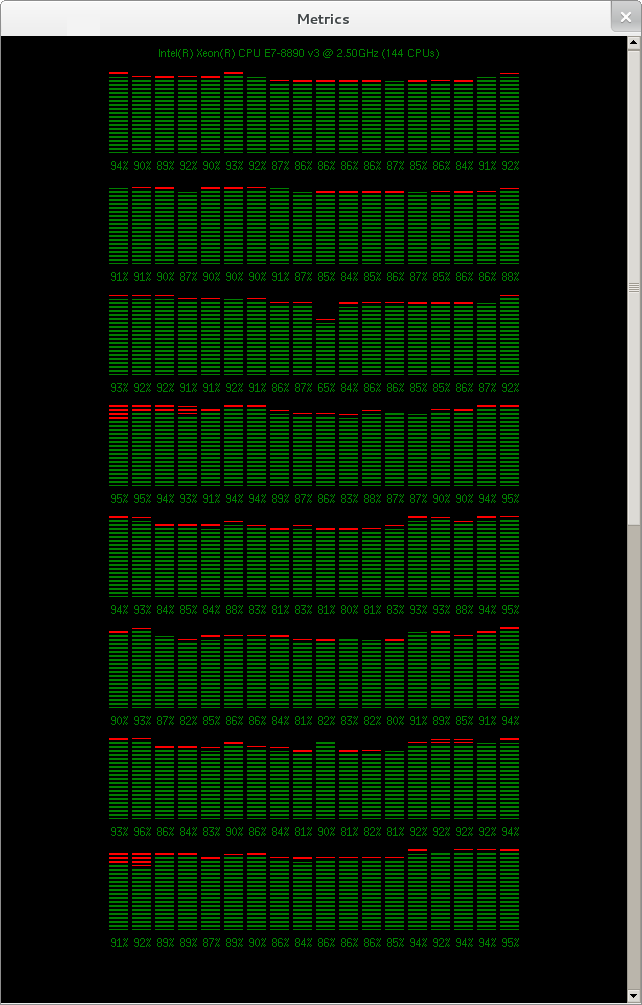
The display will now report the CPU utilisation per core on the SUT during a workload with user CPU utilisation shown in green and system utilisation shown in red. This per core about is particularly useful for diagnosing database workload issues where the load is not evenly distributed across all cores such as interrupt handling.
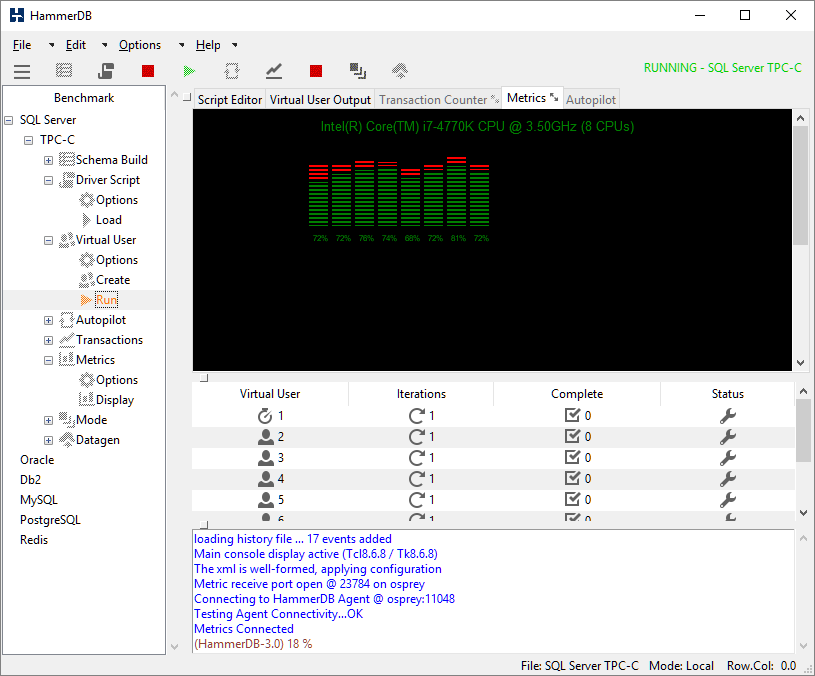
As with the transaction counter the Metrics display can be dragged out of the main window for separate viewing and the scrollbar used for reviewing large core counts.
If the agent or display is closed the corresponding connection will also close and wait for a new connection. The Metrics Display can be closed by pressing the corresponding stop button.