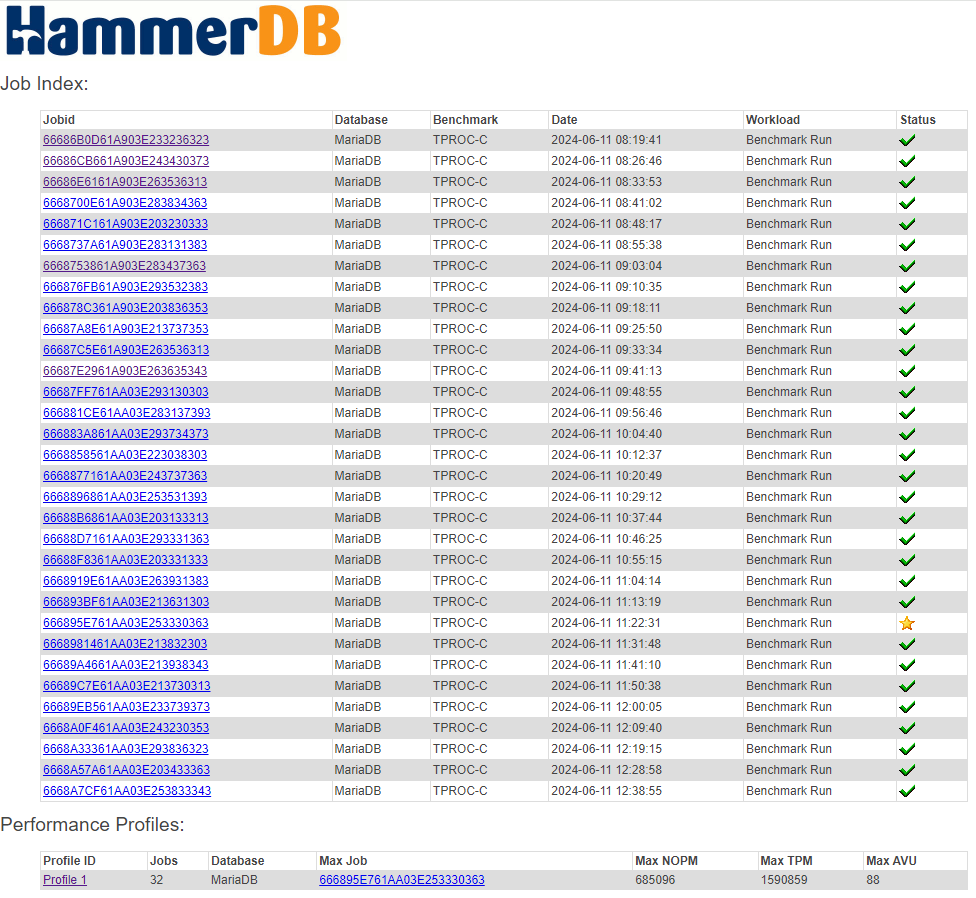
Benchmark jobs can include transaction count data, timing profile data and operating system metrics. When this data is present, the Web Service displays interactive charts for the job. TPROC-C reports can show result, response time, transaction count and metrics charts. TPROC-H reports can show query timing, result and metrics charts.
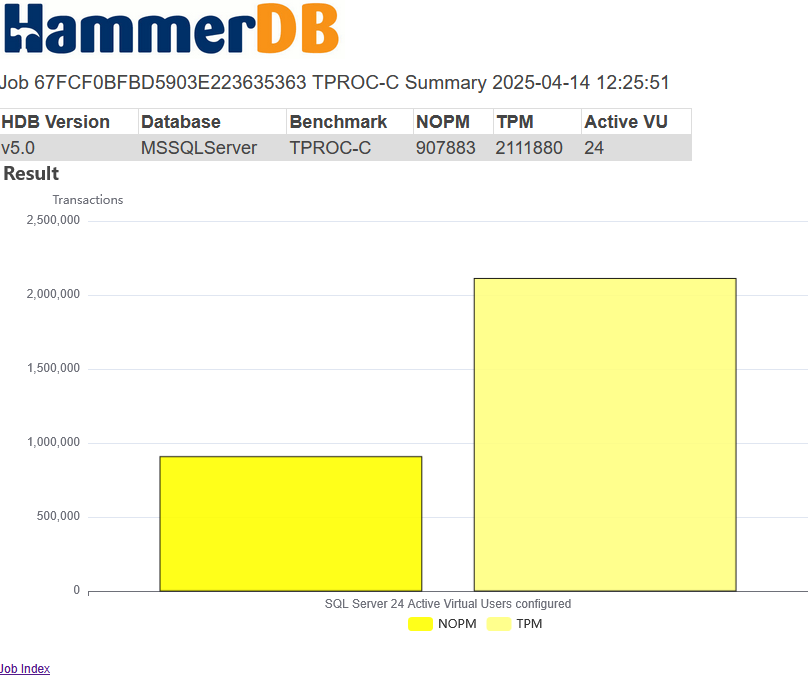
Charts are generated when the corresponding job data exists. For example, transaction count charts require transaction counter data, timing charts require timing profile data, and metrics charts require metrics collection to have been started during the benchmark run.
Performance profiles are also available from the Web Service. A profile groups related jobs under a profile id, allowing benchmark behaviour across a virtual user sequence or automated profile run to be reviewed from a single profile page.
http://localhost:8080/jobs?profileid=PROFILEID
http://localhost:8080/jobs?profileid=PROFILEID&profiledata