For an official audited TPC-C benchmark the result of the tests is detailed as tpmC which represents the number of New Orders processed. This measurement is published as a single data point representing peak performance. A particular advantage of HammerDB is is the ability to generate a performance profile as the load increases on your system (see the Autopilot feature for doing this in an unattended manner). Therefore whereas an official TPC-C benchmark gives you a single data-point and a typical single-threaded test, consider the graph shown.
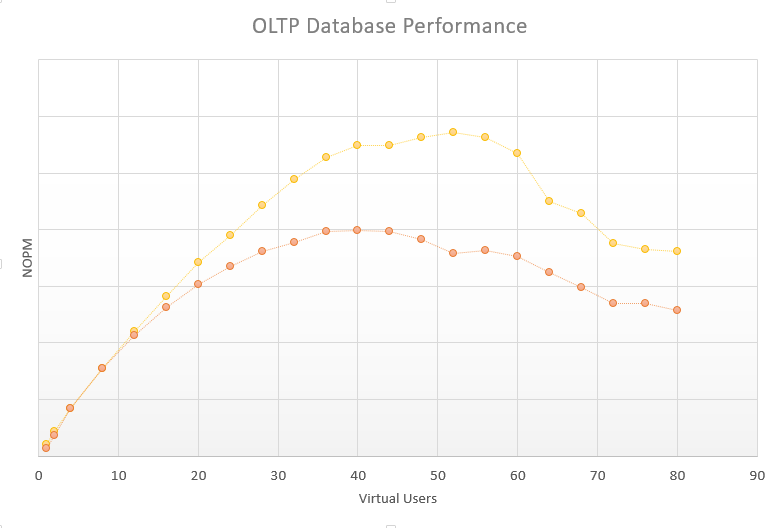
This graph shows the relative performance of real tests on different database configurations, this example in fact shows the same database on the same server with the same configuration, however with source code modifications to improve scalability. It is evident that the performance improvement only becomes visible once the system reaches beyond 16 Virtual Users. It is also clear that in both cases adding Virtual Users beyond peak performance results in lower throughput. It should therefore be clear that your testing goal for transactional systems should be to measure the performance profile of your system across all levels of utilisation starting with 1 virtual user through to peak utilisation.