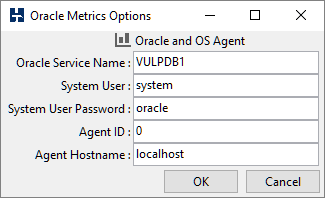
When the Oracle Database is selected on both Windows and Linux an additional option is available to connect to the Oracle Database.
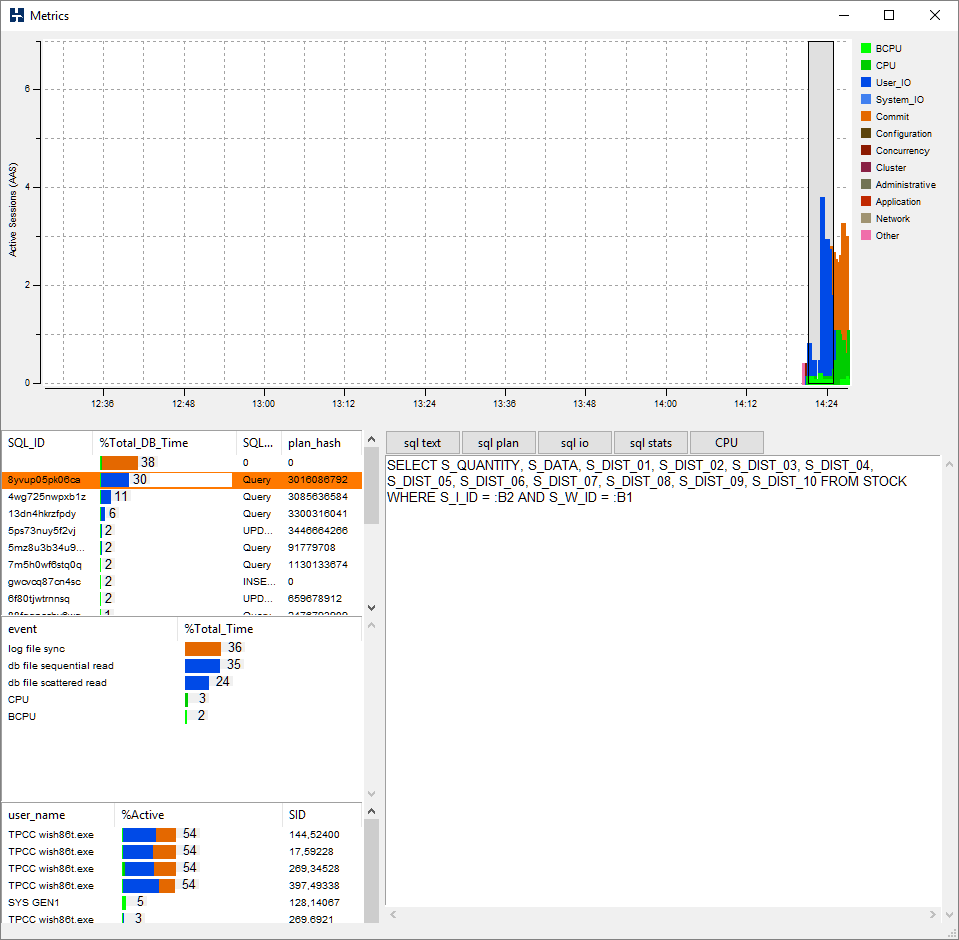
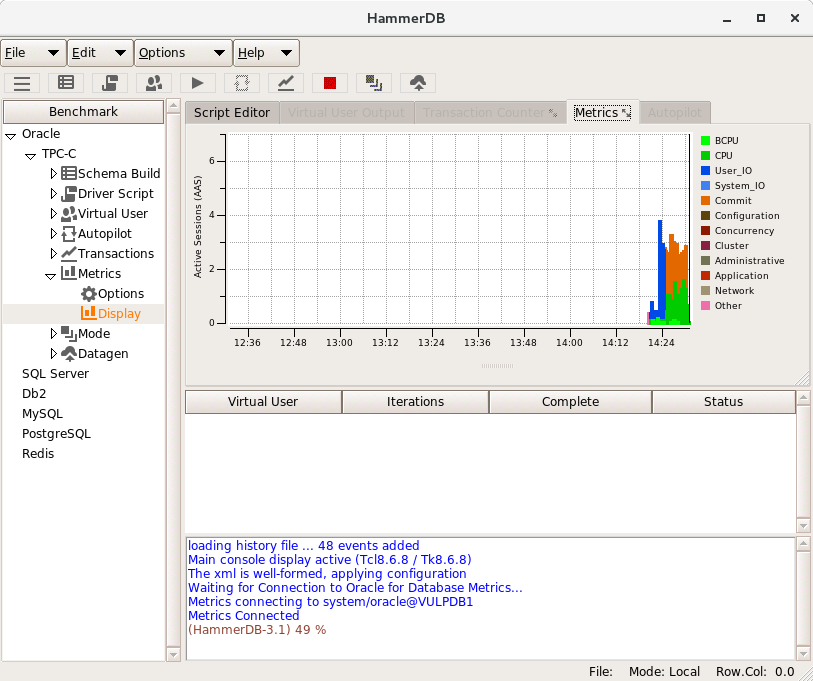
When the metrics button is pressed HammerDB connects to the database and displays graphical information from the Active Session History detailing wait events. In the example below the graph shows that at the beginning of a workload the top wait event was User IO, followed by CPU activity however a significant wait event on Commit.
As the graph extracts information from the Active Session History, it is possible to select a section from the window and display the wait events related to that period of time. The buttons enable the viewing of SQL text, the explain plan, IO statistics and SQL statistics. Note that the CPU metrics functionality as previously described is available under the CPU button.