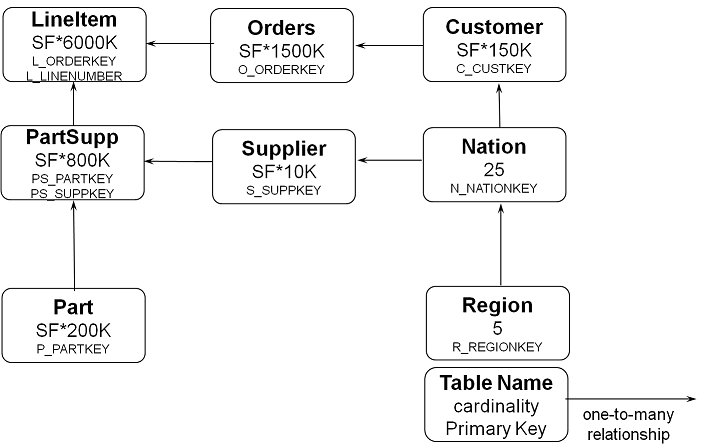
To complement the usage of the TPC-C specification for OLTP workloads HammerDB also uses the relevant TPC specification for Analytic Systems called TPC-H. Just as with the TPC-C specification the “TPC benchmarks are industry standards. The TPC, at no charge, distributes its benchmark specifications to the public.”Therefore HammerDB includes an implementation of the specification of the TPC-H benchmark that can be run in any supported database environment. As with the load tests based upon TPC-C it is important to note that the implementation is not a full specification TPC-H benchmark and the query results cannot be compared with the official published benchmarks in any way. Instead the same approach has been taken to enable you to run an accurate and repeatable query based workload against your own database. TPC-H in simple terms can be thought of as complementing the workload implemented in TPC-C related to the activities of a wholesale supplier. However whereas TPC-C simulates an online ordering system TPC-H represents the typical workload of business users inquiring about the performance of their business. To do this TPC-H is represented by a set of business focused ad-hoc queries (in addition to concurrent data updates and deletes) and is measured upon the time it takes to complete these queries. In particular the focus is upon highly complex queries that require the processing of large volumes of data. Also in similarity to TPC-C the schema size is not fixed and is dependent upon a Scale Factor and there your schema your test schema can also be as small or large as you wish with a larger schema requiring a more powerful computer system to process the increased data volume for queries. However in contrast to TPC-C it is not valid to compare the test results of query load tests taken at different Scale Factors shown as SF in the Schema diagram.
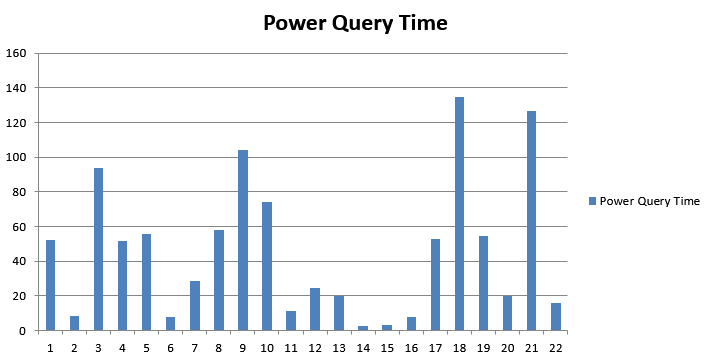
The workload is represented by users executing a stream of 22 ad-hocs queries against the database with an example query as follows:
-- using 647655760 as a seed to the RNG
 select
        l_returnflag,
        l_linestatus,
        sum(l_quantity) as sum_qty,
        sum(l_extendedprice) as sum_base_price,
        sum(l_extendedprice * (1 - l_discount)) as sum_disc_price,
        sum(l_extendedprice * (1 - l_discount) * (1 + l_tax)) as sum_charge,
        avg(l_quantity) as avg_qty,
        avg(l_extendedprice) as avg_price,
        avg(l_discount) as avg_disc,
        count(*) as count_order
from
        lineitem
where
        l_shipdate <= date '1998-12-01' – interval '69' day (3)
group by
        l_returnflag,
        l_linestatus
order by
        l_returnflag,
        l_linestatus;
In measuring the results the key aspect is the time the queries take to complete and it is recommended to use the geometric mean of the query times for comparison. A typical performance profile is represented by the time it takes the system to process a query set from Q1 to Q22 (run in a pre-determined random order).