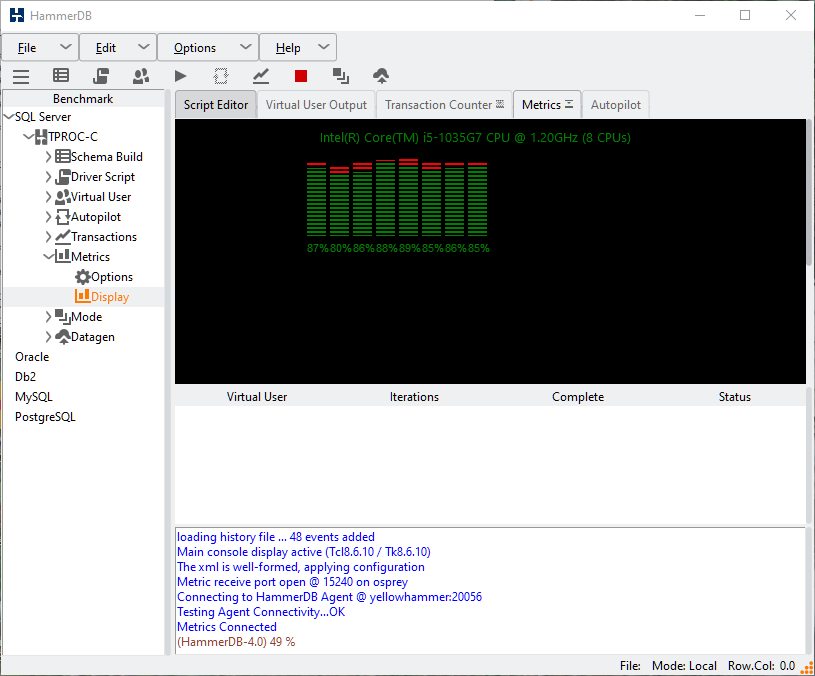
The display will now report the CPU utilisation per core on the SUT during a workload with user CPU utilisation shown in green and system utilisation shown in red. This per core about is particularly useful for diagnosing database workload issues where the load is not evenly distributed across all cores. A typical example is where all of the network interrupt handling is done on the first core, this will be evident from the HammerDB CPU metrics showing the first core at 100% system utilisation.
The agent to display configuration is compatible to run interchangeably between Linux and Windows with both the agent and display on either of the operating systems. Additionally the agent may be run to display the CPU metrics whilst the load is run from the command line or another system.
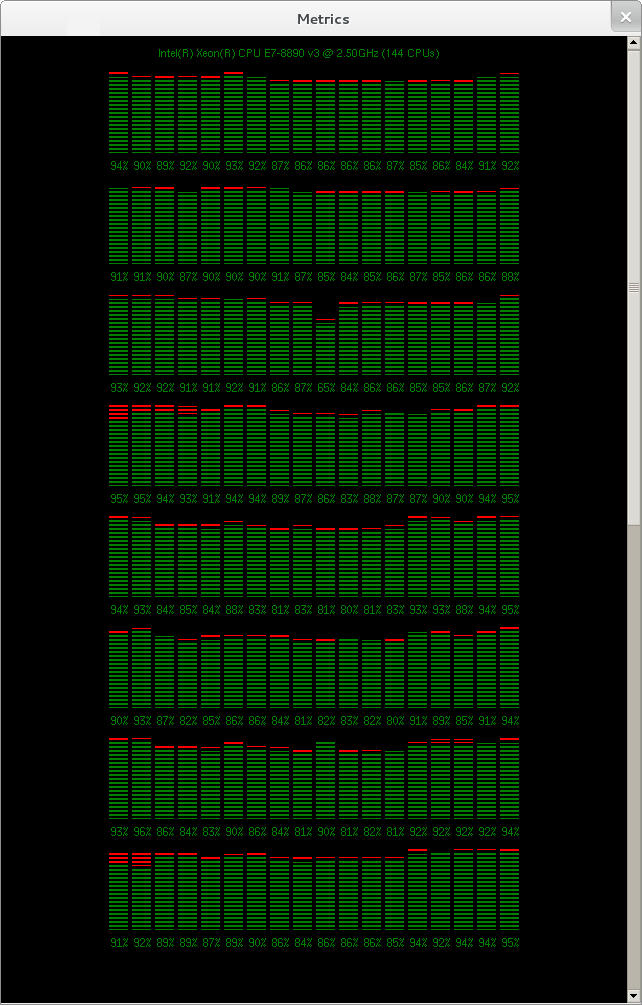
As with the transaction counter the Metrics display can be dragged out of the main window for separate viewing and the scrollbar used for reviewing large core counts.
If the agent or display is closed the corresponding connection will also close and wait for a new connection. The Metrics Display can be closed by pressing the corresponding stop button.