This section includes advanced driver script options intended for expert usage. These options can be used independently or simultaneously for advanced testing scenarios.
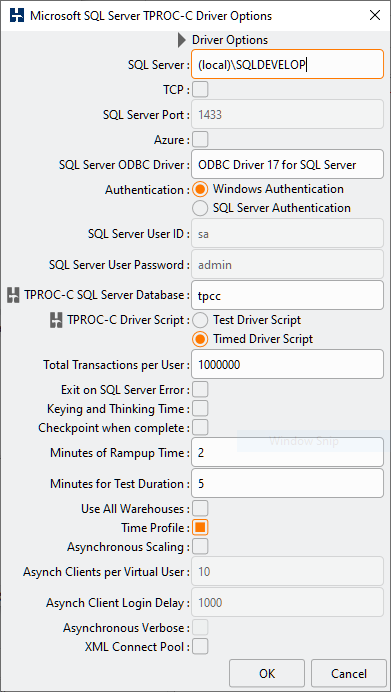
By default each Virtual User will select one home warehouse at random and keep that home warehouse for the duration of a run meaning the majority of its workload will take place on a single warehouse. This means that when running for example 10 Virtual Users most of the workload will take place on 10 warehouses regardless of whether 100, 1000 or 10,000 are configured in the schema. Use All Warehouses is an option that enables increased I/O to the database data area by assigning all of the warehouses in the schema to the Virtual Users in turn. The Virtual Users will then select a new warehouse for each transaction. Consequently this means that the schema size impacts on the overall level of performance placing a great emphasis on I/O. To select this option check the Use All Warehouses check-box.
On running the workload it can now be seen that the Virtual Users will evenly assign the available warehouses between them.
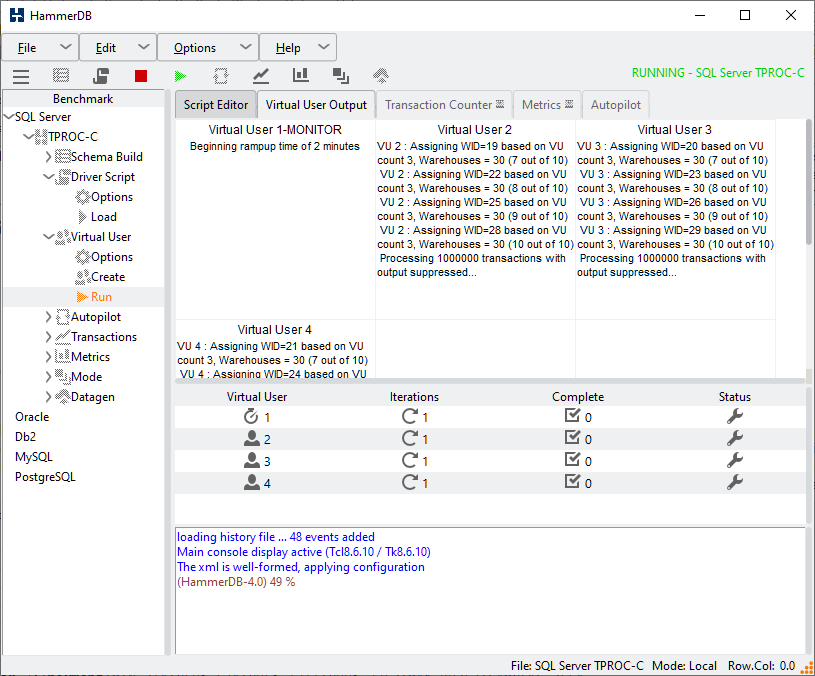
The listing shows an example of a schema with 30 warehouses and 3 Virtual Users. This approach is particularly applicable when testing I/O capabilities for database.
Vuser 1:Beginning rampup time of 2 minutes
Vuser 2:VU 2 : Assigning WID=1 based on VU count 3, Warehouses = 30 (1 out of 10)
Vuser 2:VU 2 : Assigning WID=4 based on VU count 3, Warehouses = 30 (2 out of 10)
Vuser 2:VU 2 : Assigning WID=7 based on VU count 3, Warehouses = 30 (3 out of 10)
Vuser 2:VU 2 : Assigning WID=10 based on VU count 3, Warehouses = 30 (4 out of 10)
Vuser 2:VU 2 : Assigning WID=13 based on VU count 3, Warehouses = 30 (5 out of 10)
Vuser 2:VU 2 : Assigning WID=16 based on VU count 3, Warehouses = 30 (6 out of 10)
Vuser 2:VU 2 : Assigning WID=19 based on VU count 3, Warehouses = 30 (7 out of 10)
Vuser 2:VU 2 : Assigning WID=22 based on VU count 3, Warehouses = 30 (8 out of 10)
Vuser 2:VU 2 : Assigning WID=25 based on VU count 3, Warehouses = 30 (9 out of 10)
Vuser 2:VU 2 : Assigning WID=28 based on VU count 3, Warehouses = 30 (10 out of 10)
Vuser 2:Processing 1000000 transactions with output suppressed...
Vuser 3:VU 3 : Assigning WID=2 based on VU count 3, Warehouses = 30 (1 out of 10)
Vuser 3:VU 3 : Assigning WID=5 based on VU count 3, Warehouses = 30 (2 out of 10)
Vuser 3:VU 3 : Assigning WID=8 based on VU count 3, Warehouses = 30 (3 out of 10)
Vuser 3:VU 3 : Assigning WID=11 based on VU count 3, Warehouses = 30 (4 out of 10)
Vuser 3:VU 3 : Assigning WID=14 based on VU count 3, Warehouses = 30 (5 out of 10)
Vuser 3:VU 3 : Assigning WID=17 based on VU count 3, Warehouses = 30 (6 out of 10)
Vuser 3:VU 3 : Assigning WID=20 based on VU count 3, Warehouses = 30 (7 out of 10)
Vuser 3:VU 3 : Assigning WID=23 based on VU count 3, Warehouses = 30 (8 out of 10)
Vuser 3:VU 3 : Assigning WID=26 based on VU count 3, Warehouses = 30 (9 out of 10)
Vuser 3:VU 3 : Assigning WID=29 based on VU count 3, Warehouses = 30 (10 out of 10)
Vuser 3:Processing 1000000 transactions with output suppressed...
Vuser 4:VU 4 : Assigning WID=3 based on VU count 3, Warehouses = 30 (1 out of 10)
Vuser 4:VU 4 : Assigning WID=6 based on VU count 3, Warehouses = 30 (2 out of 10)
Vuser 4:VU 4 : Assigning WID=9 based on VU count 3, Warehouses = 30 (3 out of 10)
Vuser 4:VU 4 : Assigning WID=12 based on VU count 3, Warehouses = 30 (4 out of 10)
Vuser 4:VU 4 : Assigning WID=15 based on VU count 3, Warehouses = 30 (5 out of 10)
Vuser 4:VU 4 : Assigning WID=18 based on VU count 3, Warehouses = 30 (6 out of 10)
Vuser 4:VU 4 : Assigning WID=21 based on VU count 3, Warehouses = 30 (7 out of 10)
Vuser 4:VU 4 : Assigning WID=24 based on VU count 3, Warehouses = 30 (8 out of 10)
Vuser 4:VU 4 : Assigning WID=27 based on VU count 3, Warehouses = 30 (9 out of 10)
Vuser 4:VU 4 : Assigning WID=30 based on VU count 3, Warehouses = 30 (10 out of 10)
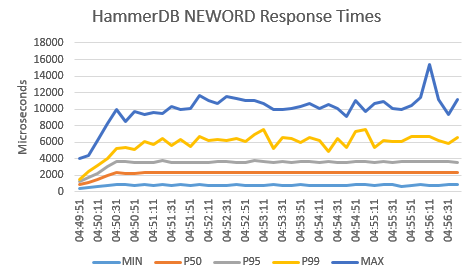
In addition to performance profiles based on throughput you should also take note of transaction response times. Whereas performance profiles show the cumulative performance of all of the virtual users running on the system, response times show performance based on the experience of the individual user. When comparing systems both throughput and response time are important comparative measurements.
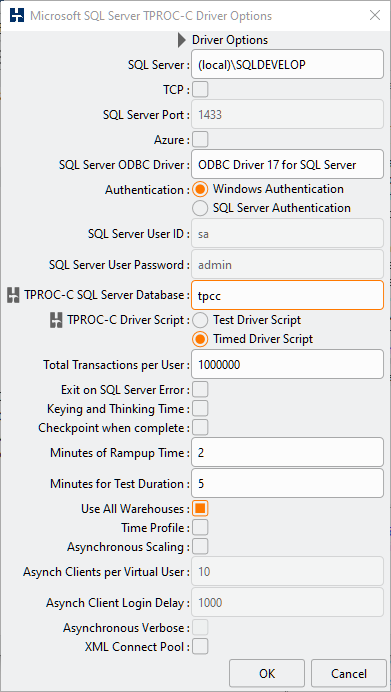
Time Profile functionality is enabled by selecting the Time Profile checkbox in the driver options for the GUI or setting the database prefix specific timeprofile option to true in the CLI.
There are different time profiling packages named xtprof and etprof with xtprof introduced at version 4.1 being the default and recommended time profiling package to use. The time profiling package is selected by modifying the timeprofile section in the generic.xml file with the options being xtprof and etprof respectively. The additional option xt_unique_log_name when set to 1 enables a unique log name to be used for the output of the time profiling data.
<timeprofile>
           <profiler>xtprof</profiler>
           <xt_unique_log_name>0</xt_unique_log_name>
           <xt_gather_timeout>10</xt_gather_timeout>
</timeprofile>
When xtprof is selected HammerDB will collect time profiling data for all active virtual users. At the end of the run after the performance has been reported all of the data will be gathered, calculated and appended to a logfile called hdbxtprofile.log or if a unique log name is used for example a log name such as hdbxtprofile_607407EE586C03E293732393.log. Measured overhead for profiling all of the virtual users is expected to be up to 4% of the throughput. Calculations take place after the test has run and will therefore not impact the performance measurements.
The xt_gather_timeout option sets a user configurable value in minutes for the time for HammerDB to wait for Virtual Users to report timings when event driven scaling is used with many 1000's of sessions. In this scenario xt_gather_timeout defines how long to wait for the Virtual User timing report until proceeding to the calculation. If no Virtual Users have reported an error is printed, if a subset of the Virtual Users have reported a timing report is printed for those Virtual Users that did report.
Vuser 1:Test complete, Taking end Transaction Count.
Vuser 1:5 VU * 10 AC = 50 Active Sessions configured
Vuser 1:TEST RESULT : System achieved 53 NOPM from 399 PostgreSQL TPM
Vuser 1:Gathering timing data from Active Virtual Users...
Vuser 4:All asynchronous clients complete
Vuser 5:All asynchronous clients complete
Vuser 3:All asynchronous clients complete
Vuser 2:All asynchronous clients complete
Vuser 1:WARNING:Timing Data Incomplete
Vuser 1:4 out of 5 Virtual Users reported
Vuser 1:Writing timing data to /tmp/hdbxtprofile.log
Within the logfile HammerDB will report for all Active Virtual Users meaning the first Virtual User will be 2 as Virtual User 1 is the monitor. The report will also provide a summary of all Active Virtual Users. Note that for the summary the total time will be for all virtual users and therefore will be equivalent to the running time multiplied by the virtual user count.
Table 4.8. Xt Time Profile
| Value | Description |
|---|---|
| CALLS | Number of times that the stored procedure was called. |
| MIN | Minimum response time in milliseconds. |
| AVG | Average response time in milliseconds. |
| MAX | Maximum response time in milliseconds. |
| TOTAL | Total time spent in that stored procedure during the measuring interval. The total time will include both rampup and timed test times. |
| P99 | 99th percentile in milliseconds. |
| P95 | 95th percentile in milliseconds. |
| P50 | 50th percentile in milliseconds. |
| SD | Standard Deviation showing variance in captured values. |
| RATIO | Ratio showing percentage time taken for that stored procedure. The total of these values may be less than 100% as only timings for the stored procedures are shown. |
an example xt time profile report is shown.
MSSQLServer Hammerdb Time Profile Report @ Fri Apr 02 10:23:56 BST 2021
+-+-+-+-+-+-+-+-+-+-+-+-+-+-+-+-+-+-+-+-+-+-+-+-+-+-+-+-+-+-+-+-+-+-+-+-+-+
>>>>> VIRTUAL USER 2 : ELAPSED TIME : 421062ms
>>>>> PROC: NEWORD
CALLS: 169244 MIN: 0.430ms AVG: 0.994ms MAX: 1042.998ms TOTAL: 168189.754ms
P99: 2.465ms P95: 1.383ms P50: 0.857ms SD: 41300.051 RATIO: 39.944%
>>>>> PROC: PAYMENT
CALLS: 169863 MIN: 0.342ms AVG: 0.854ms MAX: 1726.371ms TOTAL: 145028.480ms
P99: 2.353ms P95: 1.390ms P50: 0.685ms SD: 64474.647 RATIO: 34.443%
>>>>> PROC: DELIVERY
CALLS: 17027 MIN: 1.298ms AVG: 2.709ms MAX: 163.655ms TOTAL: 46129.940ms
P99: 5.360ms P95: 3.647ms P50: 2.541ms SD: 25810.720 RATIO: 10.956%
>>>>> PROC: SLEV
CALLS: 16822 MIN: 0.617ms AVG: 1.903ms MAX: 764.873ms TOTAL: 32006.646ms
P99: 2.308ms P95: 1.821ms P50: 1.343ms SD: 156601.733 RATIO: 7.601%
>>>>> PROC: OSTAT
CALLS: 17188 MIN: 0.213ms AVG: 1.035ms MAX: 468.477ms TOTAL: 17790.442ms
P99: 2.047ms P95: 1.483ms P50: 0.774ms SD: 77601.204 RATIO: 4.225%
+-+-+-+-+-+-+-+-+-+-+-+-+-+-+-+-+-+-+-+-+-+-+-+-+-+-+-+-+-+-+-+-+-+-+-+-+-+
>>>>> VIRTUAL USER 3 : ELAPSED TIME : 420313ms
>>>>> PROC: NEWORD
CALLS: 159980 MIN: 0.444ms AVG: 1.022ms MAX: 1643.138ms TOTAL: 163441.841ms
P99: 2.567ms P95: 1.492ms P50: 0.862ms SD: 58276.974 RATIO: 38.886%
>>>>> PROC: PAYMENT
CALLS: 160285 MIN: 0.346ms AVG: 0.881ms MAX: 2023.197ms TOTAL: 141213.427ms
P99: 2.503ms P95: 1.473ms P50: 0.705ms SD: 65938.596 RATIO: 33.597%
>>>>> PROC: DELIVERY
CALLS: 16069 MIN: 1.272ms AVG: 3.417ms MAX: 206.193ms TOTAL: 54904.266ms
P99: 7.418ms P95: 5.324ms P50: 3.192ms SD: 32127.714 RATIO: 13.063%
>>>>> PROC: SLEV
CALLS: 16050 MIN: 0.678ms AVG: 2.006ms MAX: 626.750ms TOTAL: 32200.179ms
P99: 2.643ms P95: 1.910ms P50: 1.343ms SD: 168030.717 RATIO: 7.661%
>>>>> PROC: OSTAT
CALLS: 16000 MIN: 0.222ms AVG: 1.072ms MAX: 578.273ms TOTAL: 17157.497ms
P99: 2.063ms P95: 1.489ms P50: 0.782ms SD: 90527.786 RATIO: 4.082%
+-+-+-+-+-+-+-+-+-+-+-+-+-+-+-+-+-+-+-+-+-+-+-+-+-+-+-+-+-+-+-+-+-+-+-+-+-+
>>>>> VIRTUAL USER 4 : ELAPSED TIME : 419788ms
>>>>> PROC: NEWORD
CALLS: 171907 MIN: 0.439ms AVG: 0.970ms MAX: 1013.525ms TOTAL: 166696.636ms
P99: 2.488ms P95: 1.342ms P50: 0.833ms SD: 40049.741 RATIO: 39.710%
>>>>> PROC: PAYMENT
CALLS: 171395 MIN: 0.348ms AVG: 0.825ms MAX: 2027.276ms TOTAL: 141448.137ms
P99: 2.309ms P95: 1.353ms P50: 0.669ms SD: 59576.289 RATIO: 33.695%
>>>>> PROC: DELIVERY
CALLS: 17242 MIN: 1.292ms AVG: 2.783ms MAX: 1662.594ms TOTAL: 47976.469ms
P99: 5.314ms P95: 3.614ms P50: 2.487ms SD: 145408.189 RATIO: 11.429%
>>>>> PROC: SLEV
CALLS: 17149 MIN: 0.637ms AVG: 1.911ms MAX: 1053.436ms TOTAL: 32775.092ms
P99: 2.231ms P95: 1.805ms P50: 1.319ms SD: 169897.509 RATIO: 7.808%
>>>>> PROC: OSTAT
CALLS: 17379 MIN: 0.221ms AVG: 1.076ms MAX: 385.704ms TOTAL: 18699.482ms
P99: 2.059ms P95: 1.463ms P50: 0.754ms SD: 82806.139 RATIO: 4.455%
+-+-+-+-+-+-+-+-+-+-+-+-+-+-+-+-+-+-+-+-+-+-+-+-+-+-+-+-+-+-+-+-+-+-+-+-+-+
>>>>> VIRTUAL USER 5 : ELAPSED TIME : 419663ms
>>>>> PROC: NEWORD
CALLS: 171092 MIN: 0.424ms AVG: 0.967ms MAX: 1229.934ms TOTAL: 165440.937ms
P99: 2.408ms P95: 1.356ms P50: 0.839ms SD: 43716.072 RATIO: 39.422%
>>>>> PROC: PAYMENT
CALLS: 171379 MIN: 0.331ms AVG: 0.829ms MAX: 1731.137ms TOTAL: 142134.192ms
P99: 2.240ms P95: 1.372ms P50: 0.676ms SD: 66909.786 RATIO: 33.869%
>>>>> PROC: DELIVERY
CALLS: 17376 MIN: 1.333ms AVG: 2.711ms MAX: 522.322ms TOTAL: 47110.423ms
P99: 5.066ms P95: 3.665ms P50: 2.502ms SD: 55115.193 RATIO: 11.226%
>>>>> PROC: SLEV
CALLS: 17000 MIN: 0.677ms AVG: 2.060ms MAX: 638.143ms TOTAL: 35019.365ms
P99: 2.227ms P95: 1.820ms P50: 1.324ms SD: 181337.117 RATIO: 8.345%
>>>>> PROC: OSTAT
CALLS: 17393 MIN: 0.230ms AVG: 1.028ms MAX: 416.741ms TOTAL: 17880.809ms
P99: 2.069ms P95: 1.485ms P50: 0.765ms SD: 78776.046 RATIO: 4.261%
+-+-+-+-+-+-+-+-+-+-+-+-+-+-+-+-+-+-+-+-+-+-+-+-+-+-+-+-+-+-+-+-+-+-+-+-+-+
>>>>> VIRTUAL USER 6 : ELAPSED TIME : 418748ms
>>>>> PROC: NEWORD
CALLS: 156981 MIN: 0.440ms AVG: 1.046ms MAX: 1612.589ms TOTAL: 164162.970ms
P99: 2.758ms P95: 1.525ms P50: 0.882ms SD: 63714.779 RATIO: 39.203%
>>>>> PROC: PAYMENT
CALLS: 157020 MIN: 0.351ms AVG: 0.895ms MAX: 2026.866ms TOTAL: 140488.701ms
P99: 2.654ms  P95: 1.525ms P50: 0.719ms SD: 61228.592 RATIO: 33.550%
>>>>> PROC: DELIVERY
CALLS: 15770 MIN: 1.383ms AVG: 3.498ms MAX: 788.532ms TOTAL: 55159.762ms
P99: 7.326ms P95: 5.431ms P50: 3.250ms SD: 66690.551 RATIO: 13.173%
>>>>> PROC: SLEV
CALLS: 15797 MIN: 0.670ms AVG: 1.947ms MAX: 583.215ms TOTAL: 30754.041ms
P99: 2.723ms P95: 1.898ms P50: 1.380ms SD: 152847.699 RATIO: 7.344%
>>>>> PROC: OSTAT
CALLS: 15976 MIN: 0.238ms AVG: 1.024ms MAX: 343.665ms TOTAL: 16364.749ms
P99: 2.089ms P95: 1.527ms P50: 0.790ms SD: 63035.213 RATIO: 3.908%
+-+-+-+-+-+-+-+-+-+-+-+-+-+-+-+-+-+-+-+-+-+-+-+-+-+-+-+-+-+-+-+-+-+-+-+-+-+
>>>>> SUMMARY OF 5 ACTIVE VIRTUAL USERS : MEDIAN ELAPSED TIME : 419788ms
>>>>> PROC: NEWORD
CALLS: 829204 MIN: 0.424ms AVG: 0.998ms MAX: 1643.139ms TOTAL: 827932.303ms
P99: 2.542ms P95: 1.419ms P50: 0.854ms SD: 49988.460 RATIO: 39.445%
>>>>> PROC: PAYMENT
CALLS: 829942 MIN: 0.331ms AVG: 0.856ms MAX: 2027.278ms TOTAL: 710313.076ms
P99: 2.412ms P95: 1.424ms P50: 0.690ms SD: 63696.833 RATIO: 33.841%
>>>>> PROC: DELIVERY
CALLS: 83484 MIN: 1.272ms AVG: 3.010ms MAX: 1662.596ms TOTAL: 251280.909ms
P99: 6.723ms P95: 4.607ms P50: 2.694ms SD: 78650.494 RATIO: 11.972%
>>>>> PROC: SLEV
CALLS: 82818 MIN: 0.617ms AVG: 1.965ms MAX: 1053.437ms TOTAL: 162755.356ms
P99: 2.419ms P95: 1.851ms P50: 1.341ms SD: 166238.802 RATIO: 7.754%
>>>>> PROC: OSTAT
CALLS: 83936 MIN: 0.213ms AVG: 1.047ms MAX: 578.273ms TOTAL: 87892.997ms
P99: 2.067ms P95: 1.488ms P50: 0.772ms SD: 79101.309 RATIO: 4.187%
+-+-+-+-+-+-+-+-+-+-+-+-+-+-+-+-+-+-+-+-+-+-+-+-+-+-+-+-+-+-+-+-+-+-+-+-+-+
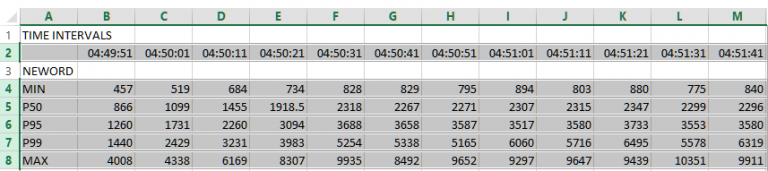
An alternative time profiling package time called etprof can be selected by modifying the timeprofile section in generic.xml to change xtprof to etprof. A key difference between etprof and xtprof is that whereas xtprof enables you to capture time profiling for all virtual users etprof only enables you to select the first Active Virtual User and measure the response times. When enabled the time profile will show response time percentile values at 10 second intervals, reporting the minimum, 50th percentile, 95th percentile, 99th percentile and maximum for each of the procedures during that 10 second interval as well as cumulative values for all of the test at the end of the test run. For etprof the time profile values are recorded in microseconds. etprof should be viewed as way to drill down into an individual virtual user after analyzing xtprof data.
Hammerdb Log @ Fri Jul 05 09:55:26 BST 2019
+-+-+-+-+-+-+-+-+-+-+-+-+-+-+-+-+-+-+-+-+-+-
Vuser 1:Beginning rampup time of 1 minutes
Vuser 2:Processing 1000000 transactions with output suppressed...
Vuser 3:Processing 1000000 transactions with output suppressed...
Vuser 4:Processing 1000000 transactions with output suppressed...
Vuser 5:Processing 1000000 transactions with output suppressed...
Vuser 2:|PERCENTILES 2019-07-05 09:55:46 to 2019-07-05 09:55:56
Vuser 2:|neword|MIN-391|P50%-685|P95%-1286|P99%-3298|MAX-246555|SAMPLES-3603
Vuser 2:|payment|MIN-314|P50%-574|P95%-1211|P99%-2253|MAX-89367|SAMPLES-3564
Vuser 2:|delivery|MIN-1128|P50%-1784|P95%-2784|P99%-6960|MAX-267012|SAMPLES-356
Vuser 2:|slev|MIN-723|P50%-884|P95%-1363|P99%-3766|MAX-120687|SAMPLES-343
Vuser 2:|ostat|MIN-233|P50%-568|P95%-1325|P99%-2387|MAX-82538|SAMPLES-365
Vuser 2:|gettimestamp|MIN-2|P50%-4|P95%-7|P99%-14|MAX-39|SAMPLES-7521
Vuser 2:|prep_statement|MIN-188|P50%-209|P95%-1067|P99%-1067|MAX-1067|SAMPLES-6
Vuser 2:+-----------------+--------------+------+--------+--------------+--------------+
...
Vuser 2:+-----------------+--------------+------+--------+--------------+--------------+
Vuser 2:|PERCENTILES 2019-07-05 09:59:26 to 2019-07-05 09:59:36
Vuser 2:|neword|MIN-410|P50%-678|P95%-1314|P99%-4370|MAX-32030|SAMPLES-4084
Vuser 2:|payment|MIN-331|P50%-583|P95%-1271|P99%-3152|MAX-43996|SAMPLES-4142
Vuser 2:|delivery|MIN-1177|P50%-2132|P95%-3346|P99%-4040|MAX-8492|SAMPLES-416
Vuser 2:|slev|MIN-684|P50%-880|P95%-1375|P99%-1950|MAX-230733|SAMPLES-364
Vuser 2:|ostat|MIN-266|P50%-688.5|P95%-1292|P99%-1827|MAX-9790|SAMPLES-427
Vuser 2:|gettimestamp|MIN-3|P50%-4|P95%-7|P99%-14|MAX-22|SAMPLES-8639
Vuser 2:+-----------------+--------------+------+--------+--------------+--------------+
Vuser 2:|PERCENTILES 2019-07-05 09:59:36 to 2019-07-05 09:59:46
Vuser 2:|neword|MIN-404|P50%-702|P95%-1296|P99%-4318|MAX-71663|SAMPLES-3804
Vuser 2:|payment|MIN-331|P50%-597|P95%-1250|P99%-4190|MAX-47539|SAMPLES-3879
Vuser 2:|delivery|MIN-1306|P50%-2131|P95%-4013|P99%-8742|MAX-25095|SAMPLES-398
Vuser 2:|slev|MIN-713|P50%-913|P95%-1438|P99%-2043|MAX-7434|SAMPLES-386
Vuser 2:|ostat|MIN-268|P50%-703|P95%-1414|P99%-3381|MAX-249963|SAMPLES-416
Vuser 2:|gettimestamp|MIN-3|P50%-4|P95%-8|P99%-16|MAX-27|SAMPLES-8079
Vuser 2:+-----------------+--------------+------+--------+--------------+--------------+
Vuser 1:3 ...,
Vuser 1:Test complete, Taking end Transaction Count.
Vuser 1:4 Active Virtual Users configured
Vuser 1:TEST RESULT : System achieved 468610 SQL Server TPM at 101789 NOPM
Vuser 2:+-----------------+--------------+------+--------+--------------+--------------+
Vuser 2:|PROCNAME | EXCLUSIVETOT| %| CALLNUM| AVGPERCALL| CUMULTOT|
Vuser 2:+-----------------+--------------+------+--------+--------------+--------------+
Vuser 2:|neword | 82051665|39.96%| 93933| 873| 88760245|
Vuser 2:|payment | 73823956|35.95%| 93922| 786| 80531339|
Vuser 2:|delivery | 22725292|11.07%| 9577| 2372| 23418195|
Vuser 2:|slev | 14396765| 7.01%| 9340| 1541| 14402033|
Vuser 2:|ostat | 10202116| 4.97%| 9412| 1083| 10207260|
Vuser 2:|gettimestamp | 2149552| 1.05%| 197432| 10| 13436919|
Vuser 2:|TOPLEVEL | 2431| 0.00%| 1| 2431| NOT AVAILABLE|
Vuser 2:|prep_statement | 1935| 0.00%| 5| 387| 1936|
Vuser 2:+-----------------+--------------+------+--------+--------------+--------------+
After capturing the response time the script below can be run at the command line and provided with a logfile with the data for one run only. Note that it is important that you only provide a logfile for one run of a HammerDB benchmark to convert, otherwise all of the data will be combined from multiple runs. When run on a logfile with data such as shown above this will output the data in tab delimited format that can be interpreted by a spreadsheet.
!/bin/tclsh
 set filename [lindex $argv 0]
 set fp [open "$filename" r]
 set file_data [ read $fp ]
 set data [split $file_data "\n"]
 foreach line $data {
 if {[ string match *PERCENTILES* $line ]} {
 set timeval "[ lindex [ split $line ] 3 ]"
 append xaxis "$timeval\t"
         }
     }
 puts "TIME INTERVALS"
 puts "\t$xaxis"
 foreach storedproc {neword payment delivery slev ostat} {
 puts [ string toupper $storedproc ]
 foreach line $data {
 if {[ string match *PROCNAME* $line ]} { break }
 if {[ string match *$storedproc* $line ]} {
 regexp {MIN-[0-9.]+} $line min
 regsub {MIN-} $min "" min
 append minlist "$min\t"
 regexp {P50%-[0-9.]+} $line p50
 regsub {P50%-} $p50 "" p50
 append p50list "$p50\t"
 regexp {P95%-[0-9.]+} $line p95
 regsub {P95%-} $p95 "" p95
 append p95list "$p95\t"
 regexp {P99%-[0-9.]+} $line p99
 regsub {P99%-} $p99 "" p99
 append p99list "$p99\t"
 regexp {MAX-[0-9.]+} $line max
 regsub {MAX-} $max "" max
 append maxlist "$max\t"
     }
       }
 puts -nonewline "MIN\t"
 puts $minlist
 unset -nocomplain minlist
 puts -nonewline "P50\t"
 puts $p50list
 unset -nocomplain p50list
 puts -nonewline "P95\t"
 puts $p95list
 unset -nocomplain p95list
 puts -nonewline "P99\t"
 puts $p99list
 unset -nocomplain p99list
 puts -nonewline "MAX\t"
 puts $maxlist
 unset -nocomplain maxlist
     }
 close $fp
Pass the name of the logfile for the run where response times were captured and output them to a file with a spreadsheet extension name. Note that it is important to output the data to a file and not to a terminal with that data then cut and paste into a spreadsheet. If output to a terminal it may format the output by removing the tab characters which are essential to the formatting.
$ ./extracttp.tcl pgtp.log > pgtp.txt
With Excel 2013 and above you can give this file a .xls extension and open it. If you do it will give the following warning, however if you click OK it will open with the correctly formatted data.

Alternatively if we open the file with the .txt extension it will show 3 steps for the Text Import Wizard. Click through the Wizard until Finish, After clicking Finish the data has been imported into the spreadsheet without warnings. Highlight the rows you want to graph by clicking on the row numbers.
Click on Insert and Recommended Charts, the default graph produced by Excel is shown below with the addition of a vertical axis title and a chart header. When saving the spreadsheet it is saved in Excel format rather than the imported Tab (Text Delimited).
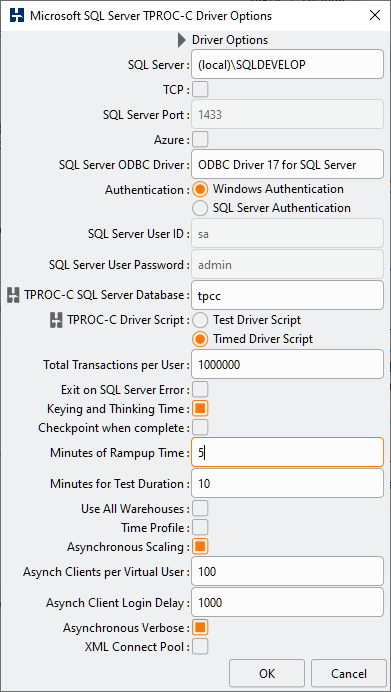
Event driven scaling enables the scaling of virtual users to thousands of sessions running with keying and thinking time enabled. This feature adds additional benefit to your testing scenarios with the ability to handle large numbers of connections or testing with connection pooling. When running transactional workloads with HammerDB the default mode is CPU intensive meaning that one virtual user will run as many transactions as possible without keying and thinking time enabled. When keying and thinking time is enabled there is a large time delay both before and after running a transaction meaning that each Virtual User will spend most of its time idle. However creating a very large number of Virtual Users requires a significant use of load test generation server resources. Consequently event driven scaling is a feature that enables each Virtual User to create multiple database sessions and manage the keying and thinking time for each asynchronously in an event-driven loop enabling HammerDB to create a much larger session count within an existing Virtual User footprint. It should be clear that this feature is only designed to work with keying and thinking time enabled as it is only the keying and thinking time that is managed asynchronously.
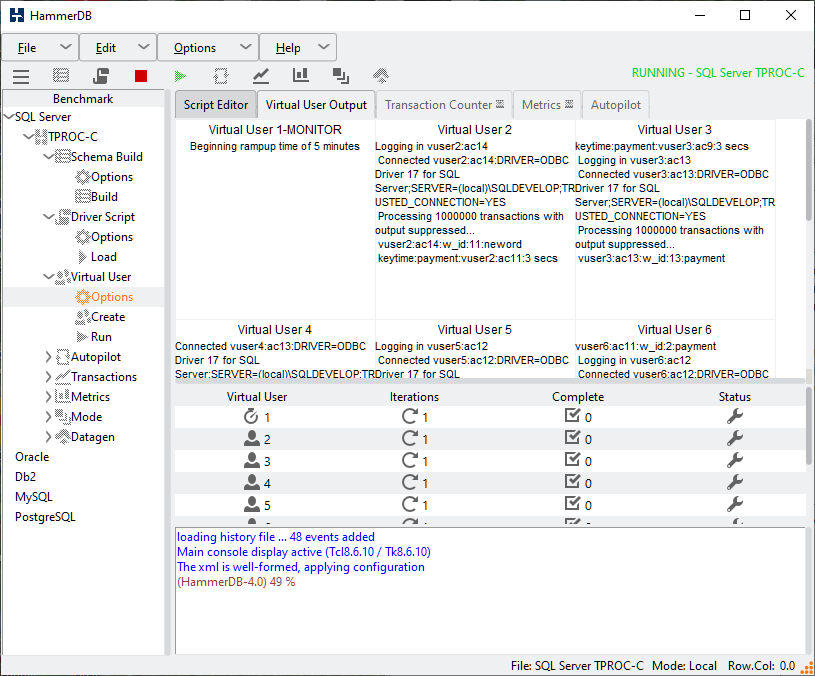
To configure this feature select Asynchronous Scaling noting that Keying and Thinking Time is automatically selected. Select a number of Asynch Clients per Virtual User and set the Asynch Login Delay in milliseconds. This Login Delay means that each client will wait for this time after the previous client has logged in before then logging in itself. For detailed output select Asynchronous Verbose. Note that with this feature it is important to allow the clients enough time to both login fully before measuring performance and also at the end it will take additional time for the clients to all complete their current keying and thinking time and to exit before the Virtual User reports all clients as complete.
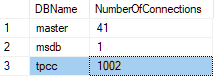
When all Virtual Users have logged in (example from SQL Server) the session count will show as the number of Virtual Users multiplied by the Asynchronous Clients.
SELECT DB_NAME(dbid) as DBName, COUNT(dbid) as NumberOfConnections FROM sys.sysprocesses WHERE dbid > 0 GROUP BY dbid;
As each Asynchronous Client logs in it will be reported in the Virtual User output.
When the workload is running with Asynchronous Verbose enabled HammerDB will report the events as they happen.
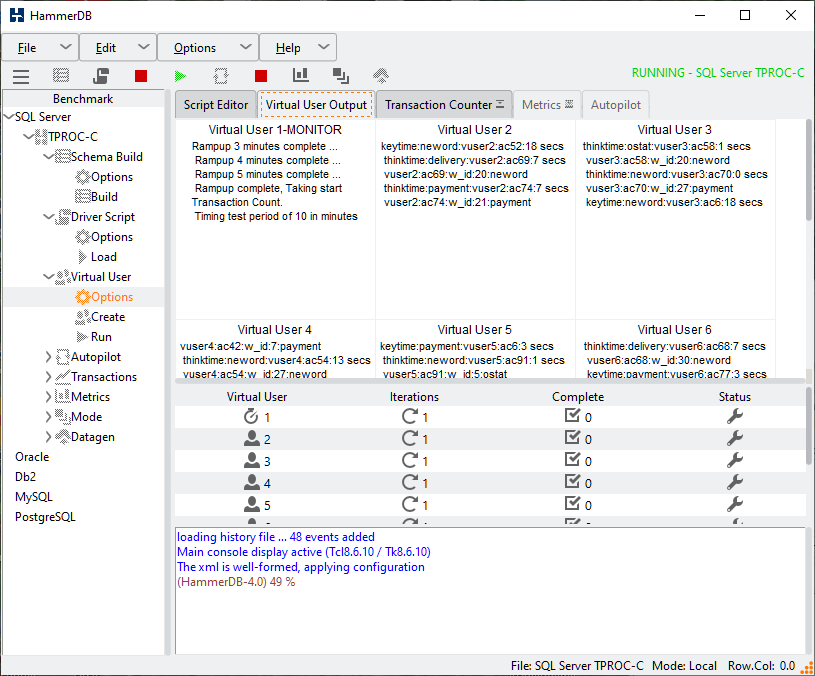
With logging enabled and Asynchronous Verbose HammerDB will report the events as they happen for each Virtual User such as when they enter keying or thinking time and when they process a transaction.
Vuser 6:keytime:payment:vuser6:ac9:3 secs
Vuser 7:keytime:payment:vuser7:ac92:3 secs
Vuser 7:thinktime:delivery:vuser7:ac77:3 secs
Vuser 3:keytime:payment:vuser3:ac30:3 secs
Vuser 9:keytime:delivery:vuser9:ac49:2 secs
Vuser 7:vuser7:ac77:w_id:21:payment
Vuser 9:keytime:neword:vuser9:ac64:18 secs
Vuser 3:thinktime:neword:vuser3:ac72:15 secs
Vuser 3:vuser3:ac72:w_id:4:payment
Vuser 3:keytime:neword:vuser3:ac52:18 secs
Vuser 7:thinktime:neword:vuser7:ac43:8 secs
Vuser 7:vuser7:ac43:w_id:6:payment
Vuser 7:keytime:ostat:vuser7:ac9:2 secs
Vuser 3:keytime:payment:vuser3:ac9:3 secs
Vuser 3:thinktime:payment:vuser3:ac97:7 secs
Vuser 11:keytime:payment:vuser11:ac42:3 secs
Vuser 5:keytime:neword:vuser5:ac42:18 secs
Vuser 9:thinktime:ostat:vuser9:ac71:3 secs
Vuser 3:vuser3:ac97:w_id:24:payment
Vuser 9:vuser9:ac71:w_id:9:delivery
Vuser 9:keytime:delivery:vuser9:ac69:2 secs
Vuser 5:keytime:delivery:vuser5:ac19:2 secs
Vuser 11:thinktime:neword:vuser11:ac53:13 secs
Vuser 11:vuser11:ac53:w_id:8:neword
Vuser 9:keytime:delivery:vuser9:ac2:2 secs
Vuser 7:thinktime:neword:vuser7:ac81:12 secs
Vuser 3:keytime:neword:vuser3:ac47:18 secs
Vuser 7:vuser7:ac81:w_id:5:payment
Vuser 3:keytime:payment:vuser3:ac81:3 secs
Vuser 7:keytime:slev:vuser7:ac46:2 secs
Vuser 11:thinktime:payment:vuser11:ac65:2 secs
Vuser 11:vuser11:ac65:w_id:21:slev
Vuser 9:keytime:neword:vuser9:ac86:18 secs
Vuser 11:thinktime:payment:vuser11:ac20:1 secs
Vuser 7:thinktime:neword:vuser7:ac76:9 secs
Vuser 11:vuser11:ac20:w_id:6:payment
Vuser 7:vuser7:ac76:w_id:1:payment
Vuser 11:keytime:delivery:vuser11:ac79:2 secs
Vuser 9:thinktime:neword:vuser9:ac57:15 secs
Vuser 11:thinktime:payment:vuser11:ac30:14 secs
Vuser 9:vuser9:ac57:w_id:3:ostat
Vuser 11:vuser11:ac30:w_id:5:neword
Vuser 9:keytime:payment:vuser9:ac3:3 secs
Vuser 11:keytime:payment:vuser11:ac62:3 secs
Vuser 3:keytime:payment:vuser3:ac35:3 secs
Vuser 7:keytime:neword:vuser7:ac88:18 secs
Vuser 11:keytime:payment:vuser11:ac96:3 secs
Vuser 11:thinktime:payment:vuser11:ac47:8 secs
Vuser 11:vuser11:ac47:w_id:4:neword
Vuser 3:thinktime:payment:vuser3:ac24:21 secs
Vuser 5:keytime:neword:vuser5:ac37:18 secs
Vuser 7:keytime:payment:vuser7:ac16:3 secs
Vuser 11:keytime:payment:vuser11:ac88:3 secs
Vuser 3:vuser3:ac24:w_id:16:neword
Vuser 11:thinktime:slev:vuser11:ac25:6 secs
Vuser 11:vuser11:ac25:w_id:3:payment
Vuser 5:thinktime:payment:vuser5:ac40:2 secs
Vuser 5:vuser5:ac40:w_id:26:neword
Vuser 5:thinktime:neword:vuser5:ac63:7 secs
Vuser 5:vuser5:ac63:w_id:10:payment
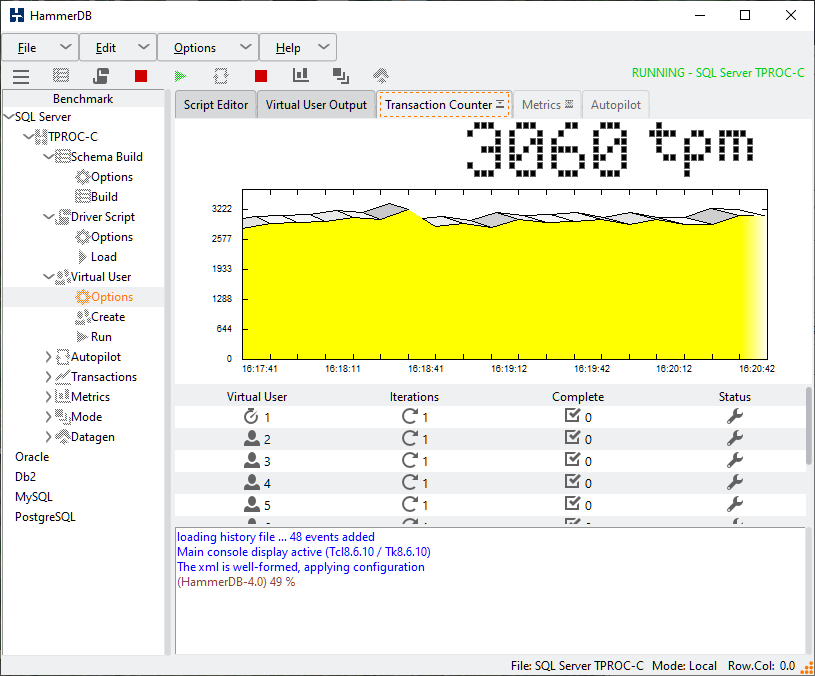
One particular advantage of this type of workload is to be able to run a fixed throughput test defined by the number of Virtual Users.
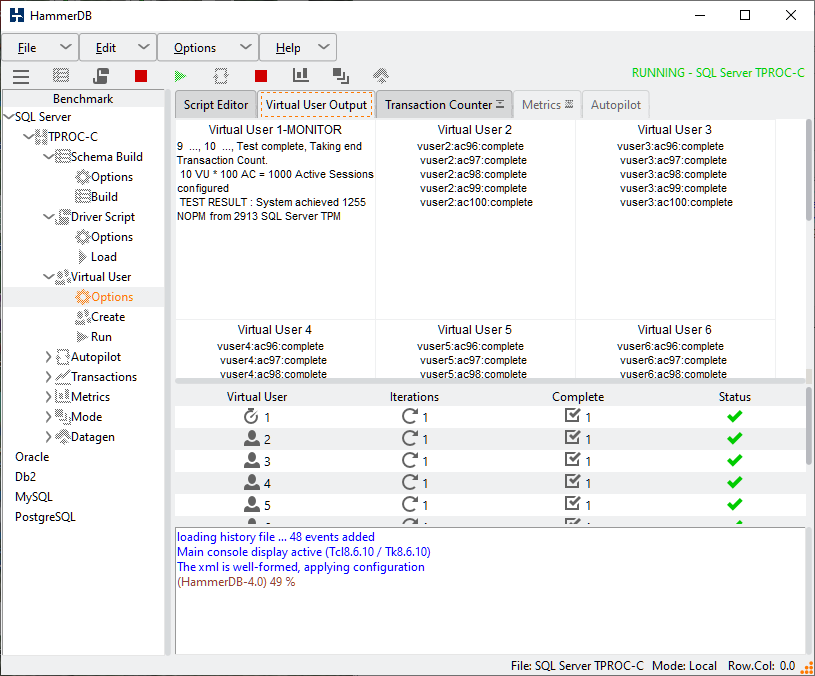
On completion of the workloads the Monitor Virtual User will report the number of Active Sessions and the performance achieved. The active Virtual Users will report when all of the asynchronous clients have completed their workloads and logged off.
The event driven scaling feature is not intended to replace the default CPU intensive mode of testing and it is expected that this will continue to be the most popular methodology. Instead being able to increase up client sessions with keying and thinking time adds additional test scenarios for highly scalable systems and in particular is an effective test methodology for testing middle tier or proxy systems.
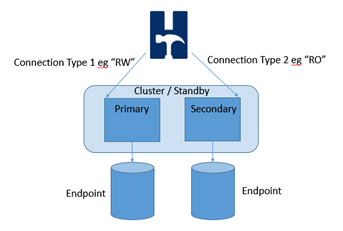
The XML Connect Pool is intended for simultaneously testing related multiple instances of a clustered database. It enables each Virtual User to open a pool of connections (Note that each virtual user (or asynchronous client) will open and hold all of the defined connections) and direct the individual transactions to run on a specific instance according to a pre-defined policy. With this approach it is possible for example to direct the read-write transactions to a primary instance on a cluster whilst directing the read-only transactions to the secondary.
Note that for testing or evaluation of this feature it is also possible to direct one HammerDB client to test multiple separate instances at the same time provided that the instances have exactly the same warehouse count as shown in the example below. However for a valid and comparable test consistency should be ensured between the database instances. Therefore for example directing transactions against any instance in an Oracle RAC configuration would be valid as would running the read only transactions against a secondary read only instance in a cluster. However running against separate unrelated instances is possible for testing but not comparable for performance results. The monitor virtual user will continue to connect to the instance defined in the driver options and report NOPM and TPM from this standalone connection only and therefore the reliance is on the database to accurately report a cluster wide transactions and for the instances to have the same warehouse count. Nevertheless when using the XML connect pooling a client side transaction count will also be reported to provide detailed transaction data from all Virtual Users.
The configuration is defined in the database specific XML file in the config/connpool directory. It is recommended to make a backup of the file before it is modified. The XML configuration file is in 2 sections, connections and sprocs. For connections the XML configuration file should be modified according to the cluster database names with each connection defined by the tags c1, c2, c3 respectively. There is no restriction to the number of connections that you define. Under the sprocs section in the XML configuration file is defined which stored procedures will use which connections and what policy is to be used. The policy can be first_named, last_named, random or round_robin. For example with connections c1, c2 and c3 for neworder and a policy of round_robin the first neworder transaction would execute against connection c1, the second c2, the third c3, the fourth c1 and so on. For all databases and all stored procedures prepared statements are used meaning that a statement is prepared for each connection for each virtual user and a reference kept for that prepared statement for execution.
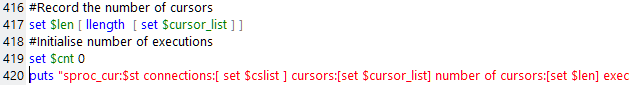
For further information on the connections opened there is a commented information line in the driver script such as #puts "sproc_cur:$st connections:[ set $cslist ] cursors:[set $cursor_list] number of cursors:[set $len] execs:[set $cnt]" prior to the opening of the standalone connection that may be uncommented for more detail when the script is run.
<connpool>
<connections>
    <c1>
        <mssqls_server>(local)\SQLDEVELOP</mssqls_server>
        <mssqls_linux_server>host1</mssqls_linux_server>
        <mssqls_tcp>false</mssqls_tcp>
        <mssqls_port>1433</mssqls_port>
        <mssqls_azure>false</mssqls_azure>
        <mssqls_authentication>windows</mssqls_authentication>
        <mssqls_linux_authent>sql</mssqls_linux_authent>
<mssqls_odbc_driver>ODBC Driver 17 for SQL Server</mssqls_odbc_driver>
<mssqls_linux_odbc>ODBC Driver 17 for SQL Server</mssqls_linux_odbc>
        <mssqls_uid>sa</mssqls_uid>
        <mssqls_pass>admin</mssqls_pass>
<mssqls_dbase>tpcc1</mssqls_dbase>
    </c1>
    <c2>
        <mssqls_server>(local)\SQLDEVELOP</mssqls_server>
        <mssqls_linux_server>host2</mssqls_linux_server>
        <mssqls_tcp>false</mssqls_tcp>
        <mssqls_port>1433</mssqls_port>
        <mssqls_azure>false</mssqls_azure>
        <mssqls_authentication>windows</mssqls_authentication>
        <mssqls_linux_authent>sql</mssqls_linux_authent>
<mssqls_odbc_driver>ODBC Driver 17 for SQL Server</mssqls_odbc_driver>
<mssqls_linux_odbc>ODBC Driver 17 for SQL Server</mssqls_linux_odbc>
        <mssqls_uid>sa</mssqls_uid>
        <mssqls_pass>admin</mssqls_pass>
<mssqls_dbase>tpcc2</mssqls_dbase>
    </c2>
    <c3>
        <mssqls_server>(local)\SQLDEVELOP</mssqls_server>
        <mssqls_linux_server>host3</mssqls_linux_server>
        <mssqls_tcp>false</mssqls_tcp>
        <mssqls_port>1433</mssqls_port>
        <mssqls_azure>false</mssqls_azure>
        <mssqls_authentication>windows</mssqls_authentication>
        <mssqls_linux_authent>sql</mssqls_linux_authent>
<mssqls_odbc_driver>ODBC Driver 17 for SQL Server</mssqls_odbc_driver>
<mssqls_linux_odbc>ODBC Driver 17 for SQL Server</mssqls_linux_odbc>
        <mssqls_uid>sa</mssqls_uid>
        <mssqls_pass>admin</mssqls_pass>
<mssqls_dbase>tpcc3</mssqls_dbase>
    </c3>
</connections>
<sprocs>
  <neworder>
<connections>c1 c2 c3</connections>
    <policy>round_robin</policy>
</neworder>
    <payment>
<connections>c1 c2</connections>
    <policy>first_named</policy>
</payment>
    <delivery>
<connections>c2 c3</connections>
    <policy>last_named</policy>
</delivery>
    <stocklevel>
<connections>c1 c2 c3</connections>
    <policy>random</policy>
</stocklevel>
    <orderstatus>
<connections>c2 c3</connections>
    <policy>round_robin</policy>
</orderstatus>
</sprocs>
</connpool>
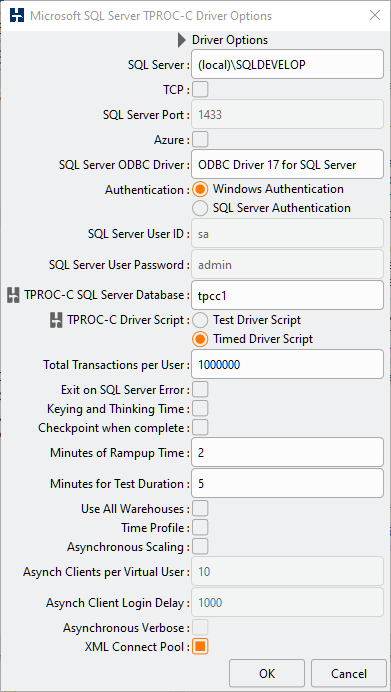
After modifying the XML configuration file select XML Connect Pool in the Driver Options to activate this feature.
For this example the additional information for the comments is also added to illustrate the connections made.
When the Virtual Users are run the logfile shows that connections are made for the active Virtual Users according to the connections and policies defined in the XML configuration file. Also prepared statements are created and held in a pool for execution against the defined policy. Also note that the standalone connection "tpcc1" is also made to monitor the transaction rates and define the warehouse count for the run.
Vuser 2:sproc_cur:neword_st connections:{odbcc1 odbcc2 odbcc3} cursors:::oo::Obj23::Stmt::3 ::oo::Obj28::Stmt::3 ::oo::Obj33::Stmt::3 number of cursors:3 execs:0
Vuser 2:sproc_cur:payment_st connections:{odbcc1 odbcc2} cursors:::oo::Obj23::Stmt::4 ::oo::Obj28::Stmt::4 number of cursors:2 execs:0
Vuser 2:sproc_cur:ostat_st connections:{odbcc2 odbcc3} cursors:::oo::Obj28::Stmt::5 ::oo::Obj33::Stmt::4 number of cursors:2 execs:0
Vuser 2:sproc_cur:delivery_st connections:{odbcc1 odbcc2 odbcc3} cursors:::oo::Obj23::Stmt::5 ::oo::Obj28::Stmt::6 ::oo::Obj33::Stmt::5 number of cursors:3 execs:0
Vuser 2:sproc_cur:slev_st connections:{odbcc2 odbcc3} cursors:::oo::Obj28::Stmt::7 ::oo::Obj33::Stmt::6 number of cursors:2 execs:0
Vuser 3:sproc_cur:neword_st connections:{odbcc1 odbcc2 odbcc3} cursors:::oo::Obj23::Stmt::3 ::oo::Obj28::Stmt::3 ::oo::Obj33::Stmt::3 number of cursors:3 execs:0
Vuser 3:sproc_cur:payment_st connections:{odbcc1 odbcc2} cursors:::oo::Obj23::Stmt::4 ::oo::Obj28::Stmt::4 number of cursors:2 execs:0
Vuser 3:sproc_cur:ostat_st connections:{odbcc2 odbcc3} cursors:::oo::Obj28::Stmt::5 ::oo::Obj33::Stmt::4 number of cursors:2 execs:0
Vuser 3:sproc_cur:delivery_st connections:{odbcc1 odbcc2 odbcc3} cursors:::oo::Obj23::Stmt::5 ::oo::Obj28::Stmt::6 ::oo::Obj33::Stmt::5 number of cursors:3 execs:0
Vuser 3:sproc_cur:slev_st connections:{odbcc2 odbcc3} cursors:::oo::Obj28::Stmt::7 ::oo::Obj33::Stmt::6 number of cursors:2 execs:0
On completion of the run the NOPM and TPM is recorded. This is the area where it is of particular importance to be aware of the database and cluster configuration for the results to be consistent. It is therefore valid to reiterate that if the cluster and standalone connection does not record all of the transactions in the cluster then the NOPM results will only be returned for the standalone connection. By way of example in the test configuration shown there are 3 separate databases and the standalone connection is made to tpcc1. Therefore the test results shows the NOPM value at approximately 1/3rd of the ratio expected against the TPM value that records all of the transactions against the SQL Server. For this reason the CLIENT SIDE TPM is also shown. In this example the neworder value per minute is 78319 a close equivalent to 3 x 26207 and therefore gives an indication of the NOPM value for multiple instances in a non-cluster configuration. In this case 3 connections were made to tpcc1, tpcc2 and tpcc3 and the connections chosen to round robin between them, therefore the actual number of NOPM is 3X that recorded from just the standalone connection. In a correctly configured cluster environment it would be the same and the results wouyld be both consistent and valid. Be aware that these client side values are recorded during both rampup and timed test periods and therefore may not accurately reflect the results from a valid timed test.
Vuser 1:2 Active Virtual Users configured
Vuser 1:TEST RESULT : System achieved 26207 NOPM from 180515 SQL Server TPM
Vuser 1:CLIENT SIDE TPM : neworder 78319 payment 78185 delivery 7855 stocklevel 7826 orderstatus 7809
In addition to the CLIENT SIDE TPM each Virtual User will also report the total number of transactions that it processed from the time that it started running to the end of the test.
Vuser 2:VU2 processed neworder 275335 payment 273822 delivery 27495 stocklevel 27588 orderstatus 27568 transactions
Vuser 3:VU3 processed neworder 272901 payment 273475 delivery 27493 stocklevel 27194 orderstatus 27097 transactions
The XML Connect Pool feature provides advanced features for the expert user to test clusters and multiple instances simultaneously, it also gives the user a high degree of control on how this is used, therefore it is at the users discretion to use these settings appropriately to ensure consistent results.
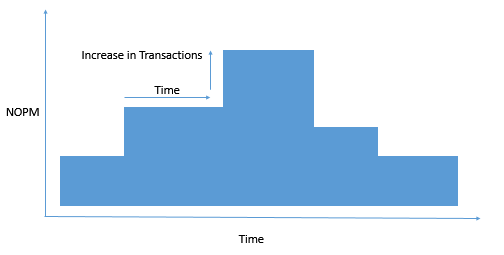
Step testing is methodology of varying the load on the database over a period time. In HammerDB this variable load us achieved by automating the Remote Primary and Replica modes functionality. As the primary will automatically create and connect a number of replicas this functionality is available only when using the CLI and is started using the steprun command. Designing the steps is best approached by considering each horizontal block a primary or replica level with the primary at the base and the replicas at subsequent steps. Note that with a variable load the number of NOPM or TPM recorded over time is less relevant than for a non-variable timed test as the number of transactions will vary throughout the test. Instead this approach is best for capturing changes in response times and transaction rates throughout the test for further analysis such as rapidly finding peak performance in one test by increasing the load and observing the transaction rates.
The base of the steps is the primary configuration and this continues to be configured as normal with time defined by rampup and duration and the number of virtual users with the vuset vu command. The replicas are configured in the steps.xml file in the config directory. For each replica (there is no limit on the number of replicas defined) the configuration takes the time after the previous replica started, the duration to run (with no rampup as the primary has already done the rampup) and the number of virtual users, all other configuration is inherited from the primary.
<steps>
<replica1>
  <start_after_prev>1</start_after_prev>
  <duration>4</duration>
  <virtual_users>2</virtual_users>
 </replica1>
 <replica2>
  <start_after_prev>1</start_after_prev>
  <duration>3</duration>
  <virtual_users>2</virtual_users>
 </replica2>
 <replica3>
  <start_after_prev>1</start_after_prev>
  <duration>2</duration>
  <virtual_users>2</virtual_users>
 </replica3>
 <replica4>
  <start_after_prev>1</start_after_prev>
  <duration>1</duration>
  <virtual_users>2</virtual_users>
 </replica4>
</steps>
When the workload is started it will provide a summary of the configuration.
primary starts immediately, runs rampup for 2 minutes then runs test for 5 minutes with 2 Active VU
replica1 starts 1 minutes after rampup completes and runs test for 4 minutes with 2 Active VU
replica2 starts 1 minutes after previous replica starts and runs test for 3 minutes with 2 Active VU
replica3 starts 1 minutes after previous replica starts and runs test for 2 minutes with 2 Active VU
replica4 starts 1 minutes after previous replica starts and runs test for 1 minutes with 2 Active VU
The configuration must resemble a pyramid configuration with the primary providing the base and running for the longest period of time. If the replicas overrun this base then the step workload will error and exit without running. The default configuration is an example where there is a 2 minute rampup, 5 minute test on the primary, with 3 replicas starting 1 minute after the rampup or previous replicas and then running for 4,3,2 and 1 minute respectively meaning primary and replicas complete at the same time. To start a step workload configure a driver script as normal and instead of vurun call the steprun command.
dbset db mssqls
dbset bm TPC-C
diset connection mssqls_server {(local)\SQLDEVELOP}
diset tpcc mssqls_dbase tpcc
diset tpcc mssqls_total_iterations 10000000
diset tpcc mssqls_driver timed
diset tpcc mssqls_rampup 2
diset tpcc mssqls_duration 5
#diset tpcc mssqls_timeprofile true
vuset logtotemp 1
vuset vu 2
steprun
No further intervention is needed and the primary will automatically create, configure and run replica instances of HammerDB at the specified time intervals, with an example from the default shown.
HammerDB CLI v4.1
Copyright (C) 2003-2021 Steve Shaw
Type "help" for a list of commands
The xml is well-formed, applying configuration
hammerdb>source runstepmssqls.tcl
Database set to MSSQLServer
Benchmark set to TPC-C for MSSQLServer
Changed connection:mssqls_server from (local) to (local)\SQLDEVELOP for MSSQLServer
Value tpcc for tpcc:mssqls_dbase is the same as existing value tpcc, no change made
Changed tpcc:mssqls_total_iterations from 1000000 to 10000000 for MSSQLServer
Clearing Script, reload script to activate new setting
Script cleared
Changed tpcc:mssqls_driver from test to timed for MSSQLServer
Value 2 for tpcc:mssqls_rampup is the same as existing value 2, no change made
Value 5 for tpcc:mssqls_duration is the same as existing value 5, no change made
primary starts immediately, runs rampup for 2 minutes then runs test for 5 minutes with 2 Active VU
replica1 starts 1 minutes after rampup completes and runs test for 4 minutes with 2 Active VU
replica2 starts 1 minutes after previous replica starts and runs test for 3 minutes with 2 Active VU
replica3 starts 1 minutes after previous replica starts and runs test for 2 minutes with 2 Active VU
replica4 starts 1 minutes after previous replica starts and runs test for 1 minutes with 2 Active VU
Switch from Local
to Primary mode?
Enter yes or no: replied yes
Setting Primary Mode at id : 17848, hostname : osprey
Primary Mode active at id : 17848, hostname : osprey
Starting 1 replica HammerDB instance
Starting 2 replica HammerDB instance
HammerDB CLI v4.1
Copyright (C) 2003-2021 Steve Shaw
Type "help" for a list of commands
Starting 3 replica HammerDB instance
HammerDB CLI v4.1
Copyright (C) 2003-2021 Steve Shaw
Type "help" for a list of commands
Starting 4 replica HammerDB instance
HammerDB CLI v4.1
Copyright (C) 2003-2021 Steve Shaw
Type "help" for a list of commands
Doing wait to connnect ....
HammerDB CLI v4.1
Copyright (C) 2003-2021 Steve Shaw
Primary waiting for all replicas to connect .... 0 out of 4 are connected
Type "help" for a list of commands
The xml is well-formed, applying configuration
The xml is well-formed, applying configuration
Switch from Local
to Replica mode?
Switch from Local
to Replica mode?
The xml is well-formed, applying configuration
Enter yes or no: replied yes
Enter yes or no: replied yes
The xml is well-formed, applying configuration
Switch from Local
to Replica mode?
Enter yes or no: replied yes
Setting Replica Mode at id : 40148, hostname : osprey
Setting Replica Mode at id : 21020, hostname : osprey
Switch from Local
to Replica mode?
Replica connecting to localhost 17848 : Connection succeeded
Replica connecting to localhost 17848 : Connection succeeded
Received a new replica connection from host ::1
Enter yes or no: replied yes
Received a new replica connection from host ::1
Setting Replica Mode at id : 30792, hostname : osprey
Replica connecting to localhost 17848 : Connection succeeded
Received a new replica connection from host ::1
Setting Replica Mode at id : 40980, hostname : osprey
Replica connecting to localhost 17848 : Connection succeeded
Received a new replica connection from host ::1
New replica joined : {21020 osprey}
New replica joined : {21020 osprey} {40148 osprey}
Primary call back successful
Switched to Replica mode via callback
New replica joined : {21020 osprey} {40148 osprey} {30792 osprey}
Primary call back successful
Switched to Replica mode via callback
New replica joined : {21020 osprey} {40148 osprey} {30792 osprey} {40980 osprey}
Primary call back successful
Switched to Replica mode via callback
Primary call back successful
Switched to Replica mode via callback
Primary waiting for all replicas to connect .... {21020 osprey} {40148 osprey} {30792 osprey} {40980 osprey} out of 4 are connected
Primary Received all replica connections {21020 osprey} {40148 osprey} {30792 osprey} {40980 osprey}
Database set to MSSQLServer
Database set to MSSQLServer
Database set to MSSQLServer
Database set to MSSQLServer
Database set to MSSQLServer
Setting primary to run 2 virtual users for 5 duration
Value 5 for tpcc:mssqls_duration is the same as existing value 5, no change made
Sending dbset all to 21020 osprey
Setting replica1 to start after 1 duration 4 VU count 2, Replica instance is 21020 osprey
Sending "diset tpcc mssqls_timeprofile false" to 21020 osprey
Value false for tpcc:mssqls_timeprofile is the same as existing value false, no change made
Sending "diset tpcc mssqls_rampup 0" to 21020 osprey
Changed tpcc:mssqls_rampup from 2 to 0 for MSSQLServer
Sending "diset tpcc mssqls_duration 4" to 21020 osprey
Changed tpcc:mssqls_duration from 5 to 4 for MSSQLServer
Sending "vuset vu 2" to 21020 osprey
Sending dbset all to 40148 osprey
Setting replica2 to start after 1 duration 3 VU count 2, Replica instance is 40148 osprey
Sending "diset tpcc mssqls_timeprofile false" to 40148 osprey
Value false for tpcc:mssqls_timeprofile is the same as existing value false, no change made
Sending "diset tpcc mssqls_rampup 0" to 40148 osprey
Changed tpcc:mssqls_rampup from 2 to 0 for MSSQLServer
Sending "diset tpcc mssqls_duration 3" to 40148 osprey
Changed tpcc:mssqls_duration from 5 to 3 for MSSQLServer
Sending "vuset vu 2" to 40148 osprey
Sending dbset all to 30792 osprey
Setting replica3 to start after 1 duration 2 VU count 2, Replica instance is 30792 osprey
Sending "diset tpcc mssqls_timeprofile false" to 30792 osprey
Value false for tpcc:mssqls_timeprofile is the same as existing value false, no change made
Sending "diset tpcc mssqls_rampup 0" to 30792 osprey
Changed tpcc:mssqls_rampup from 2 to 0 for MSSQLServer
Sending "diset tpcc mssqls_duration 2" to 30792 osprey
Changed tpcc:mssqls_duration from 5 to 2 for MSSQLServer
Sending "vuset vu 2" to 30792 osprey
Sending dbset all to 40980 osprey
Setting replica4 to start after 1 duration 1 VU count 2, Replica instance is 40980 osprey
Sending "diset tpcc mssqls_timeprofile false" to 40980 osprey
Value false for tpcc:mssqls_timeprofile is the same as existing value false, no change made
Sending "diset tpcc mssqls_rampup 0" to 40980 osprey
Changed tpcc:mssqls_rampup from 2 to 0 for MSSQLServer
Sending "diset tpcc mssqls_duration 1" to 40980 osprey
Changed tpcc:mssqls_duration from 5 to 1 for MSSQLServer
Sending "vuset vu 2" to 40980 osprey
Script loaded, Type "print script" to view
Script loaded, Type "print script" to view
Script loaded, Type "print script" to view
Script loaded, Type "print script" to view
Script loaded, Type "print script" to view
Vuser 1 created MONITOR - WAIT IDLE
Vuser 2 created - WAIT IDLE
Vuser 1 created MONITOR - WAIT IDLE
Vuser 1 created MONITOR - WAIT IDLE
Vuser 1 created MONITOR - WAIT IDLE
Vuser 1 created MONITOR - WAIT IDLE
Vuser 2 created - WAIT IDLE
Vuser 2 created - WAIT IDLE
Vuser 2 created - WAIT IDLE
Vuser 2 created - WAIT IDLE
Vuser 3 created - WAIT IDLE
Vuser 3 created - WAIT IDLE
Vuser 3 created - WAIT IDLE
Vuser 3 created - WAIT IDLE
Vuser 3 created - WAIT IDLE
Logging activated
to C:/Users/Steve/AppData/Local/Temp/hammerdb_604382F71F8D03E263731303.log
3 Virtual Users Created with Monitor VU
3 Virtual Users Created with Monitor VU
3 Virtual Users Created with Monitor VU
3 Virtual Users Created with Monitor VU
3 Virtual Users Created with Monitor VU
Starting Primary VUs
Vuser 1:RUNNING
Vuser 1:Beginning rampup time of 2 minutes
Vuser 2:RUNNING
Vuser 2:Processing 10000000 transactions with output suppressed...
Vuser 3:RUNNING
Vuser 3:Processing 10000000 transactions with output suppressed...
Delaying Start of Replicas to rampup 2 replica1 1 replica2 1 replica3 1 replica4 1
Delaying replica1 for 3 minutes.
Delaying replica2 for 4 minutes.
Delaying replica3 for 5 minutes.
Delaying replica4 for 6 minutes.
Primary entering loop waiting for vucomplete
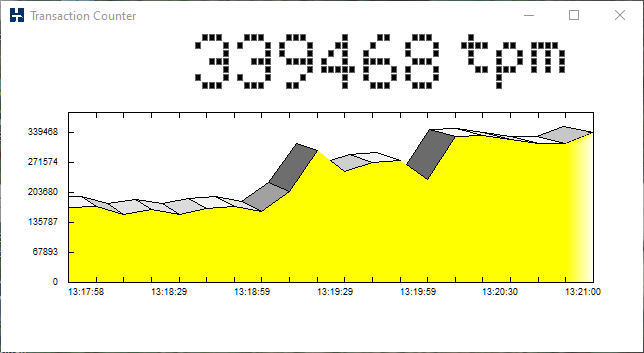
Vuser 1:Rampup 1 minutes complete ...Viewing the GUI or CLI transaction counter the effect can be seen that the load is varied as the replicas are automatically started.