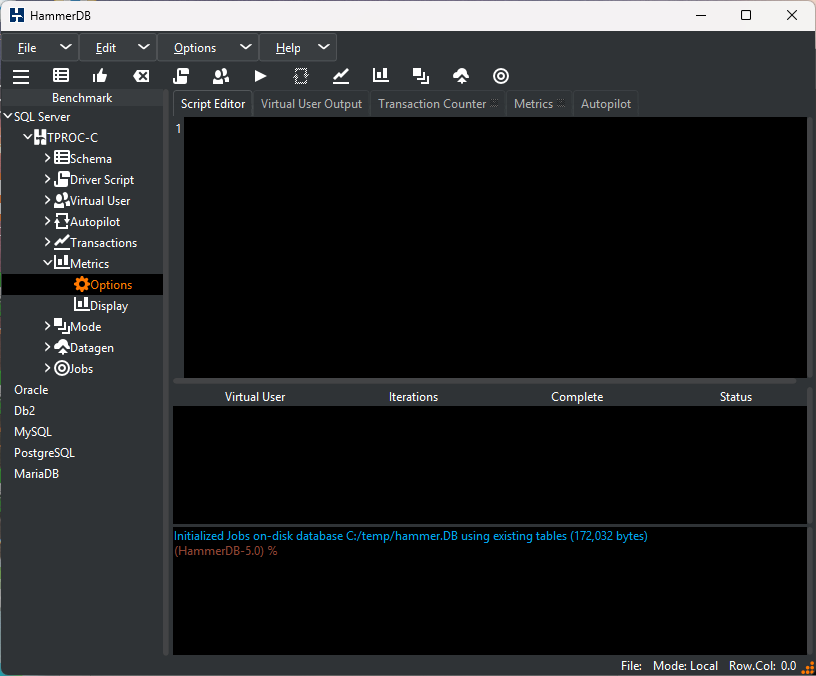
In HammerDB select Metrics Options
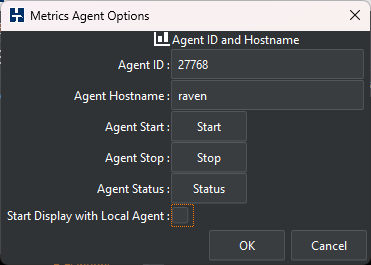
Enter the id and canonical hostname of the agent, Unclick Start Display with Local Agent and press OK.
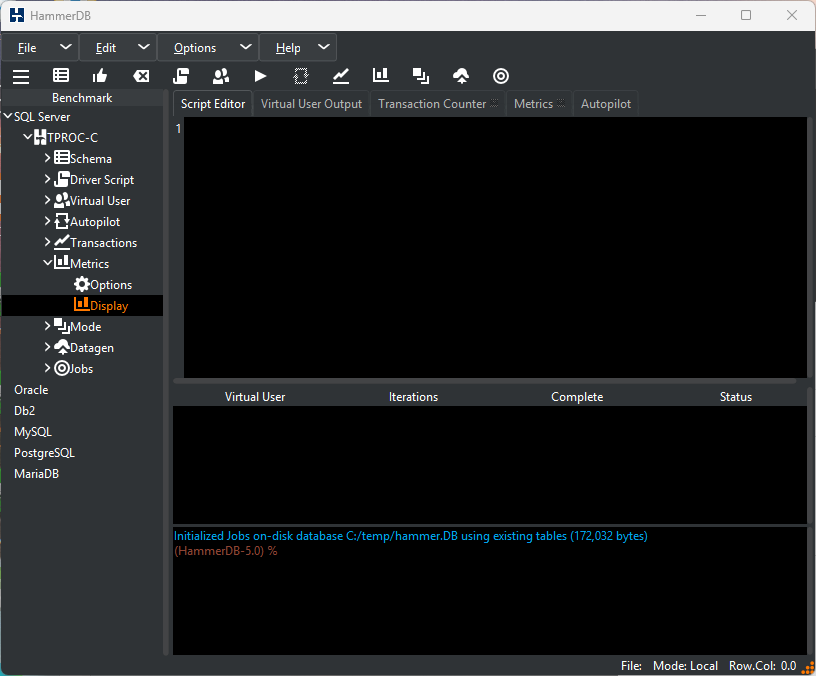
Double-click on Display
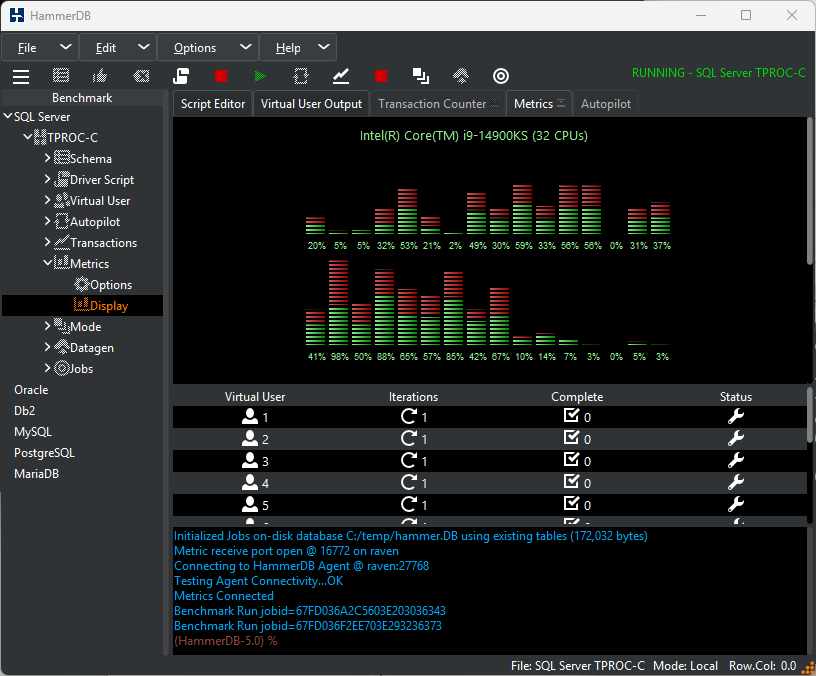
the agent will report the connection of the display and the process of system discovery.
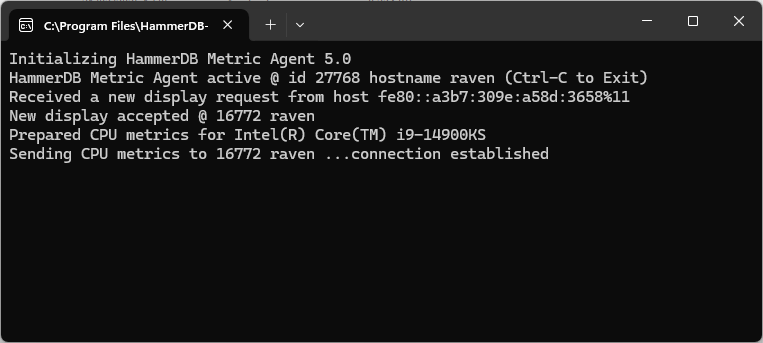
and the display will report the connection information of the agent and show the CPU and I/O metrics.