HammerDB v6.0 adds database metrics options for MySQL and MariaDB. These metrics are designed to help correlate HammerDB workload activity with database activity while a benchmark is running. The MySQL and MariaDB metrics viewer can be used to observe active sessions, wait activity and SQL activity during a workload run.
For MySQL and MariaDB Active Session History diagnostics, configure the database with the following options before starting the database server:
# ASH diagnostics
performance_schema=OFF
event_scheduler=OFF
These options should be added to the MySQL or MariaDB server configuration file, for example my.cnf or my.ini depending on the operating system and installation method. Restart the database server after changing these settings.
After the database has been started with the required settings, select the MySQL or MariaDB workload in HammerDB and open the Metrics Options window. Enter the database connection details and start metrics collection before running the workload.
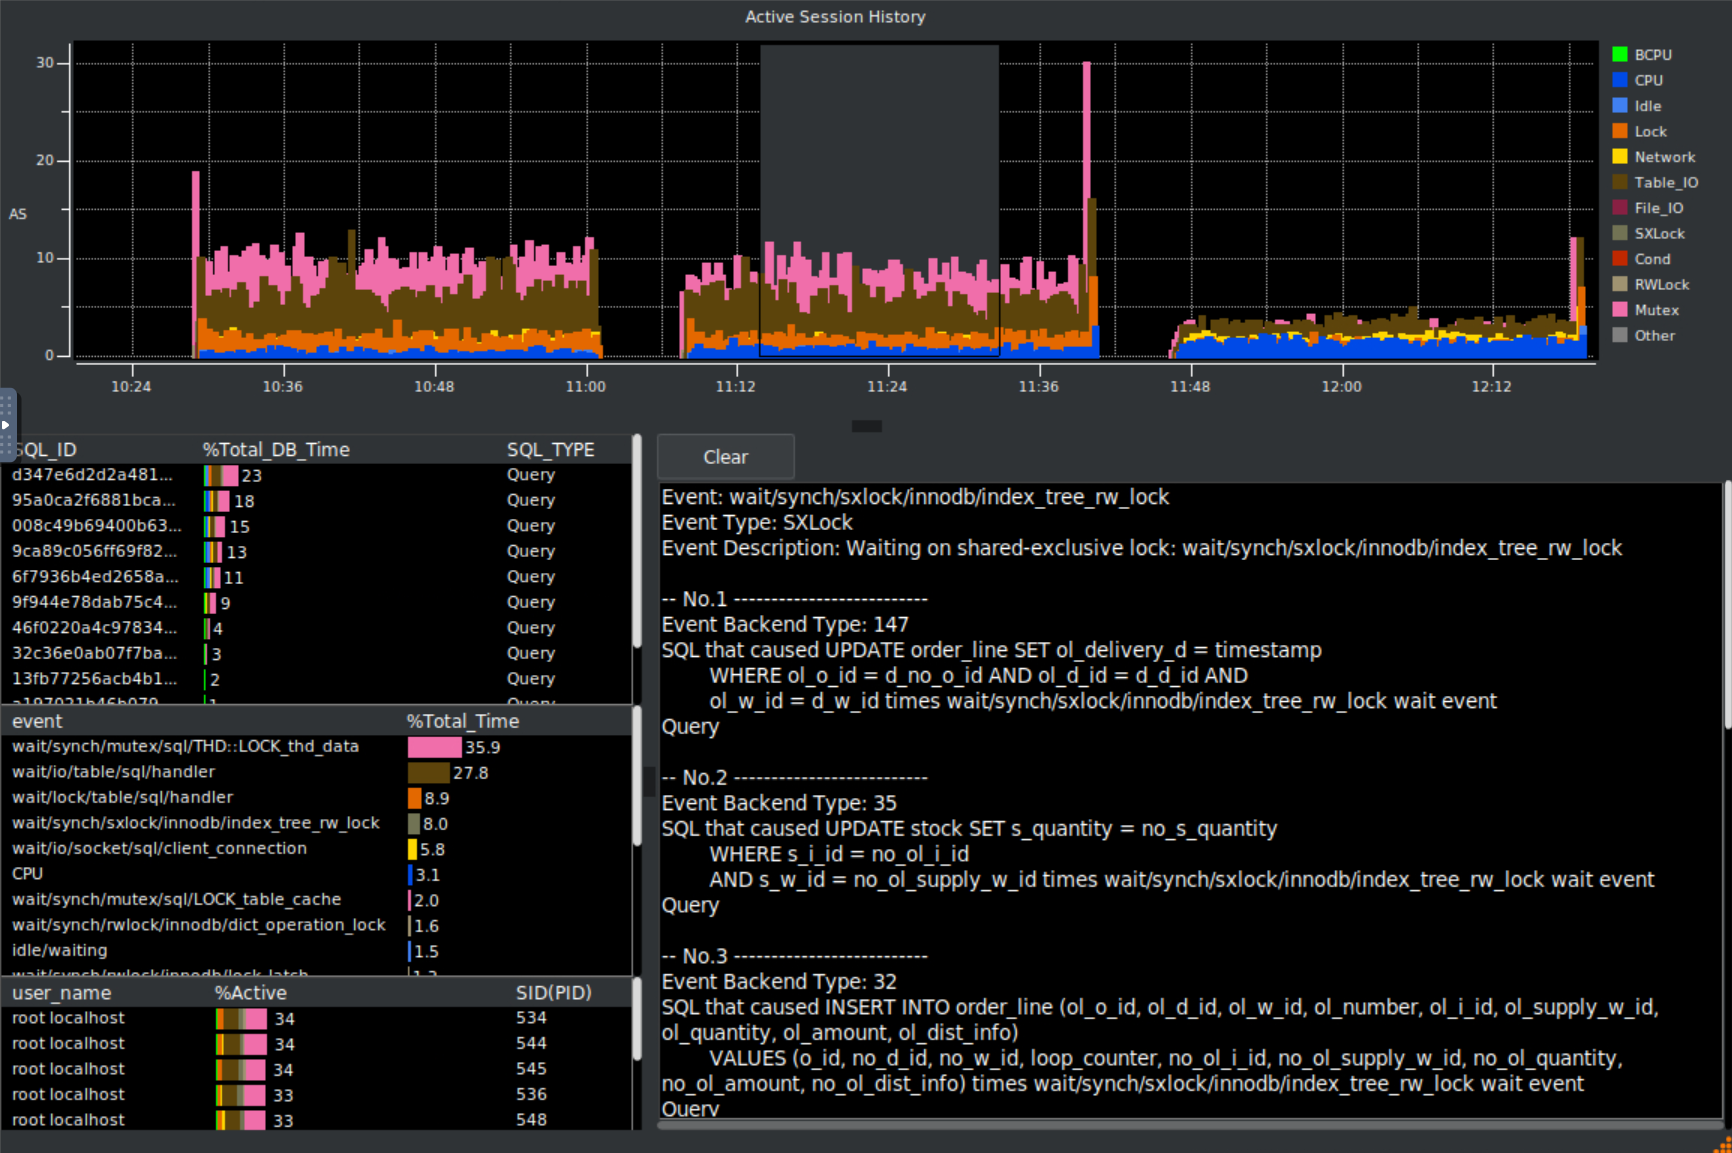
When the workload is running, the metrics display can be used to view database activity alongside HammerDB throughput and timing information. This makes it easier to identify whether a change in benchmark performance is associated with database wait activity, active sessions or SQL execution behaviour.