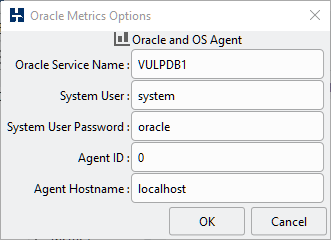
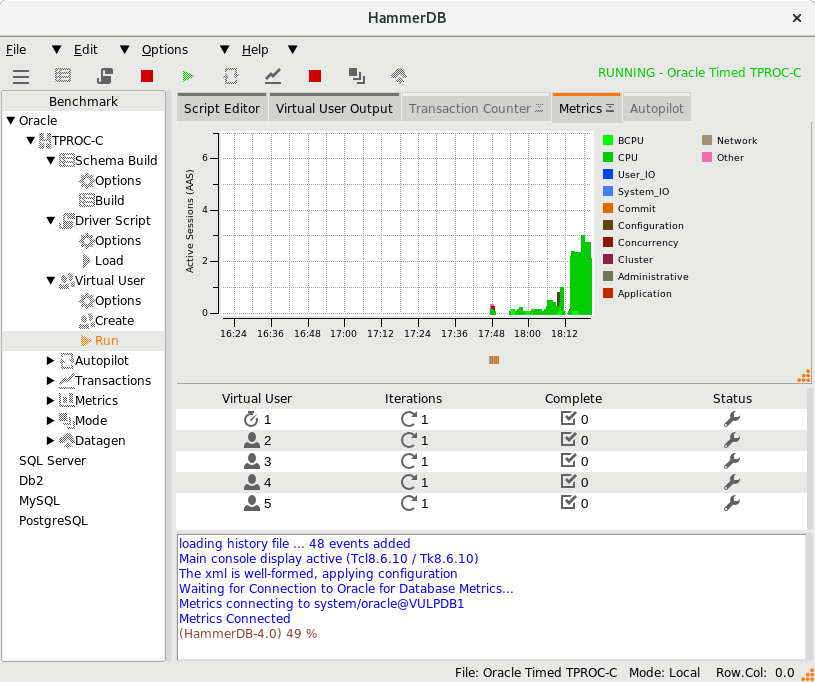
When the Oracle Database is selected on both Windows and Linux an additional option is available to connect to the Oracle Database and display detailed performance metrics.
When the metrics button is pressed HammerDB connects to the database and displays graphical information from the Active Session History detailing wait events. By default in embedded mode the Oracle Database Metrics will display the Active Session History Graph. For detailed Oracle Database Metrics the Notebook tab should be dragged out and expanded to display in a separate window.
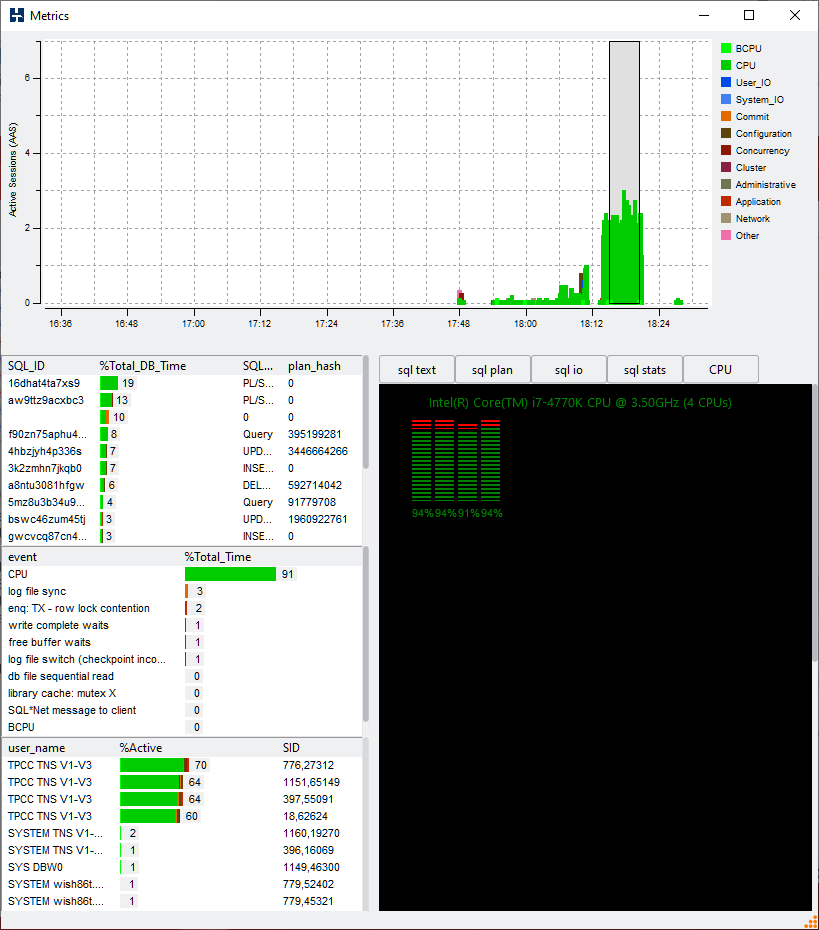
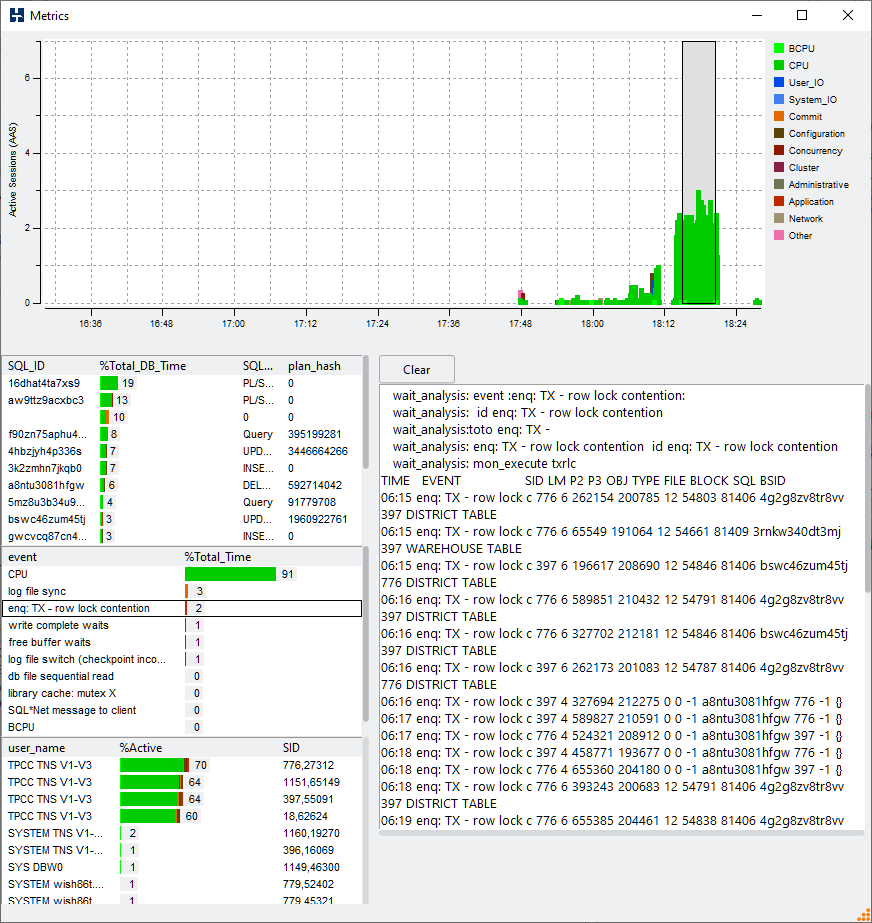
When display in a separate window, it is possible to make a selection from the window and display the wait events related to that period of time. When the SQL_ID is selected the buttons then enable the detailed viewing of SQL text, the explain plan, IO statistics and SQL statistics related to that SQL.
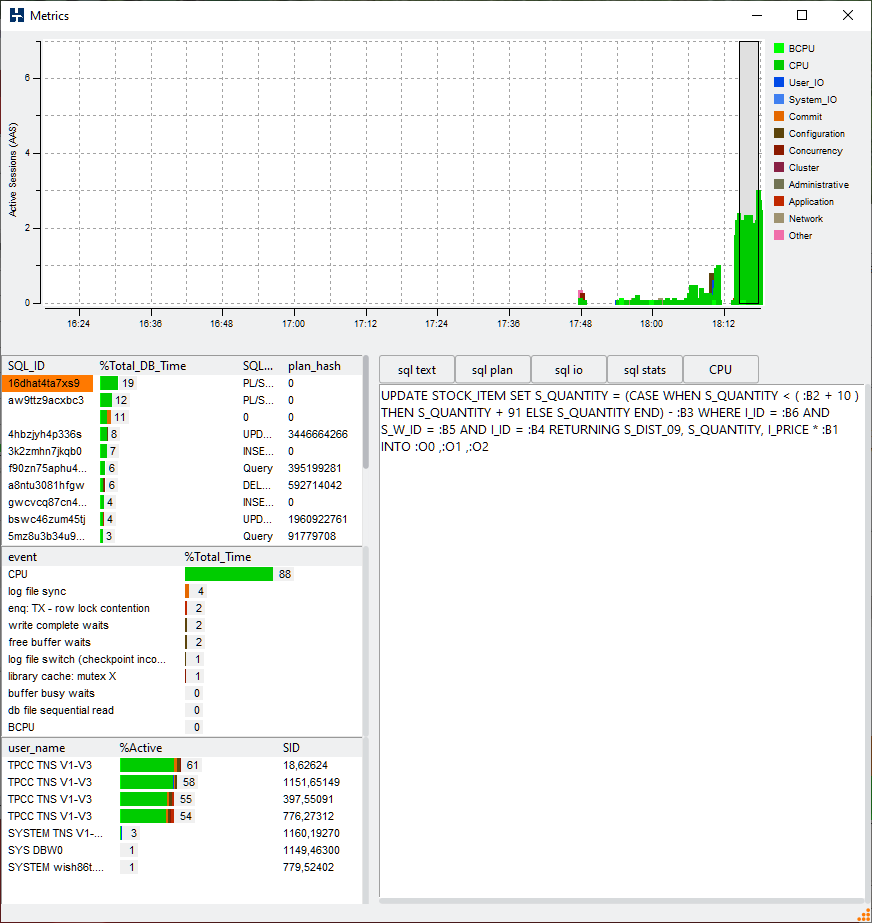
When an event is selected the analysis shows details related to that particular event.
The CPU Metrics button displays the current standard HammerDB CPU Metrics display in an embedded Window and requires the agent running on the database server. The CPU metrics are not recorded as historical data relating to the Active Session History.