When the PostgreSQL Database is selected on both Windows and Linux an additional option is available to connect to the PostgreSQL Database and display detailed performance metrics. PostgreSQL metrics use the Active Session History feature and therefore the pg_stat_statements and pg_sentinel extensions must be installed and operational with parameters set in postgresql.conf such as follows.
shared_preload_libraries = 'pg_stat_statements,pgsentinel'
track_activity_query_size=2048
pg_stat_statements.save=on
pg_stat_statements.track=all
pgsentinel_pgssh.enable = true
pgsentinel_ash.pull_frequency = 1
pgsentinel_ash.max_entries = 1000000
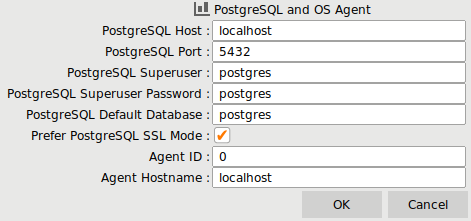
The PostgreSQL Metrics Options screen requires details of superuser access to connect to the database.
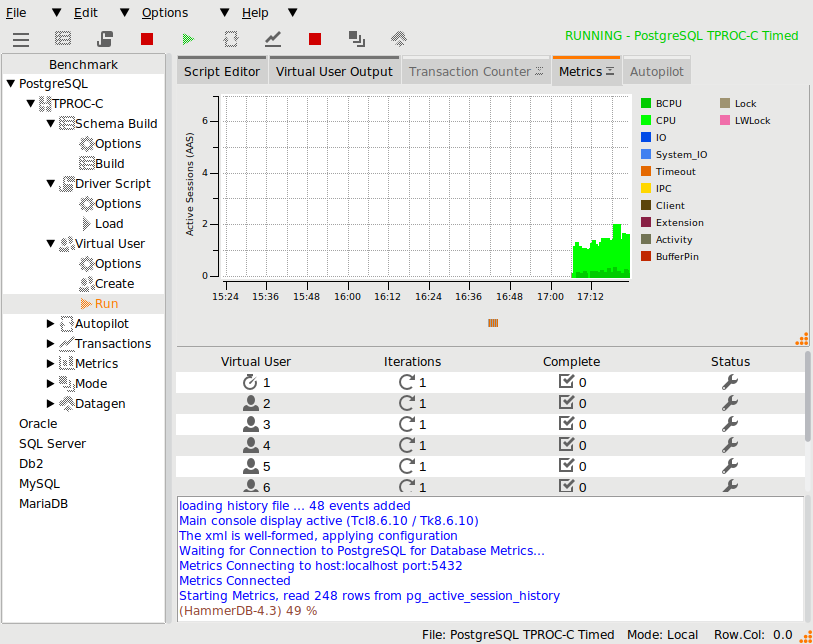
When the metrics button is pressed HammerDB connects to the database and verifies if the pg_active_session_history table is installed and populated with data, if this is verified it displays graphical information from the PostgreSQL Active Session History detailing wait events. By default in embedded mode the PostgreSQL Metrics will display the Active Session History Graph. For detailed PostgreSQL Database Metrics the Notebook tab should be dragged out and expanded to display in a separate window.
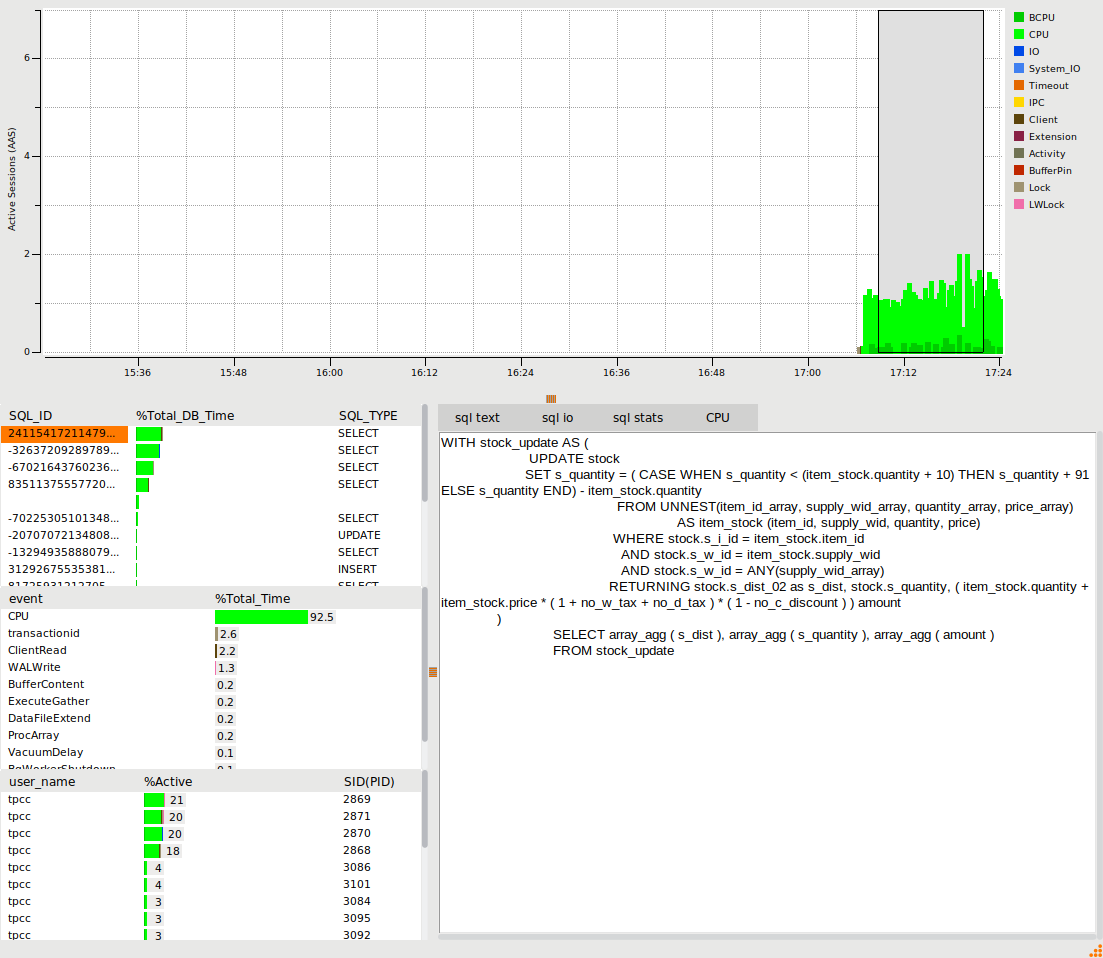
When display in a separate window, it is possible to make a selection from the window and display the wait events related to that period of time when the test was running. When the SQL_ID is selected the buttons then enable the detailed viewing of SQL text, IO statistics and SQL statistics related to that SQL.
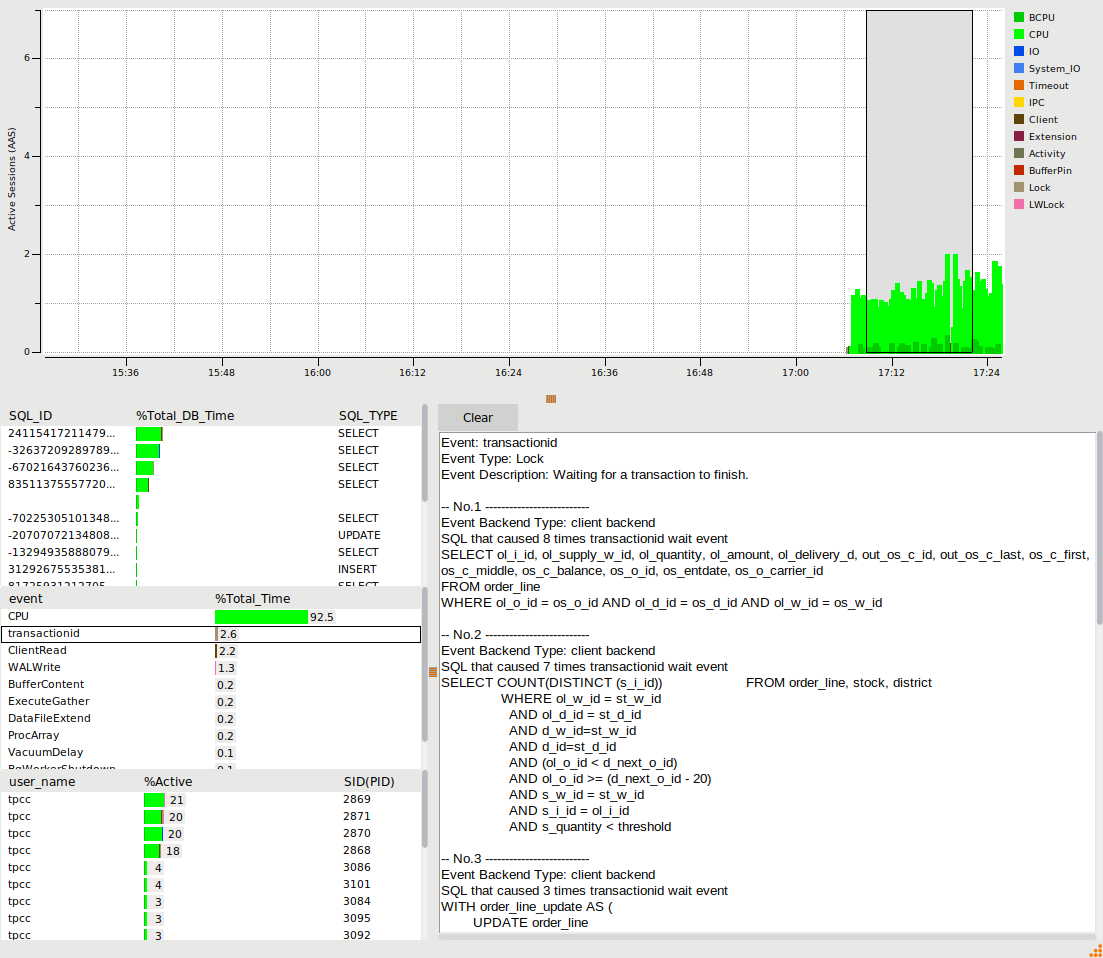
When an event is selected the analysis shows details related to that particular event for the time period selected. Selecting the username shows the statistics related to that particular session.
As described in the Oracle metrics section the CPU Metrics button displays the current standard HammerDB CPU Metrics display in an embedded Window. To enable this functionality follow the guide for CPU metrics earlier in this section.