
We’ve recently given presentations at MariaDB MeetUp days on the methodology for comparing open source and proprietary databases. As we’ve been asked numerous times for the slides in this post we provide the content and summary of the presentation.
Benchmarking Performance Without Restrictions
Sharing performance metrics for proprietary databases such as Oracle and SQL Server is restricted by license agreement specifically DeWitt clauses. These clauses prohibit the publication of benchmark results without explicit vendor approval and you should be fully aware of what you can and can’t share without permission. Open source databases such as MariaDB, MySQL and PostgreSQL have no such restrictions, enabling freely sharing of performance evaluations using HammerDB.
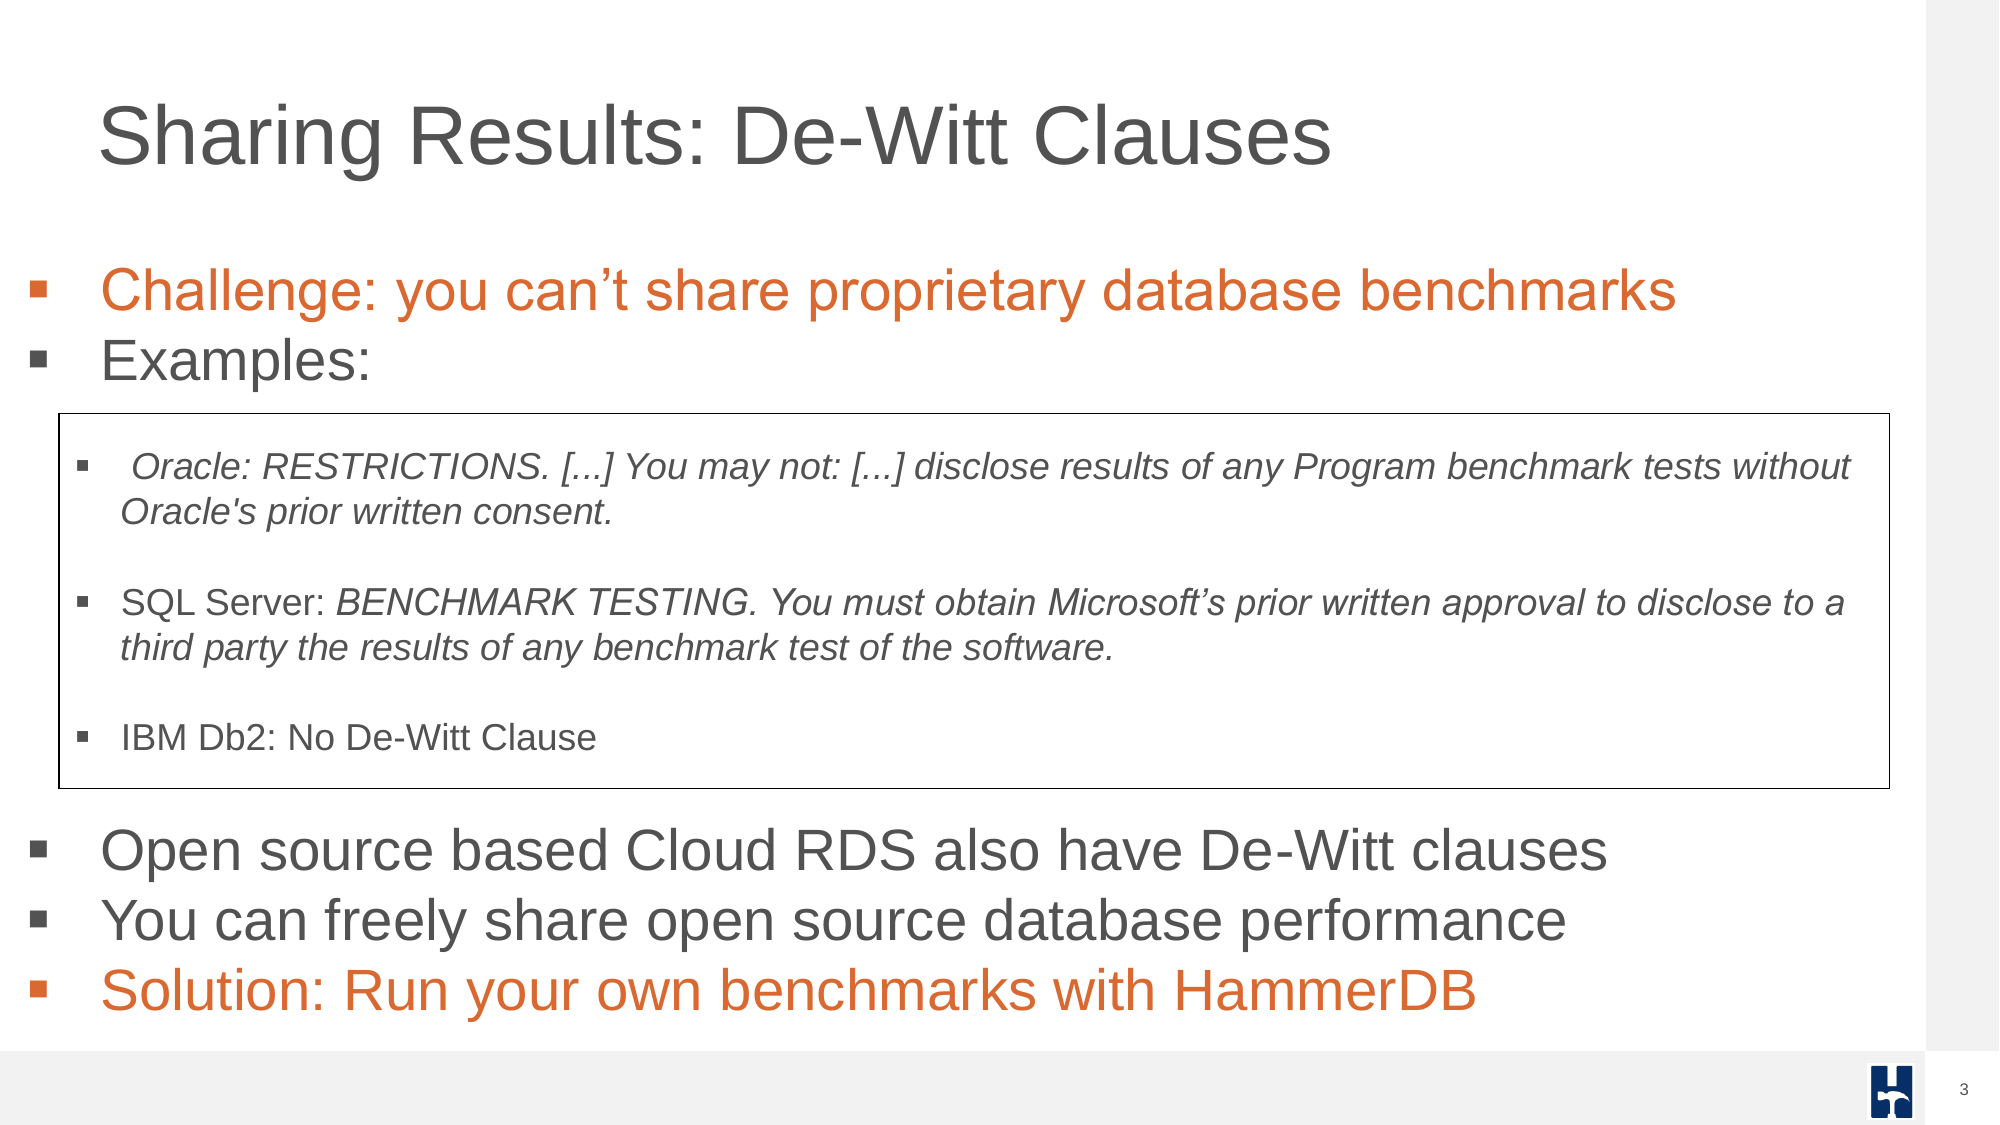
HammerDB does not give legal advice, however if you run your own benchmarks on commercial databases with HammerDB and keep the results private then you are on safe ground from infringing any license conditions. There are no restrictions on any database on running benchmarks, only restrictions on sharing the results.
HammerDB: The Open Source Benchmarking Tool
HammerDB is a widely adopted benchmarking tool designed for relational databases. It is hosted by the TPC Council and available under the GPLv3 license on GitHub. Its cross-platform design supports both Windows and Linux clients, and Docker containers are available for simplified deployment. ARM support is also in development.
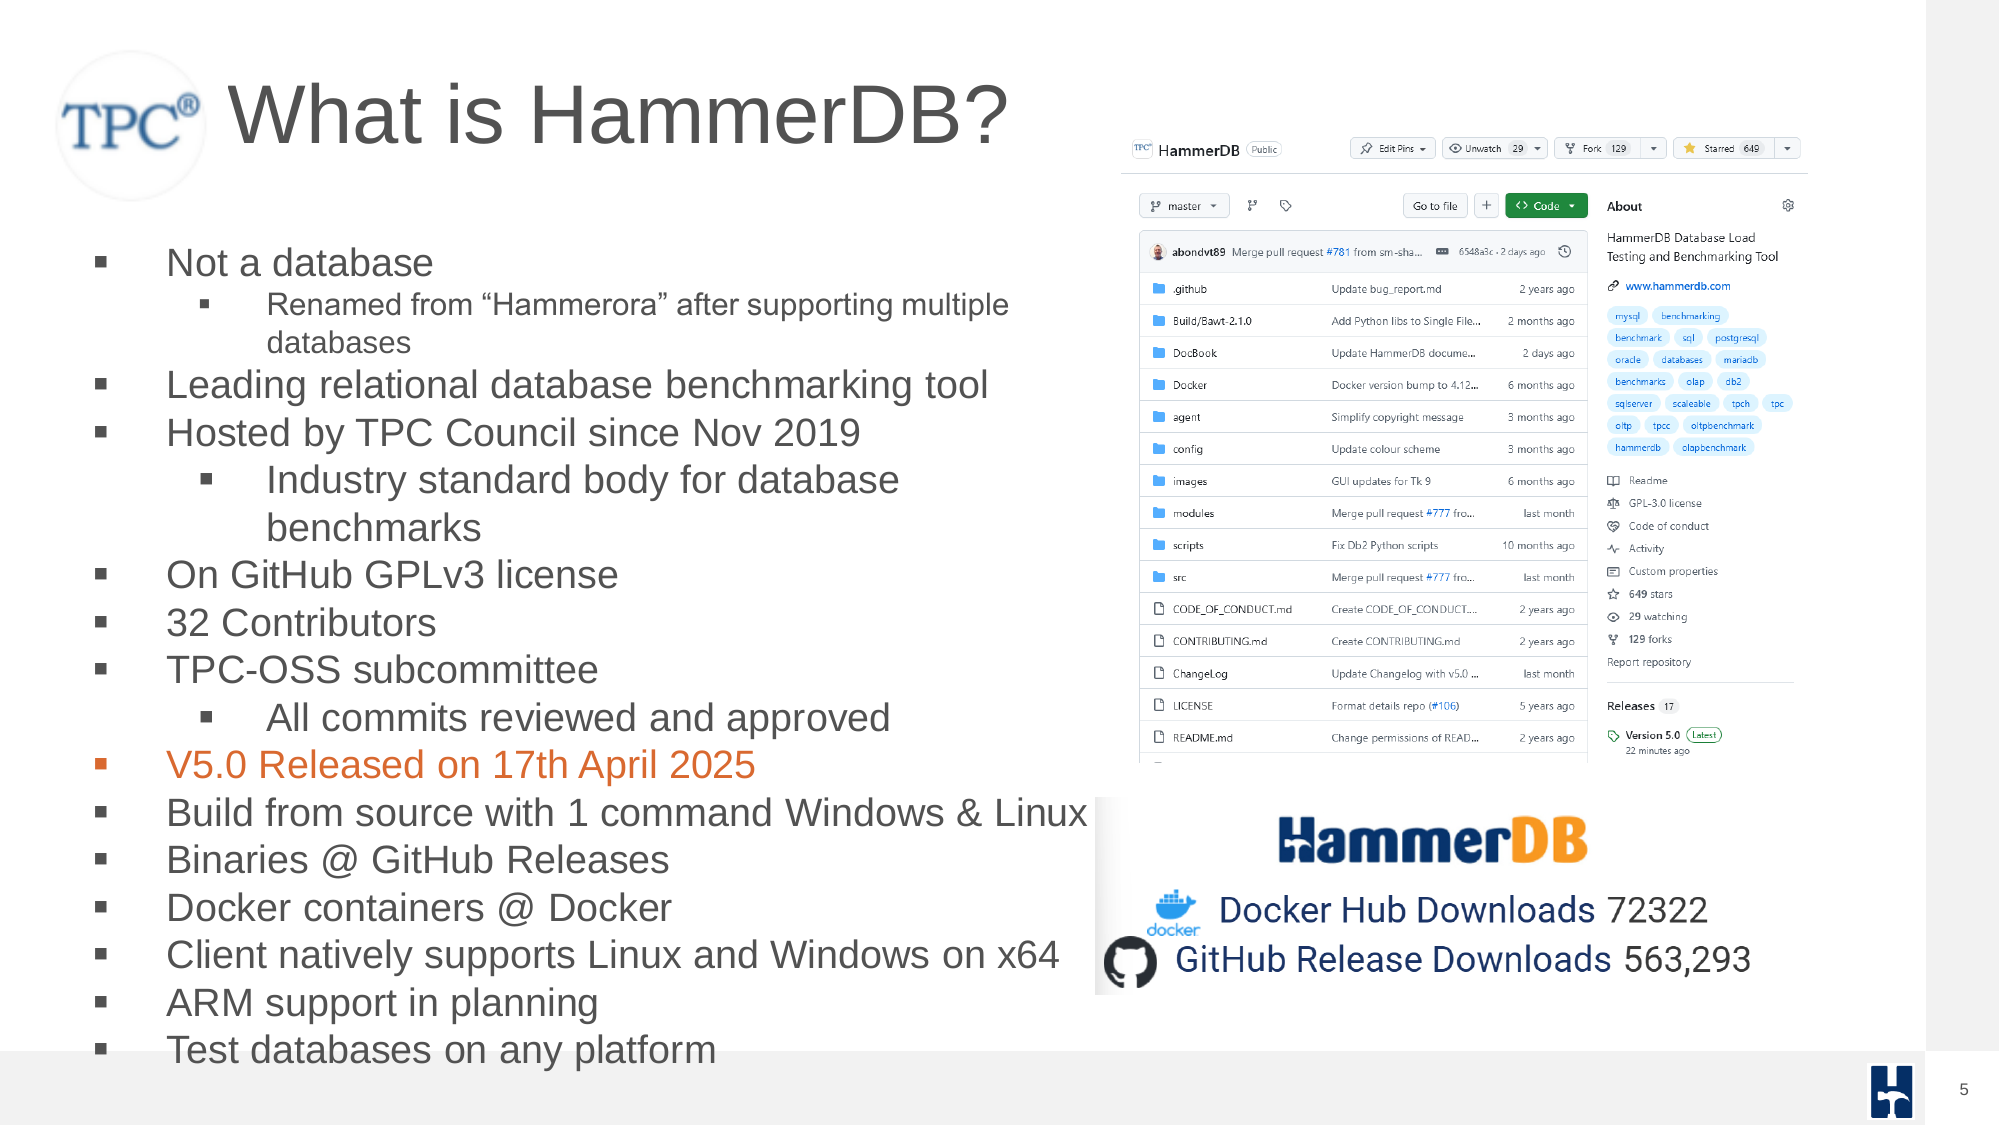
Do check the HammerDB download statistics page as HammerDB is cloned, and downloaded hundreds of thousands of times globally.
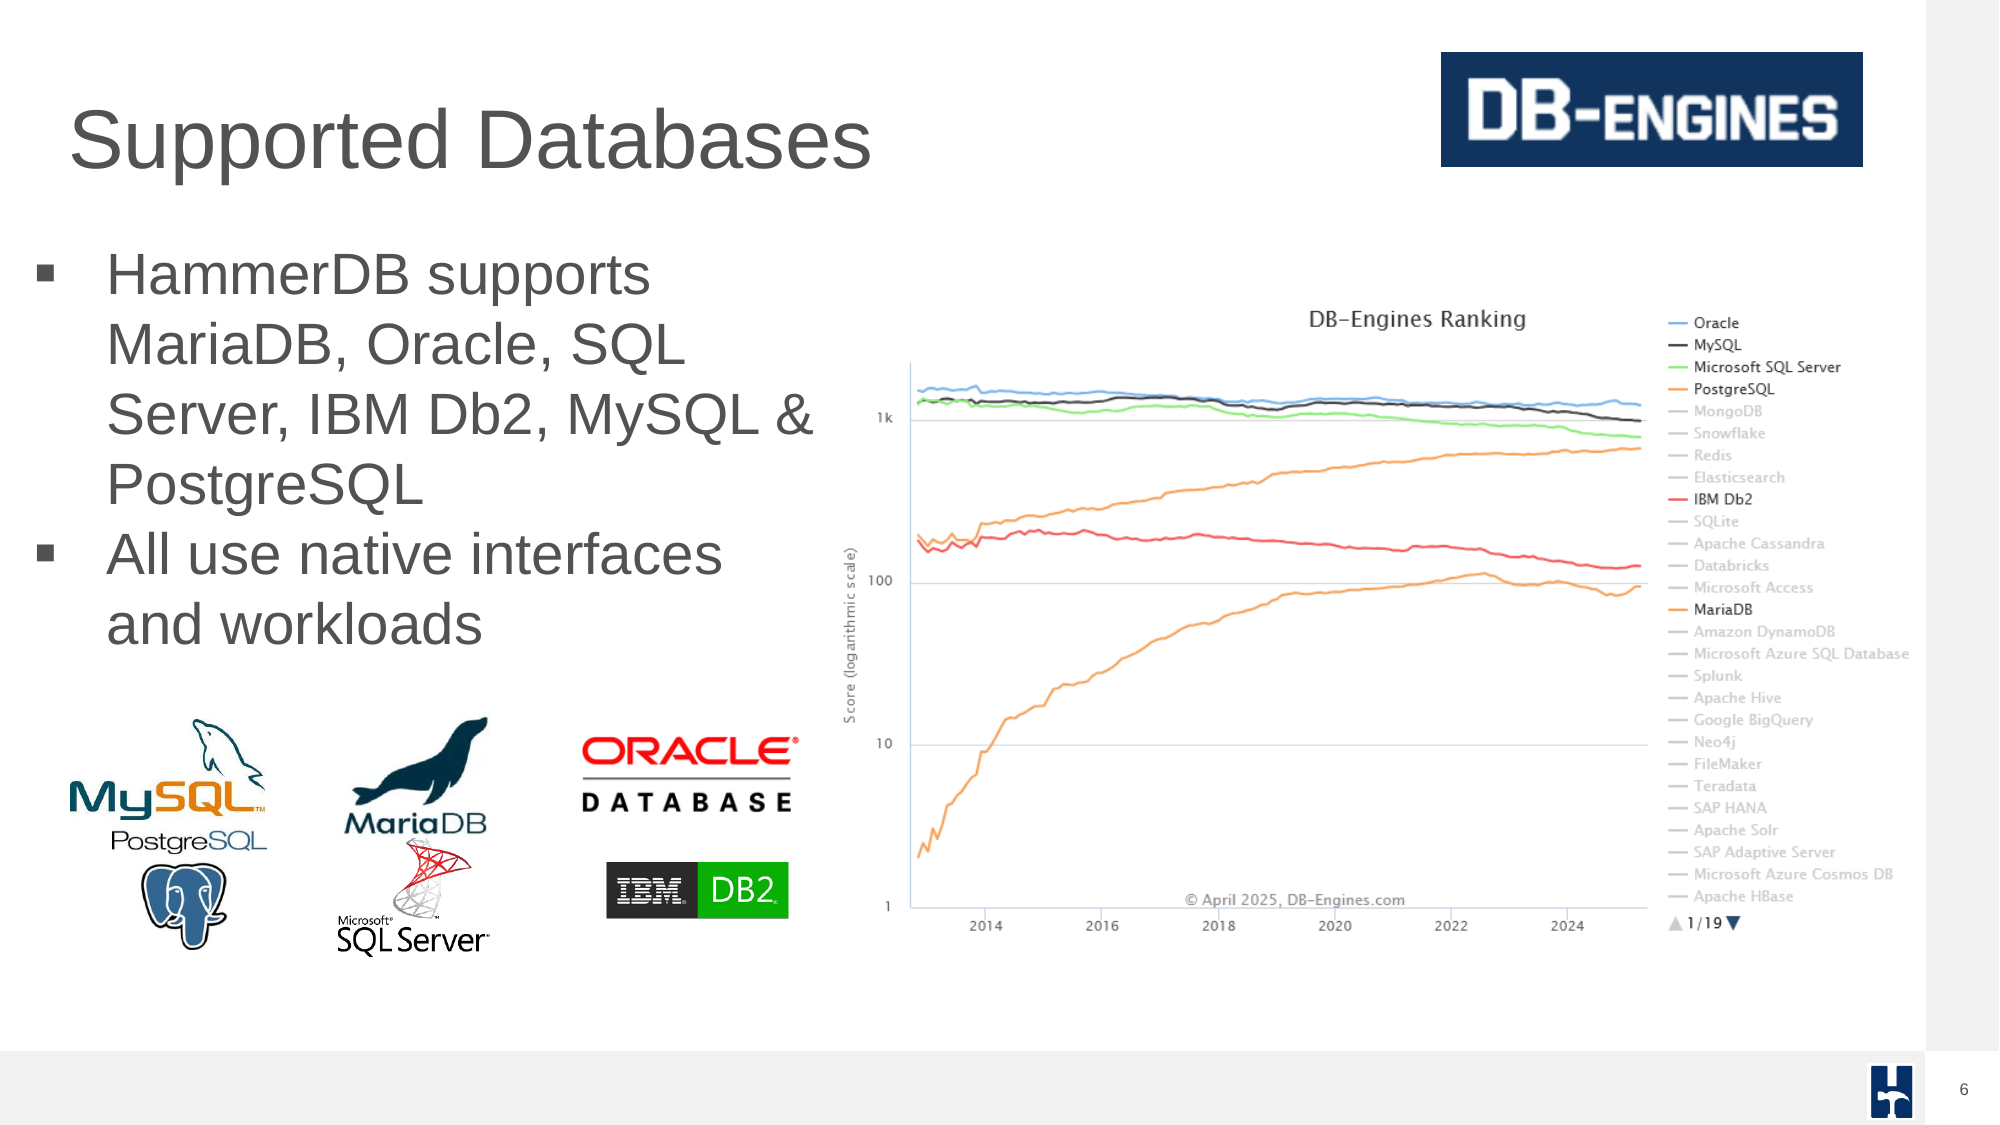
HammerDB supports multiple databases including MariaDB, Oracle, SQL Server, IBM Db2, MySQL, and PostgreSQL all accessed via native interfaces written in C for maximum performance and scalability.
HammerDB implements two primary workloads:
- TPROC-C: An OLTP workload based on the TPC-C standard, designed to emulate transaction processing environments with high concurrency and throughput.
- TPROC-H: An OLAP workload modeled after TPC-H, used for analytics and decision support scenarios with large scan-heavy queries.
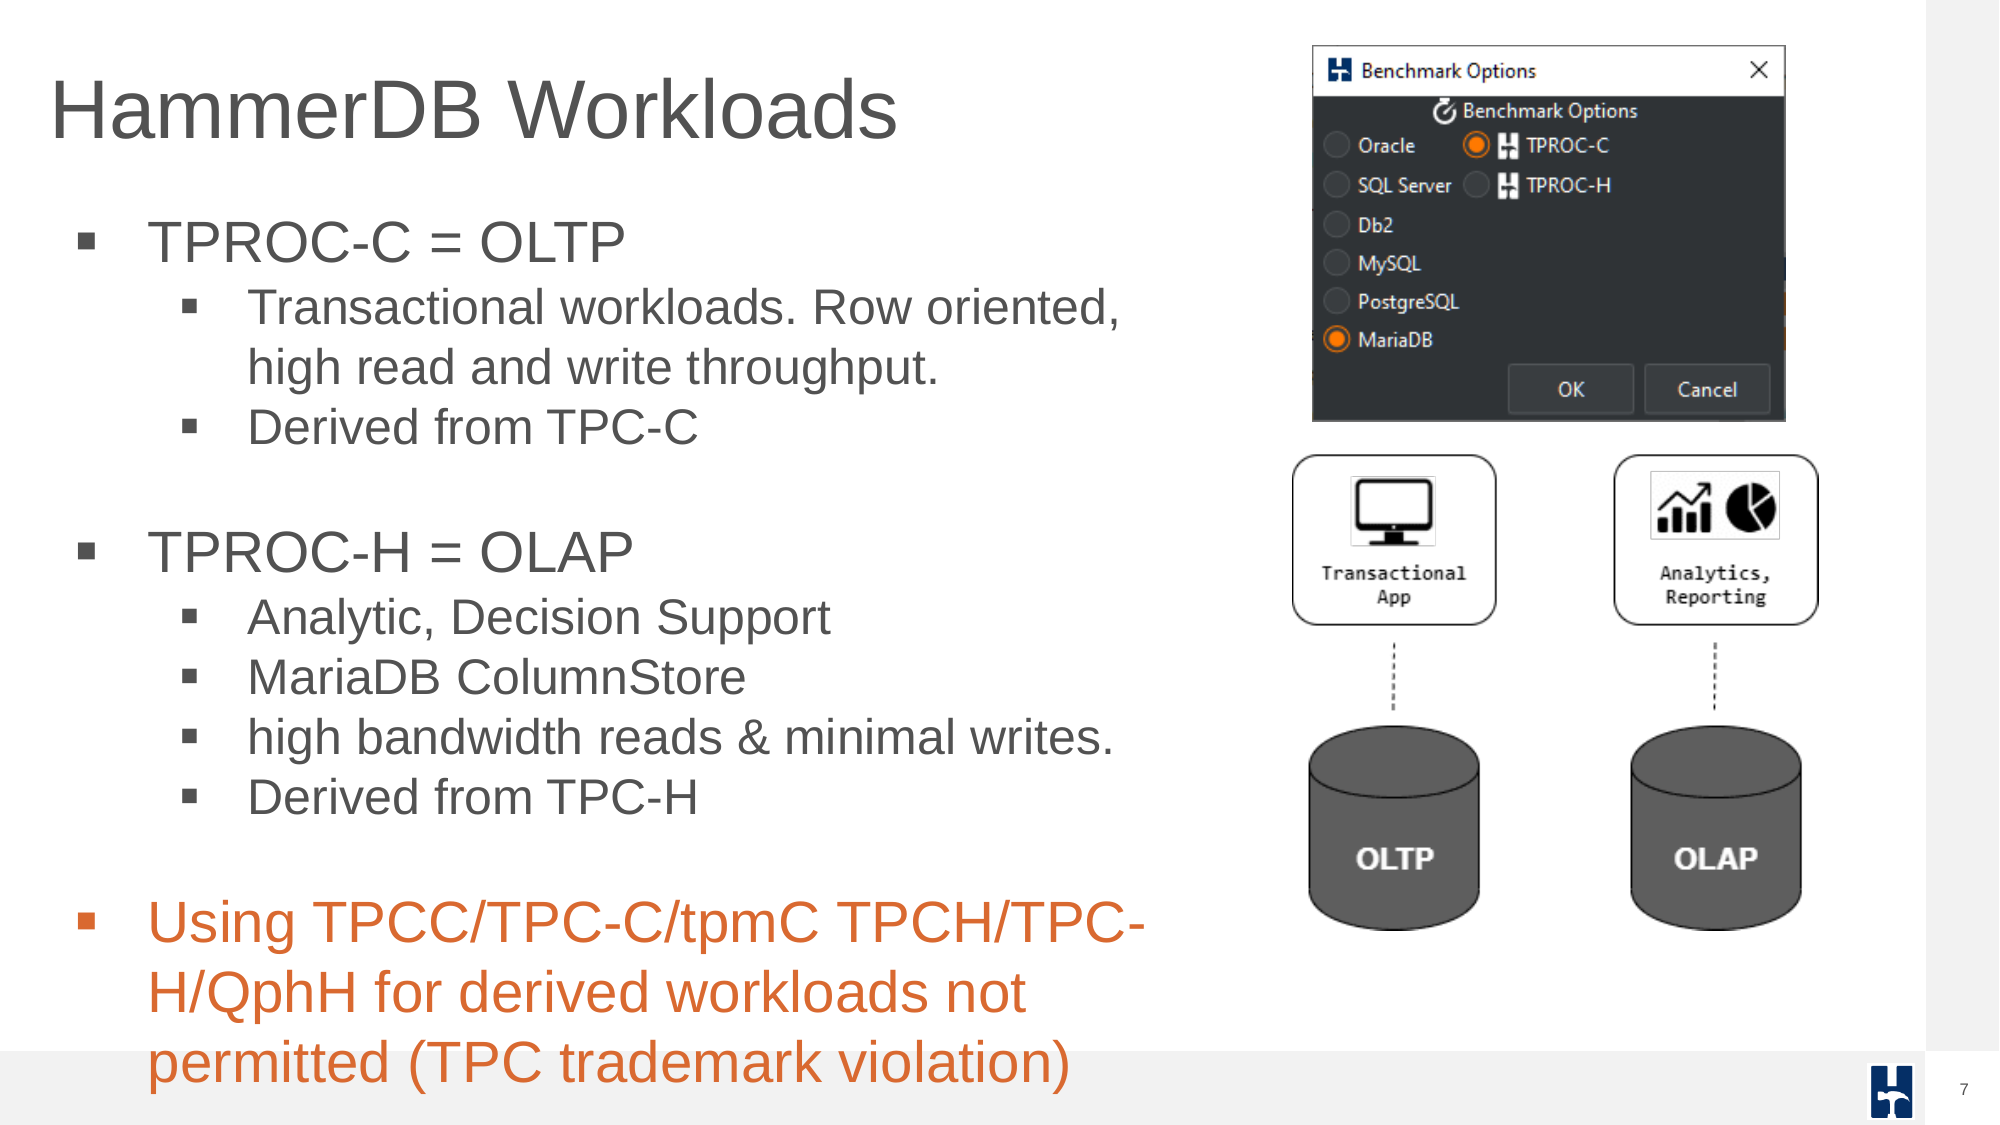
A common question is that if the workloads are based on the TPC-C and TPC-H standards then why not simply use TPC-C and TPC-H and the associated terminology such as tpmC and QphH. The answer is clear in that this terminology is copyrighted and a trademark of the TPC-Council and any tool and users using this terminology is violating these restrictions unless a workload is approved and published on the official TPC site. Using HammerDB you are assured that no copyright or trademarks are infringed when using or sharing (where permitted) performance data.
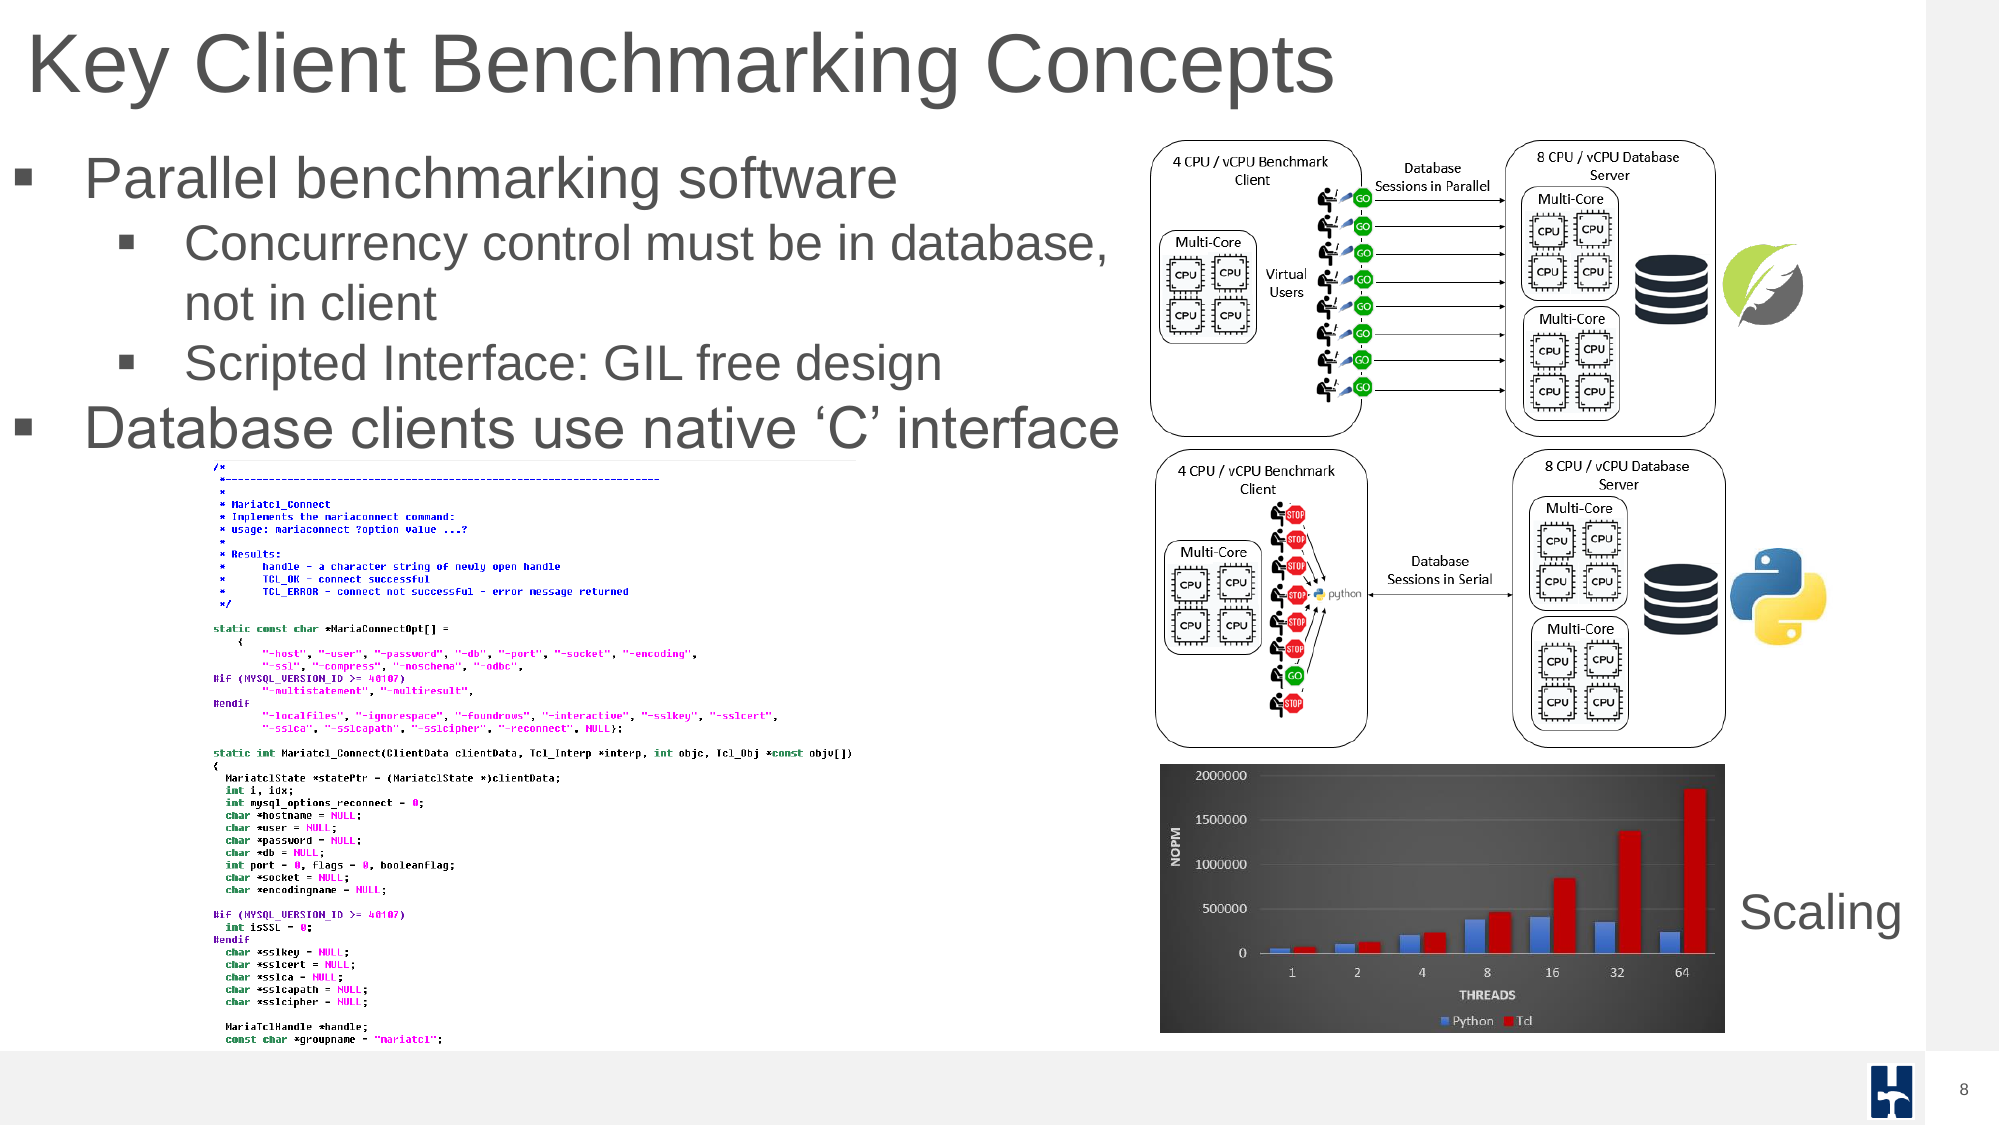
As would be expected with a database benchmarking tool, all workloads are implemented in SQL, for every workload and every database what runs in the database is SQL. For efficiency all of the HammerDB database interfaces are written in the native ‘C’ interface.
A key database benchmarking concept is that the tool and workload should stress the concurrency in the database and not in the client. A number of database benchmarking tools fall at this first hurdle. HammerDB is designed with low overhead and non-blocking, multithreaded parallel execution, ensuring we are stressing the concurrency control in the database and not in the client.
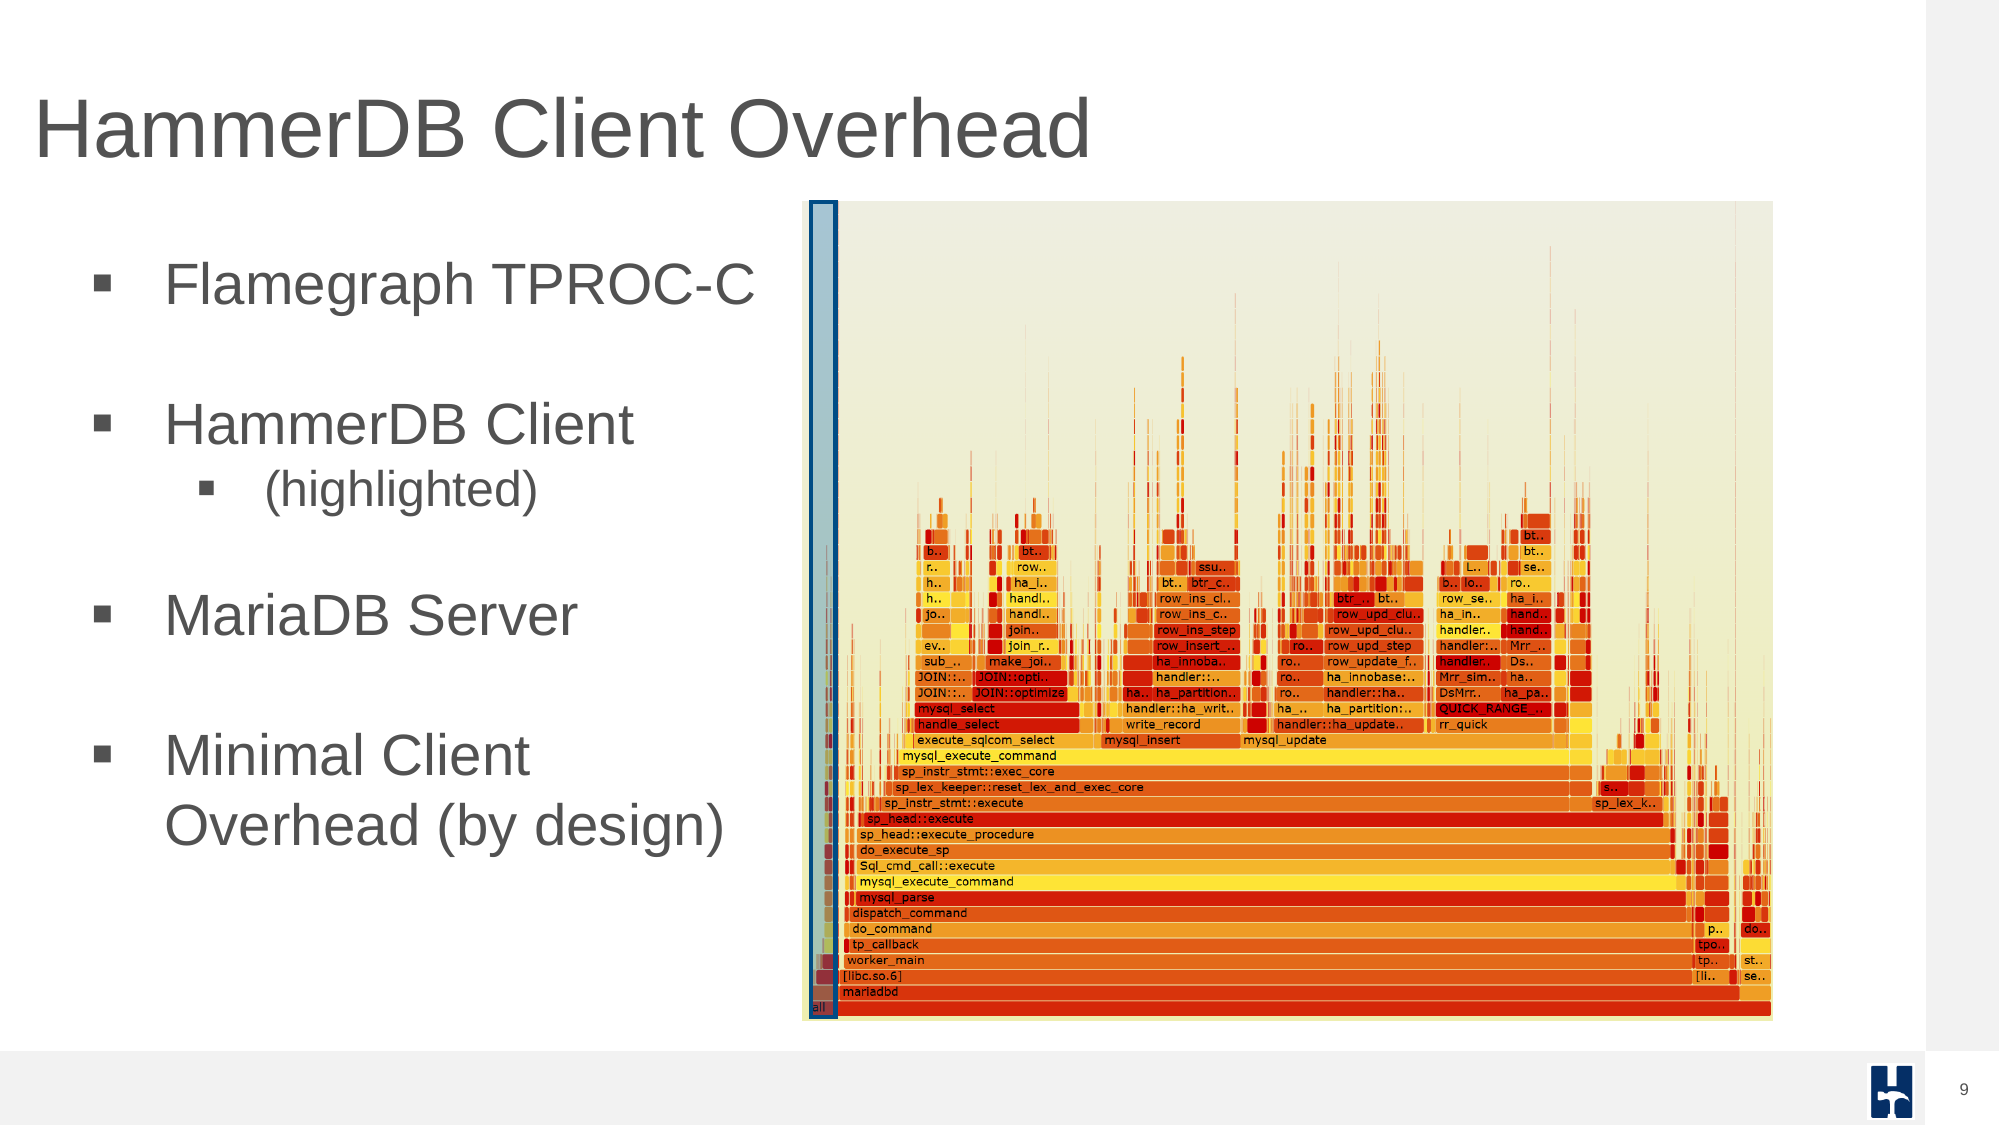
If you generate a flamegraph during a HammerDB test it demonstrates the minimal impact of the HammerDB client on system performance during TPROC-C benchmarking.
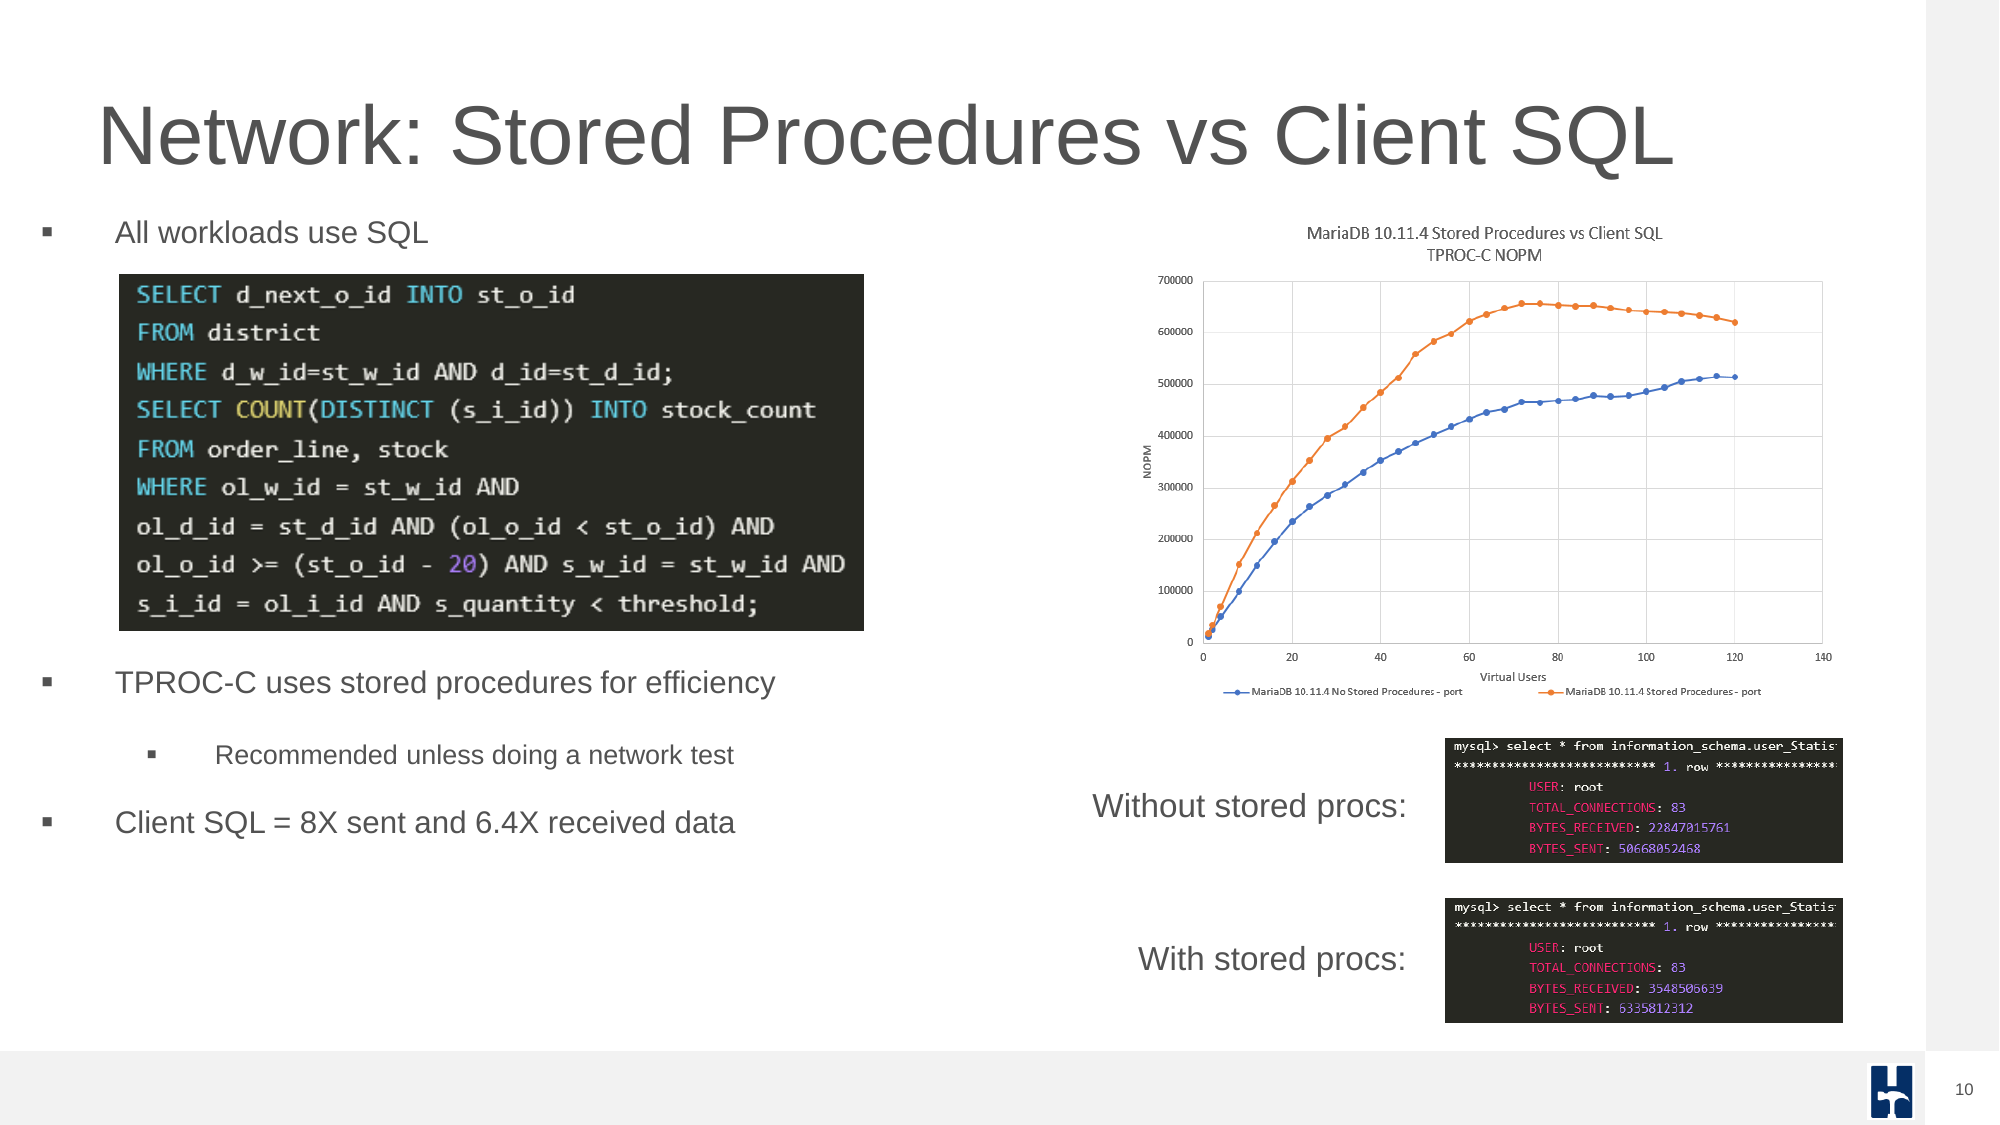
For OLTP tests, using stored procedures is highly recommended to reduce overhead and simulate realistic transactional patterns. This drastically reduces network round-trips and improves efficiency.
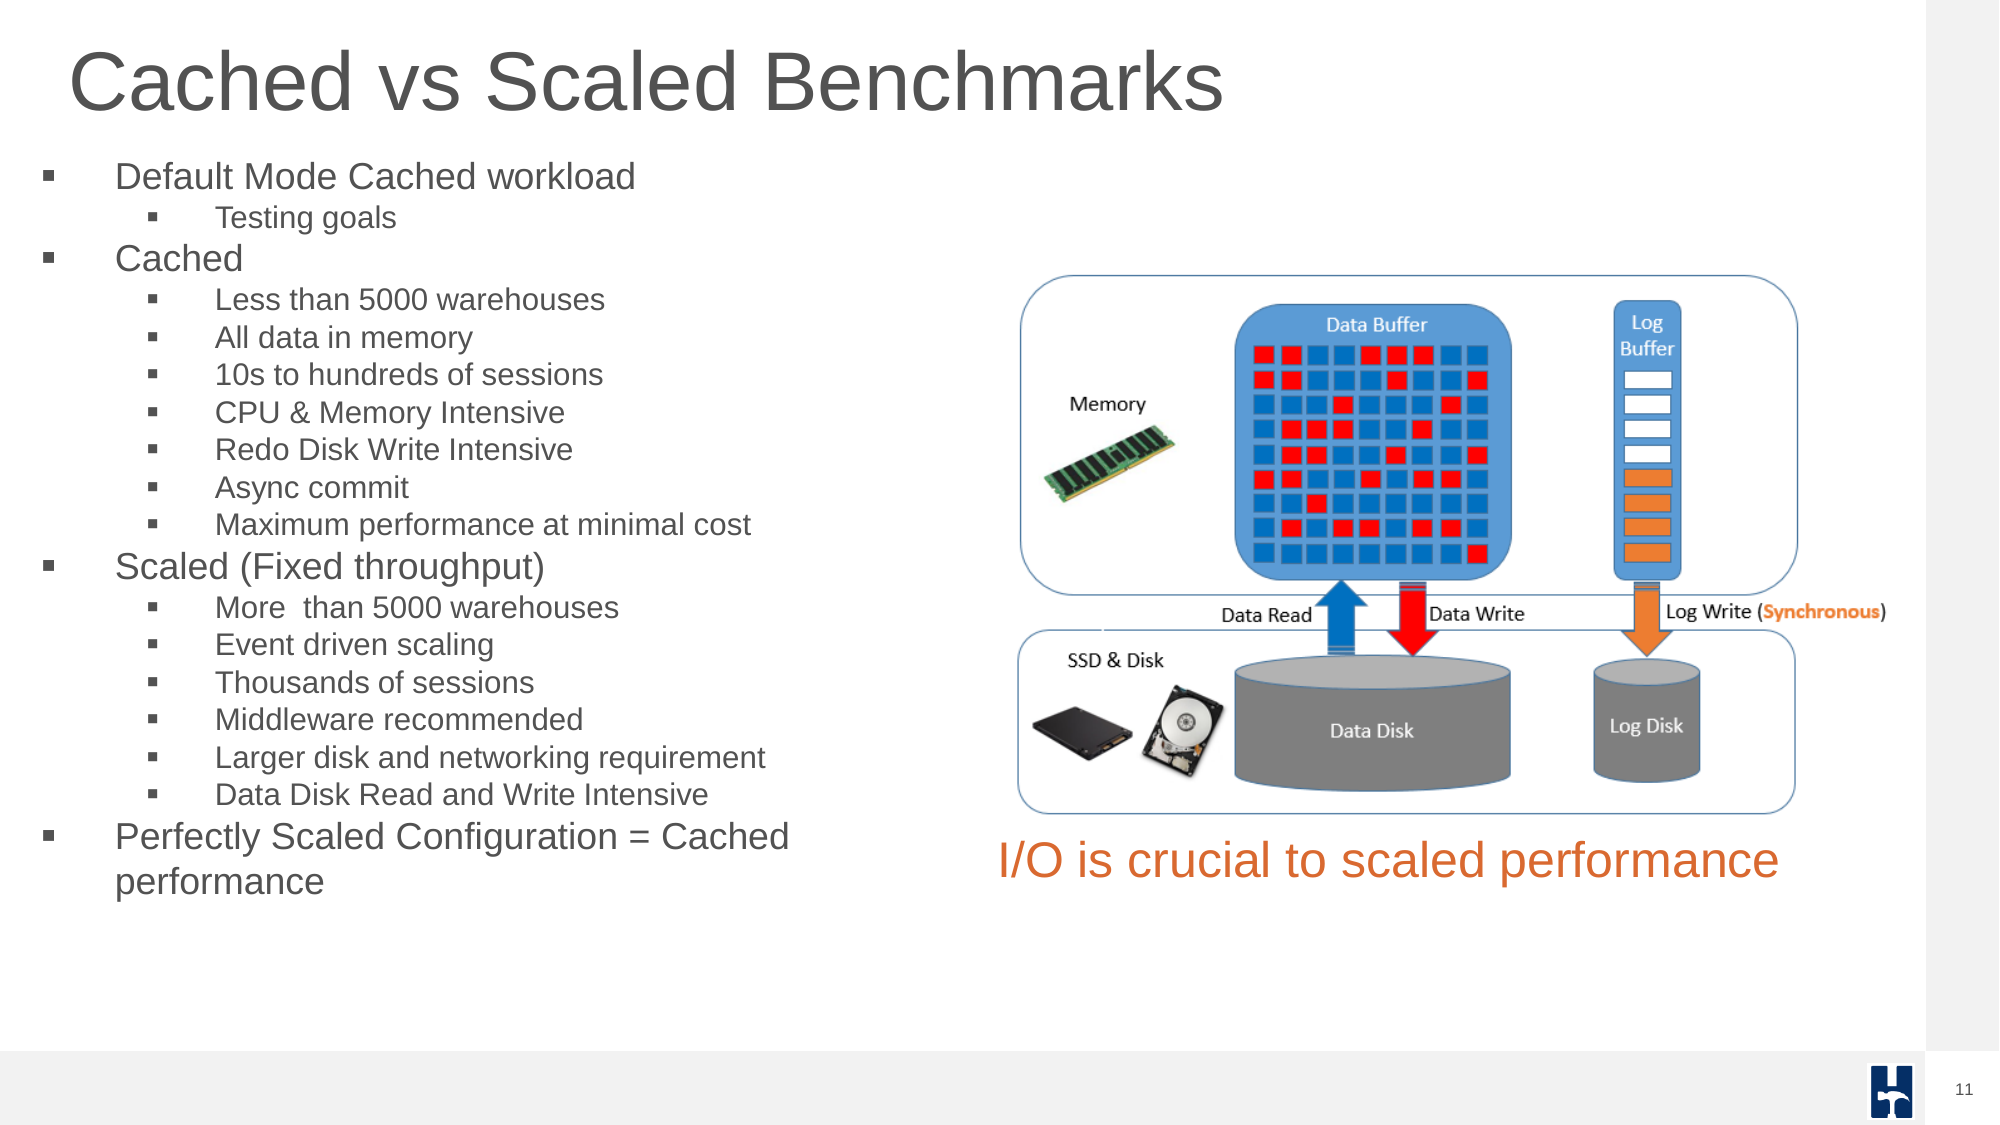
Another important concept that catches out many benchmarking beginners is the concept of cached vs scaled workloads. HammerDB always recommends starting with a cached workload, this ‘sets the bar’ for performance of a particular database and server. Advanced users can then scale an environment with HammerDB advanced features to match the cached performance.
Interfaces, Schema, and Configuration
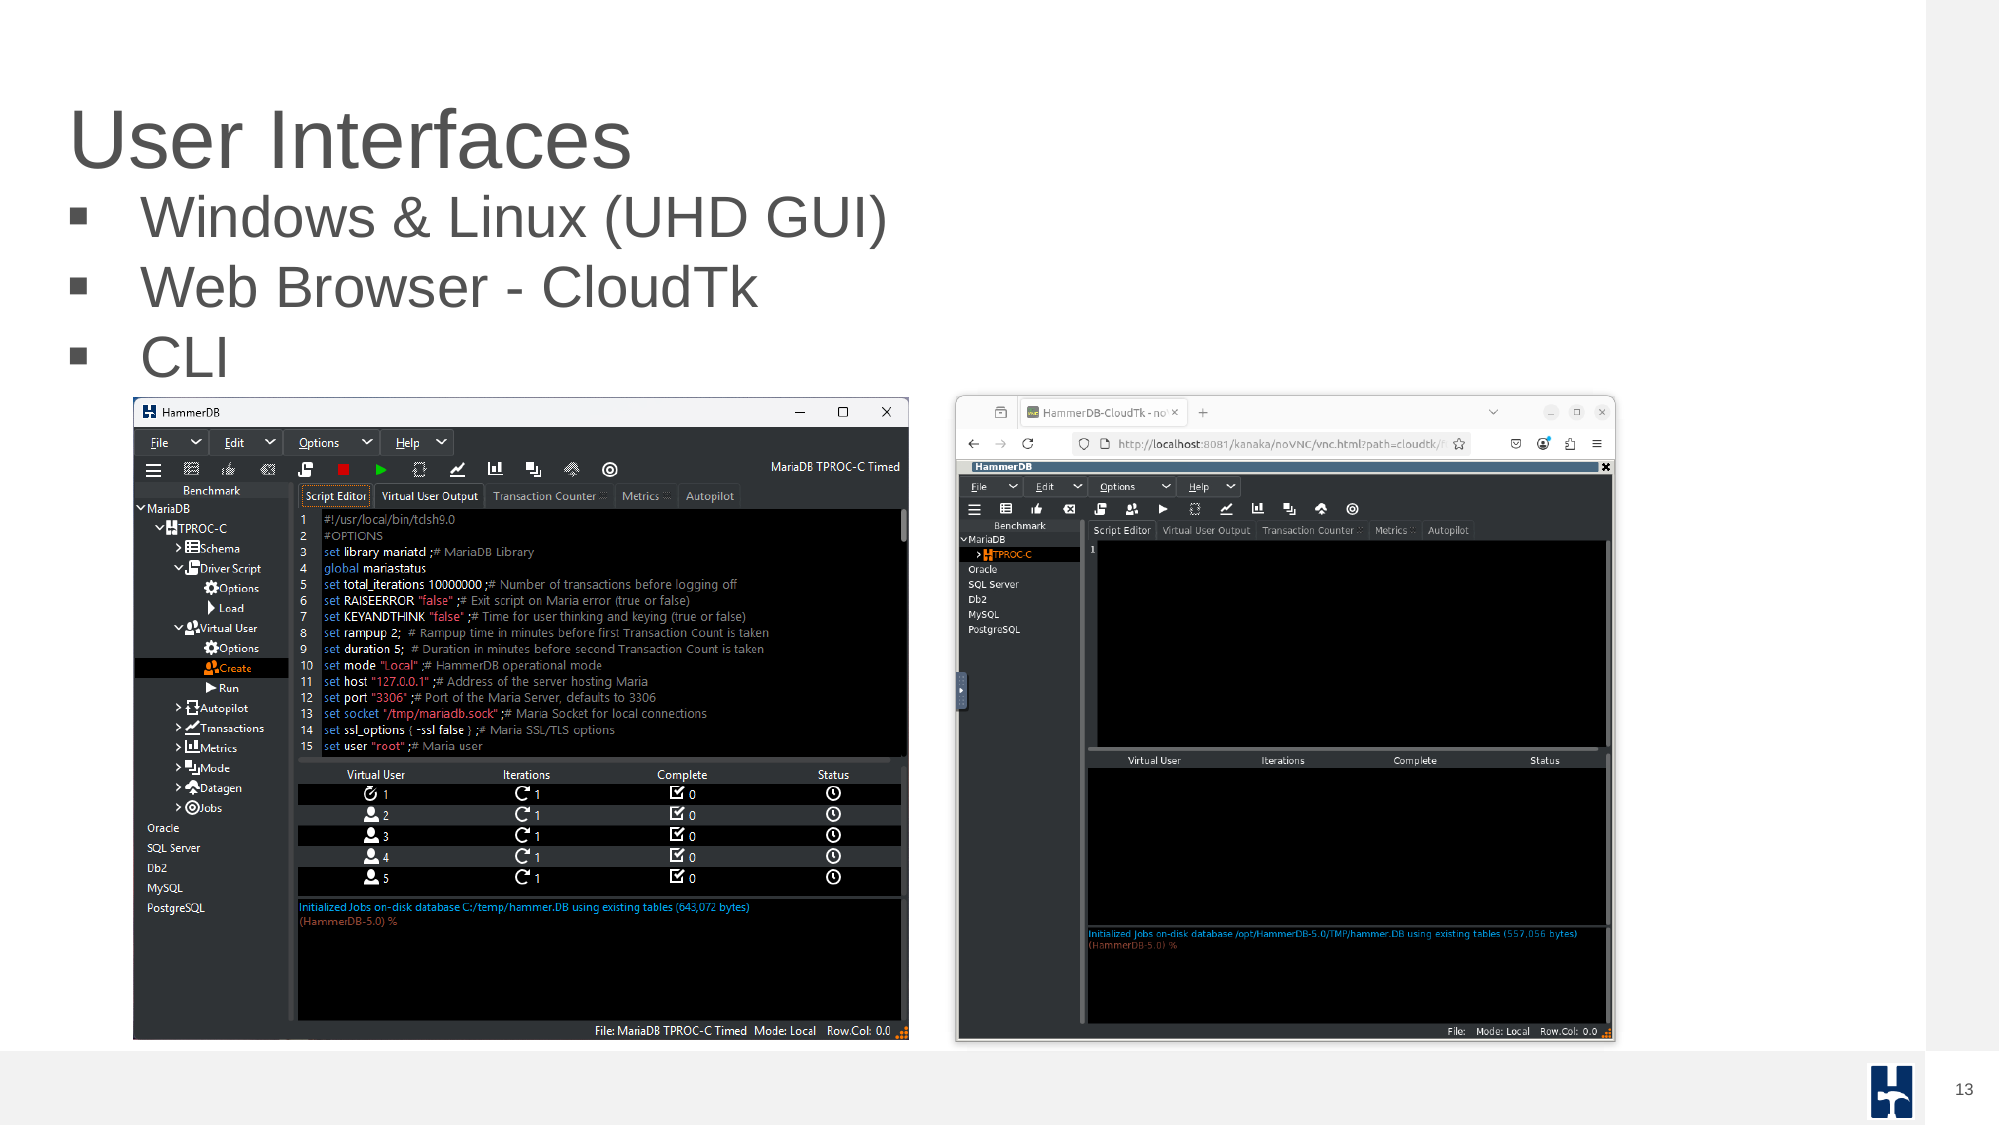
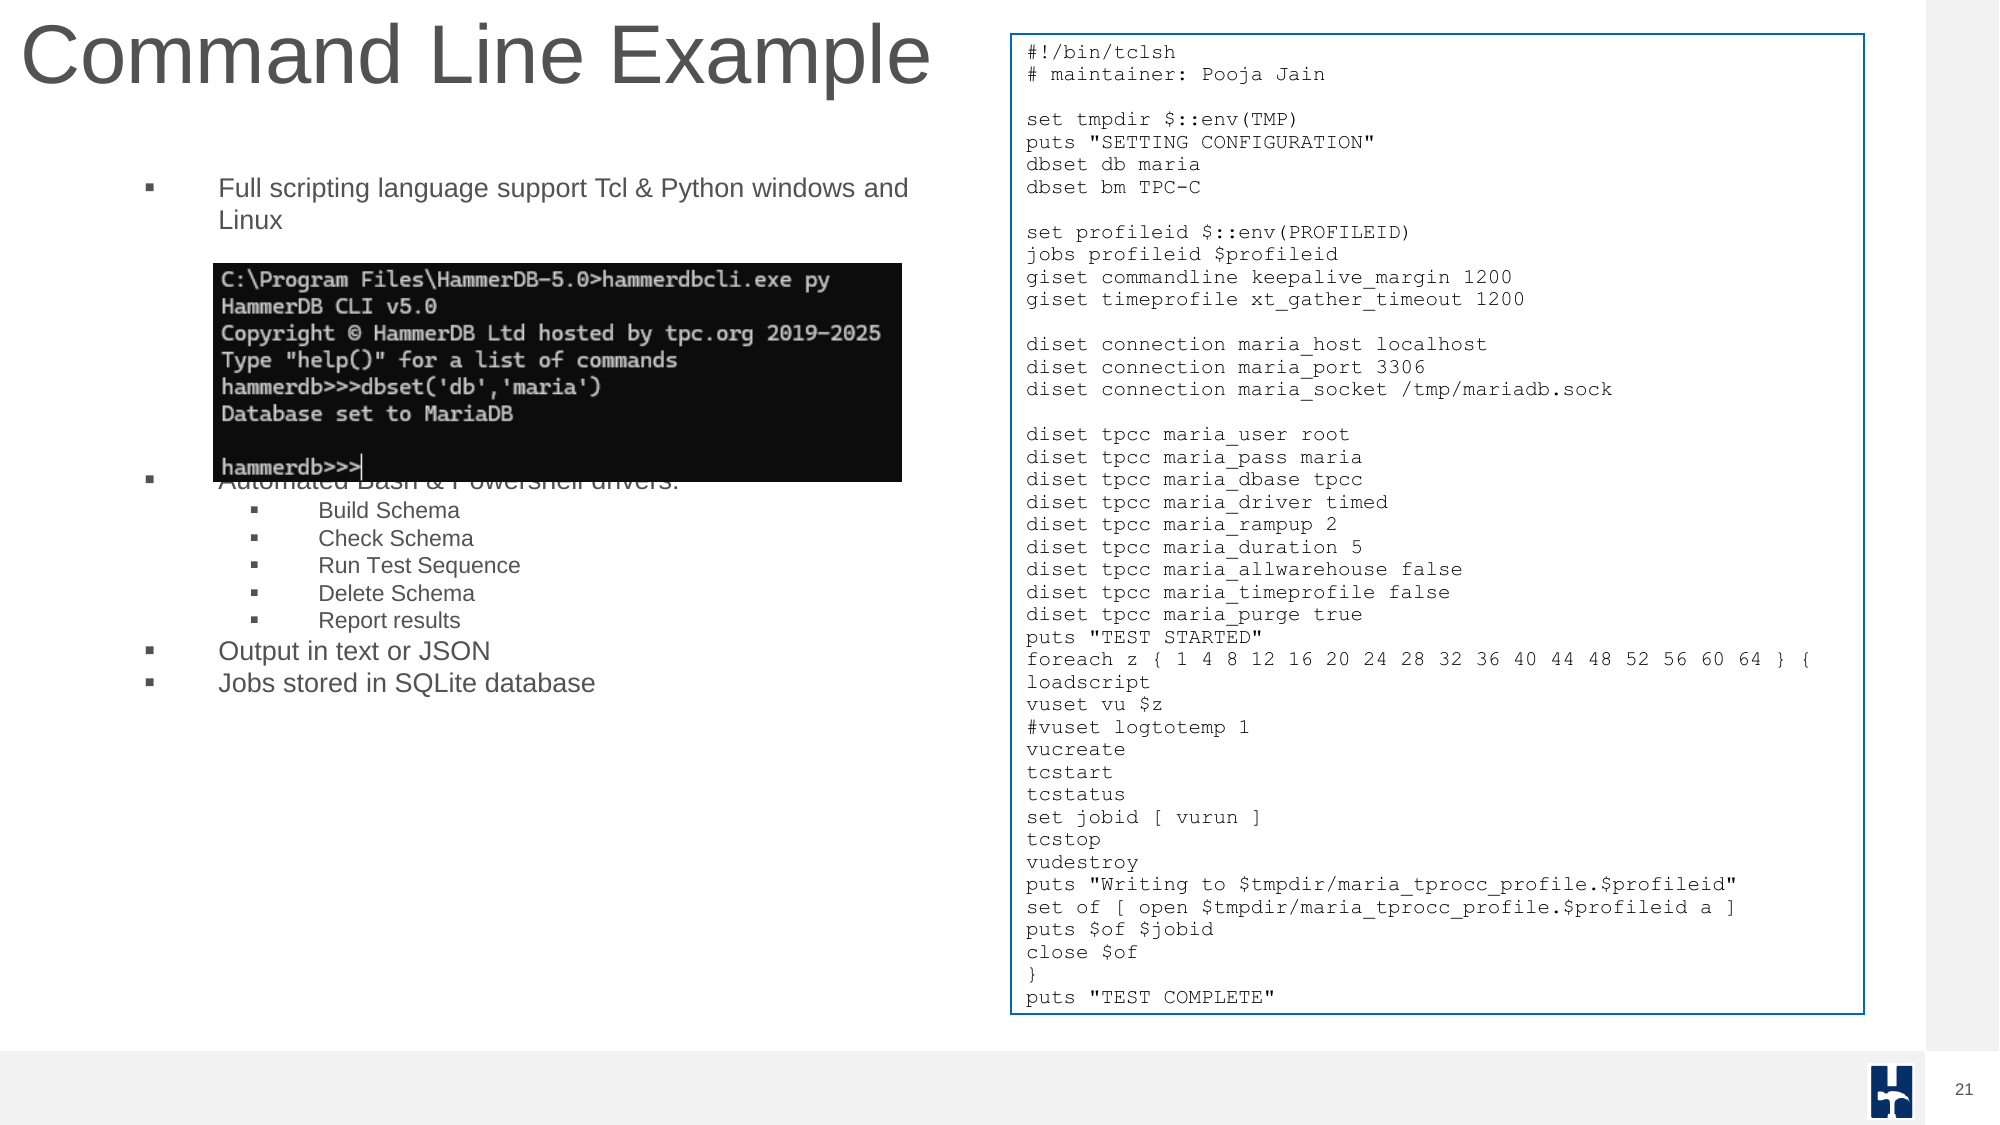
HammerDB offers multiple user interfaces: a native UHD GUI for Windows and Linux, a web interface (CloudTk), and full command-line support for automation.
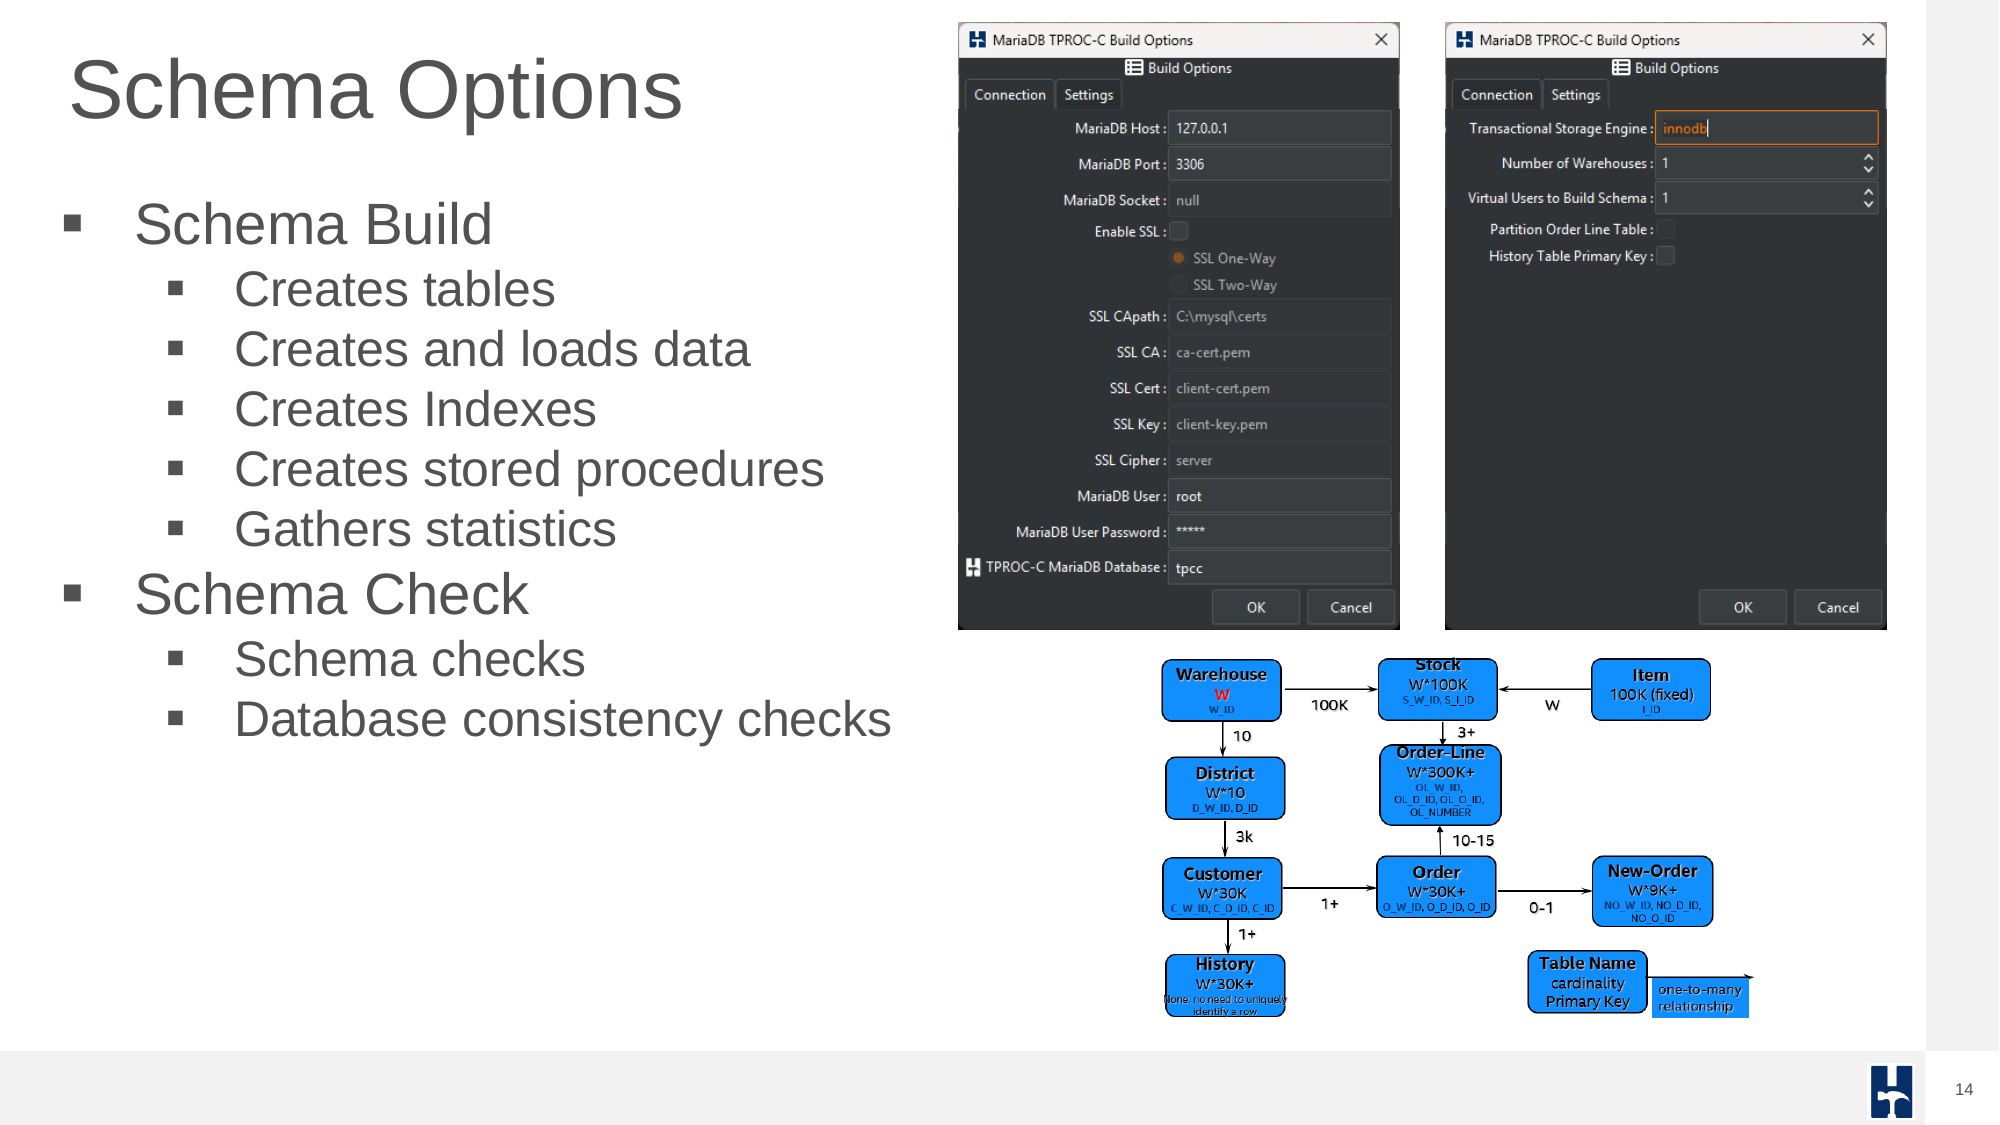
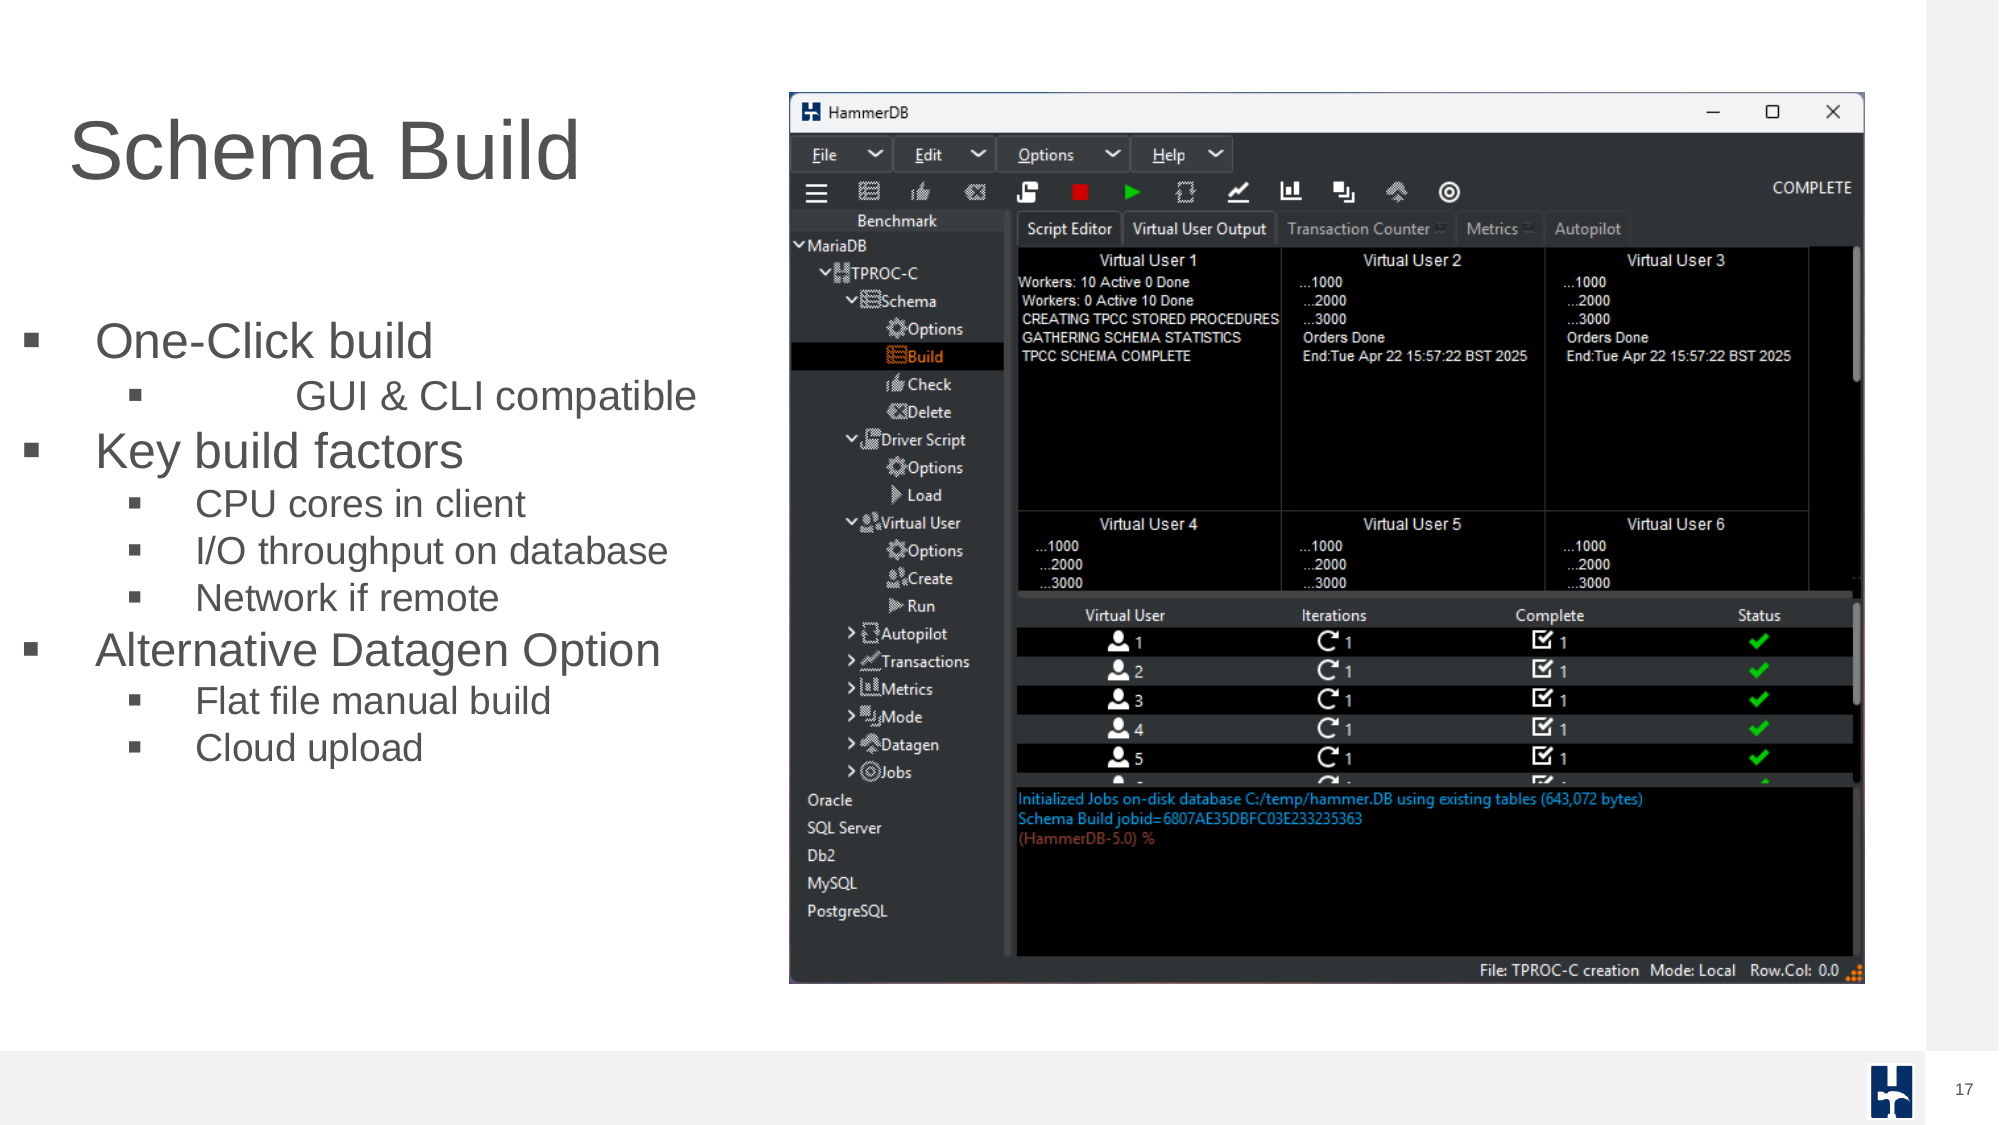
Schema creation is a streamlined process. HammerDB builds the tables, loads the data, creates indexes and stored procedures, and collects statistics with a single action. You can also perform schema checks to ensure consistency.
Schema builds are affected by CPU (on the client), I/O (on the server), and network bandwidth if run remotely. For cloud-native benchmarks, it’s also possible to generate data into flat files and upload to the target system.
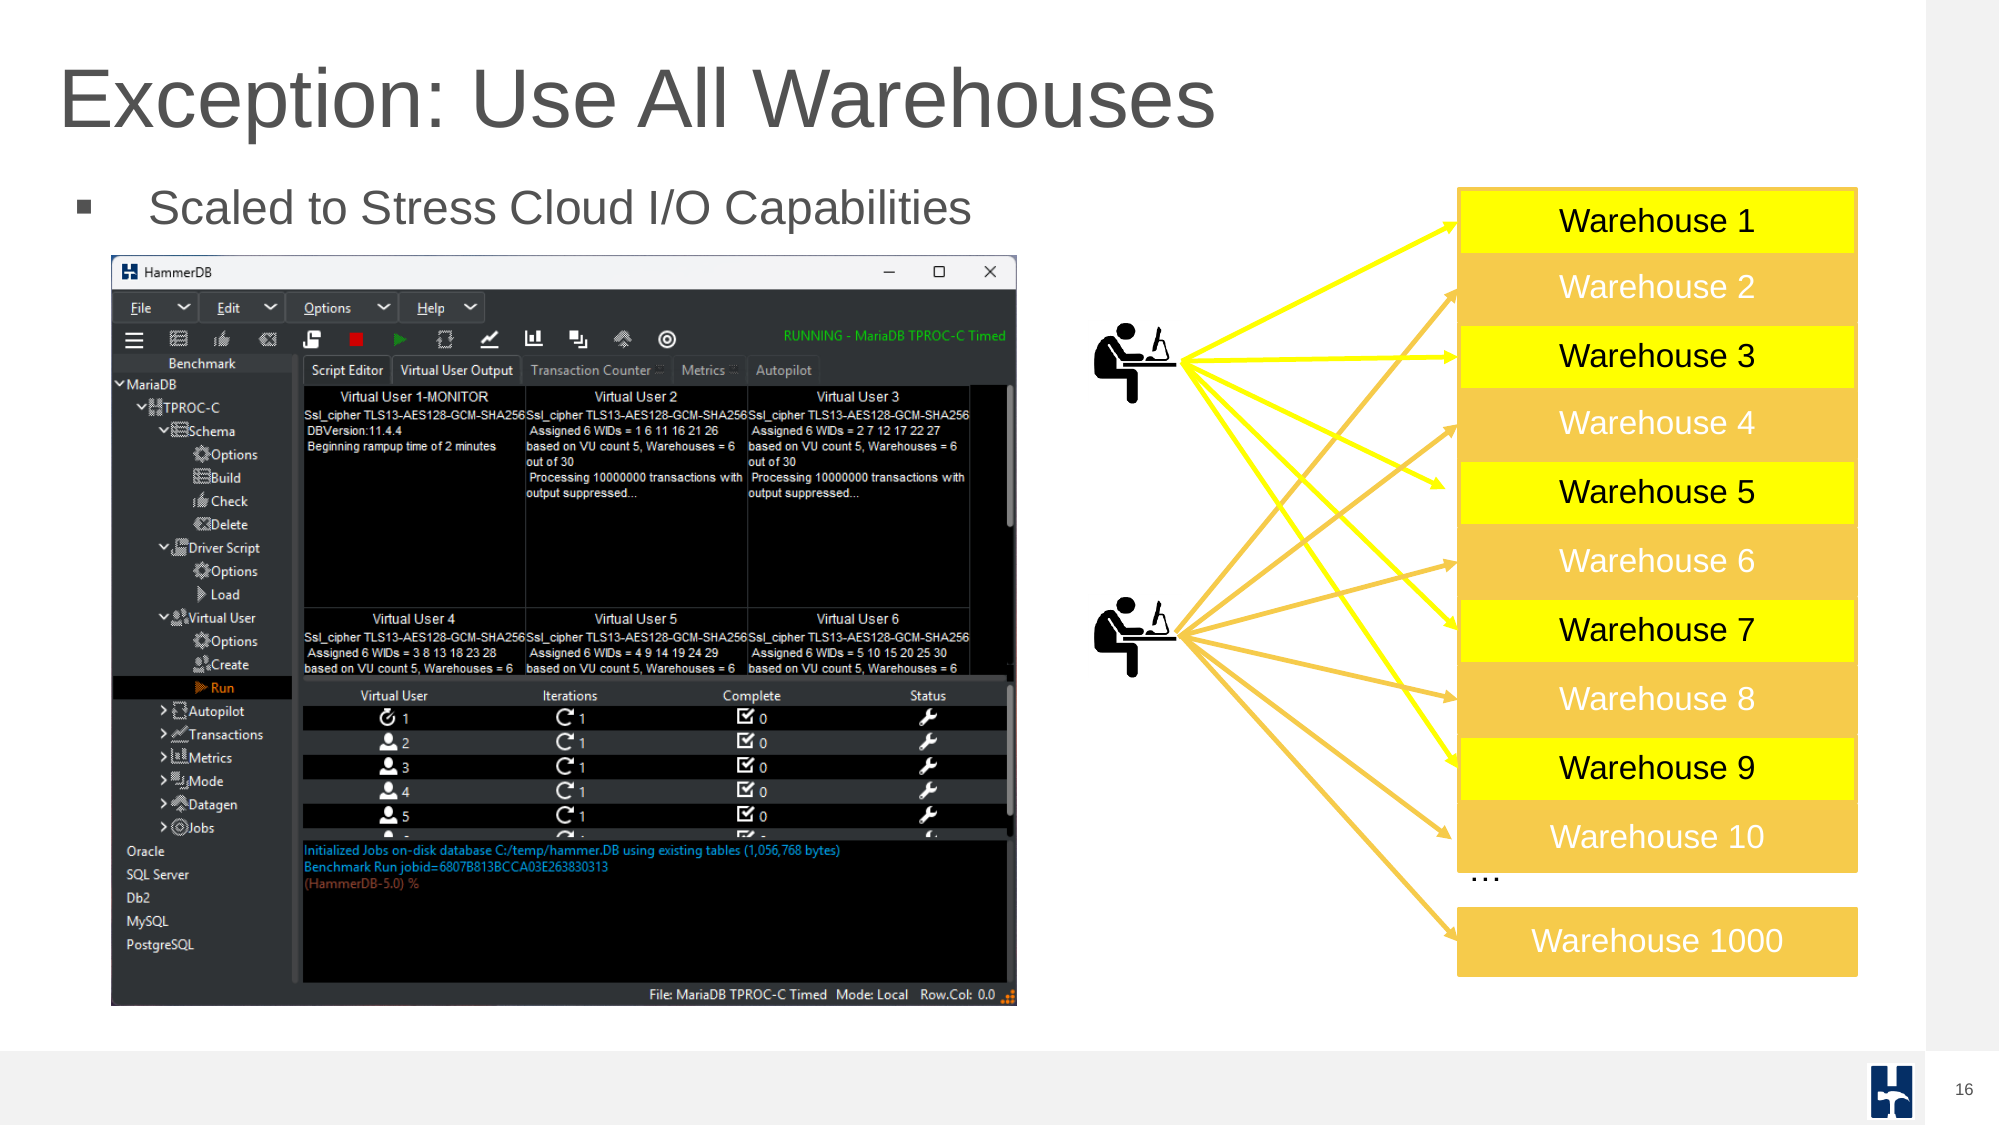
One common question is how many warehouses to configure. For most benchmarks, only a subset of warehouses are used as virtual user primarily accesses one warehouse. This keeps the data “hot” for a cached workload.
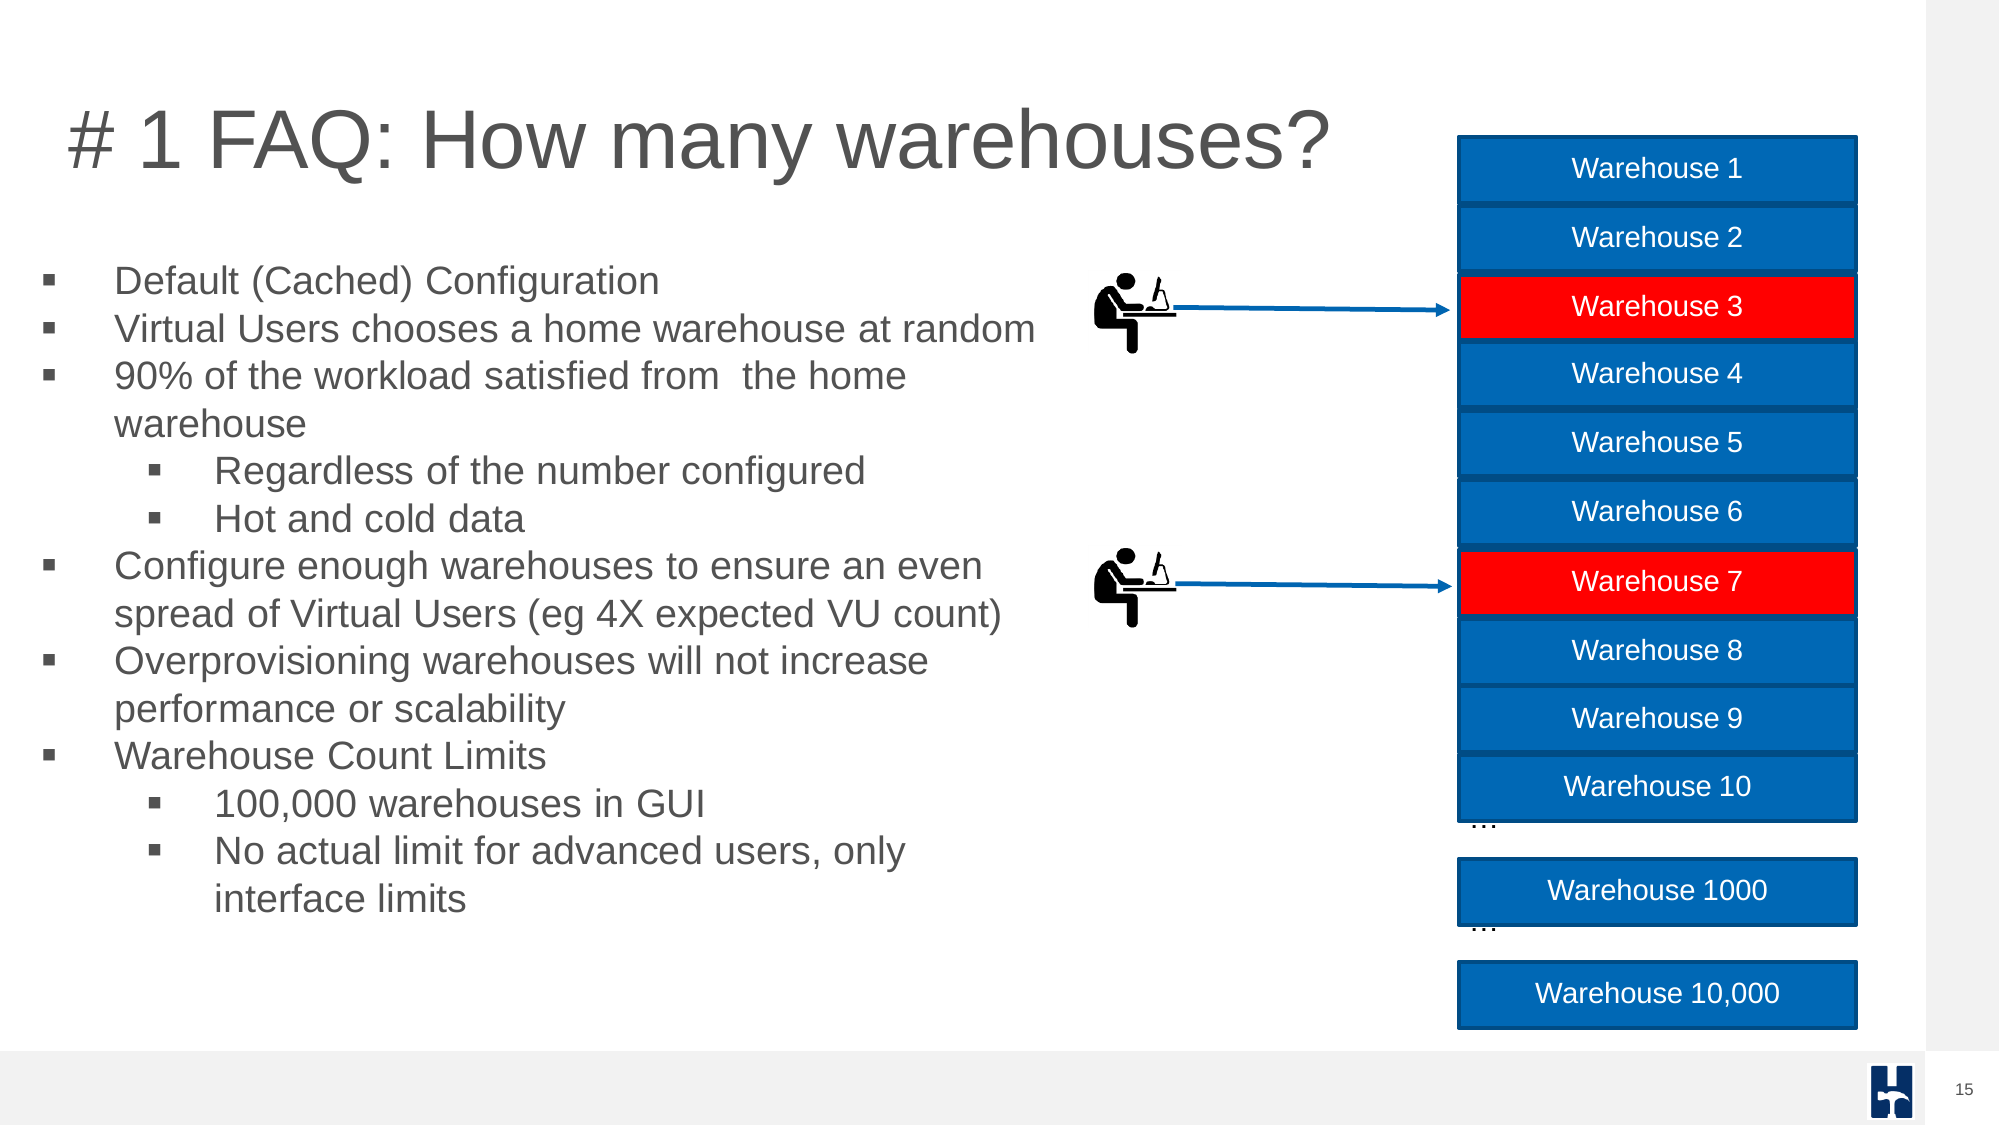
However, advanced scenarios like full-warehouse access allow for distributed I/O stress testing, especially in cloud environments.
Running Benchmarks and Automating Workloads
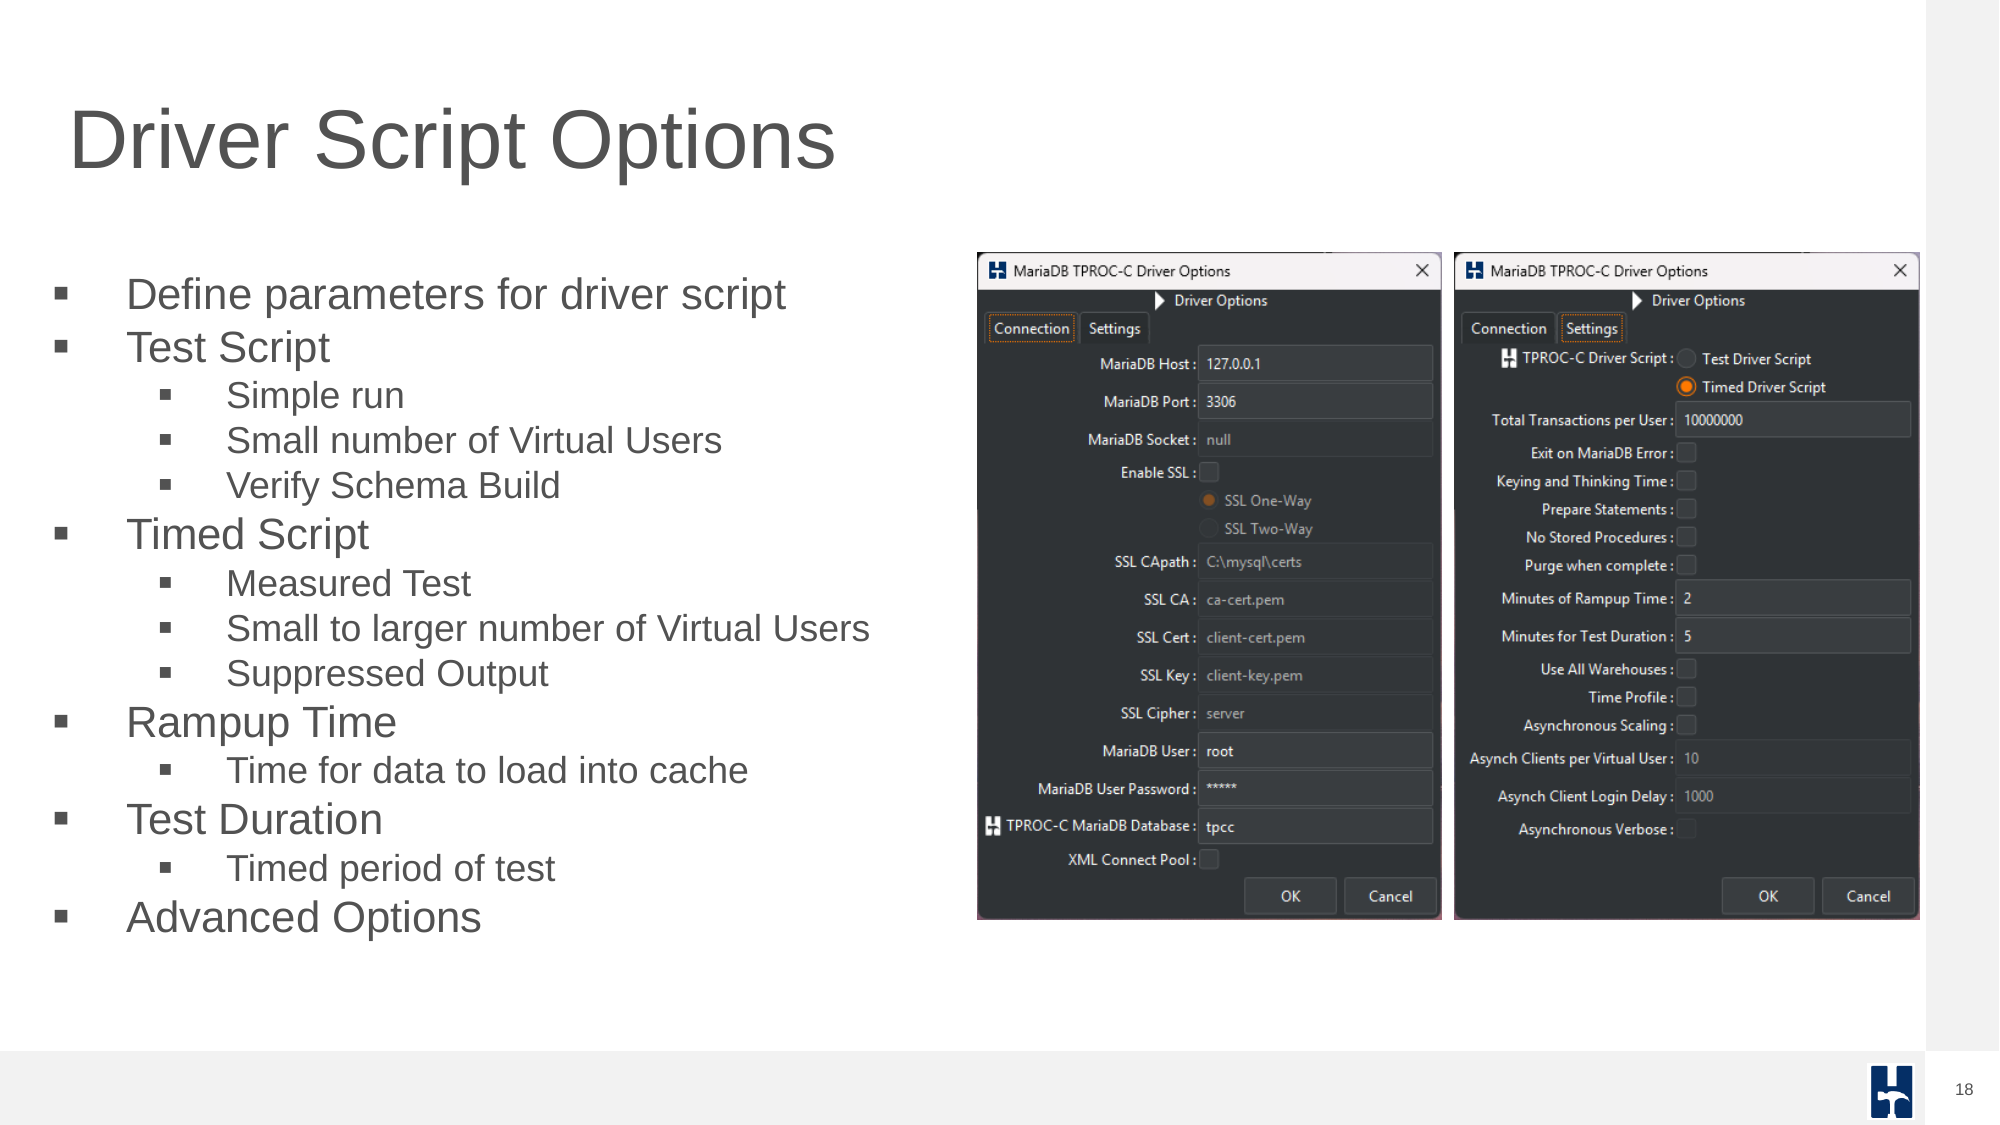
HammerDB supports flexible test configuration via driver scripts. These can be used to perform quick functional tests or timed runs that simulate production workloads. Test durations, ramp-up periods, and concurrency levels are easily configured.
While the GUI offers one-click test execution, automation for advanced users is where HammerDB excels. Using Tcl, Python, Bash, or PowerShell, entire workloads from schema creation to results capture can be scripted and run as part of CI pipelines. Docker images also enable HammerDB to be run in such environments in a self-contained environment.
Driver scripts offer flexible execution: quick test scripts, timed runs with ramp-up, and advanced custom options.
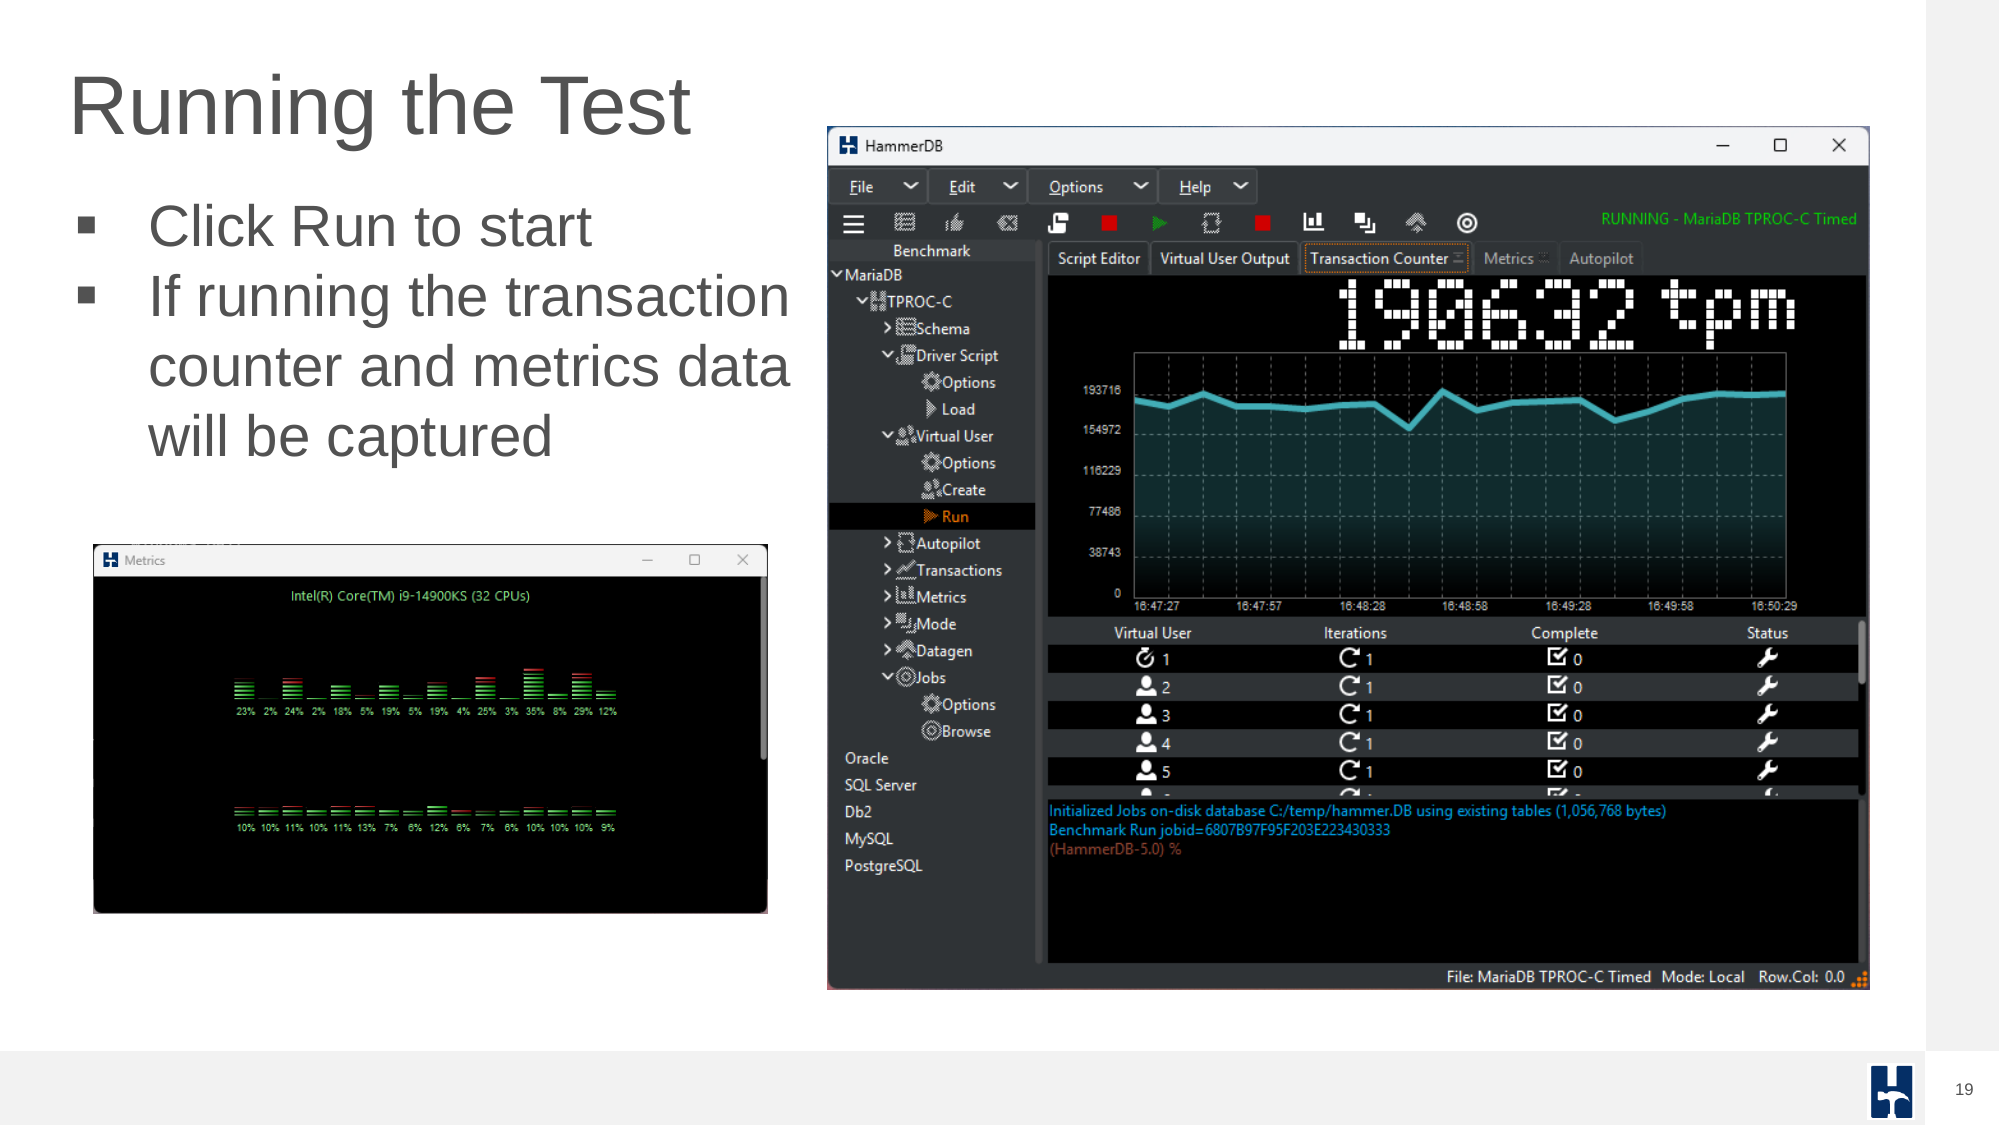
Running a test captures performance metrics and transactions over time.
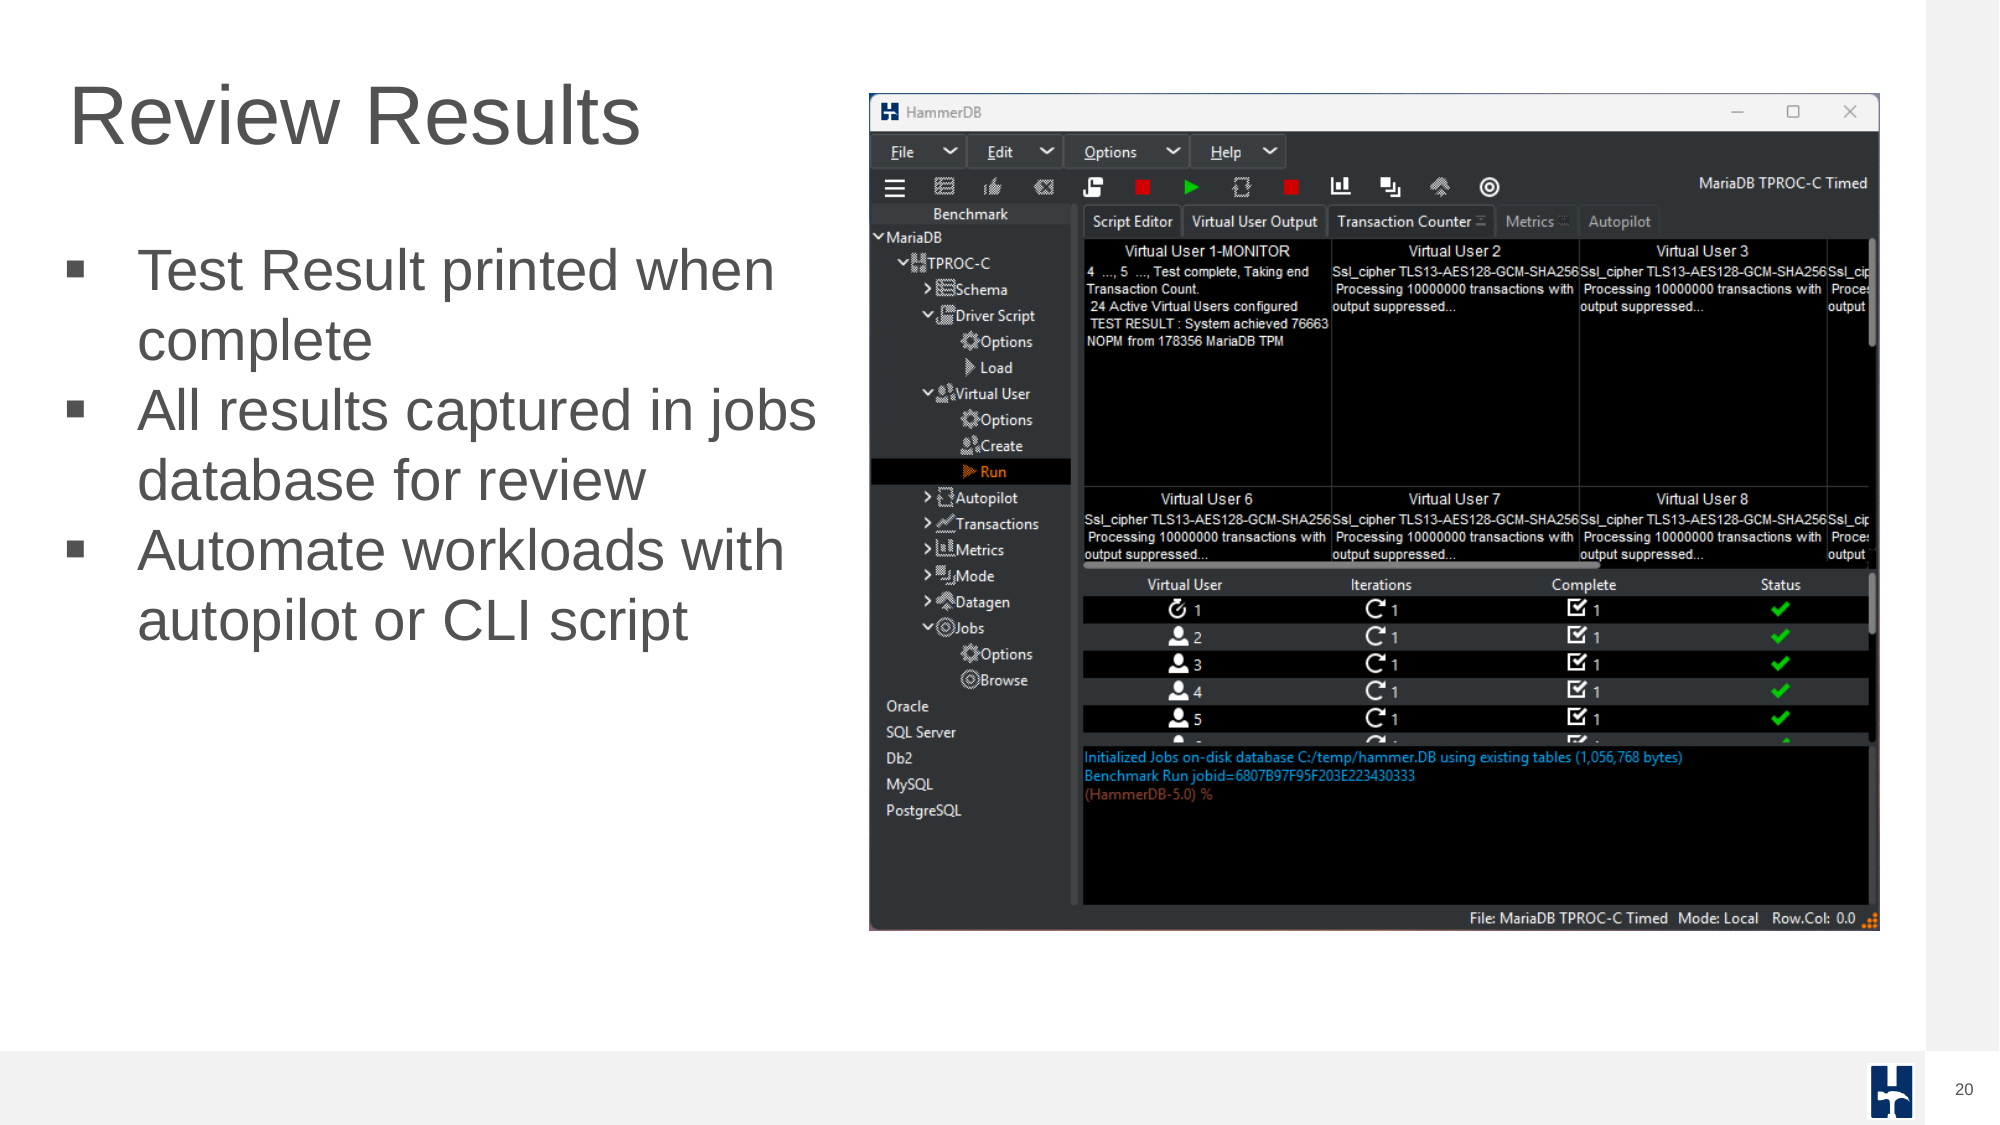
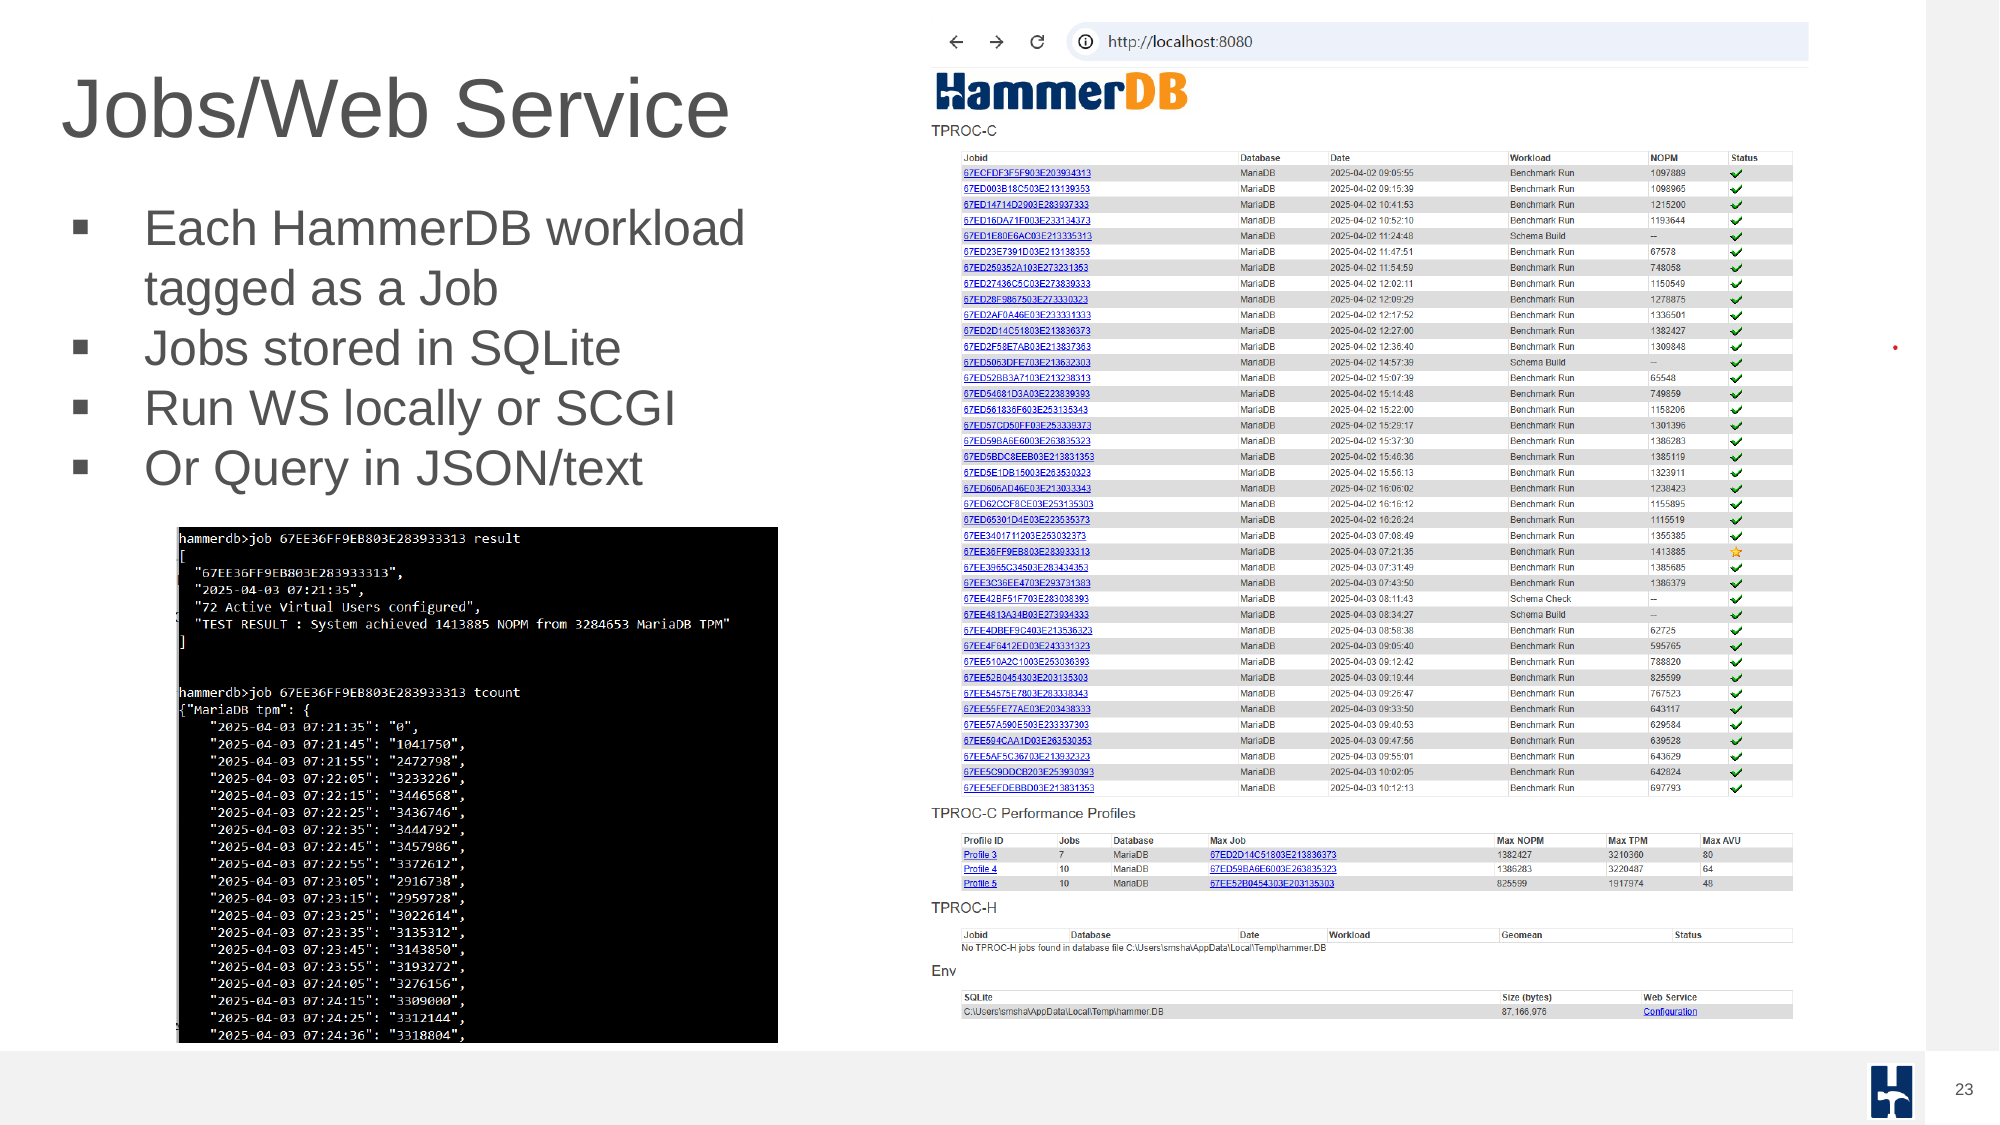
Results are logged to a SQLite database, accessible via GUI or CLI.
A complete command-line test run can be built using Tcl or Python script to define connection and workload parameters and iteratively run performance profiles.
Performance Analysis and Result Interpretation
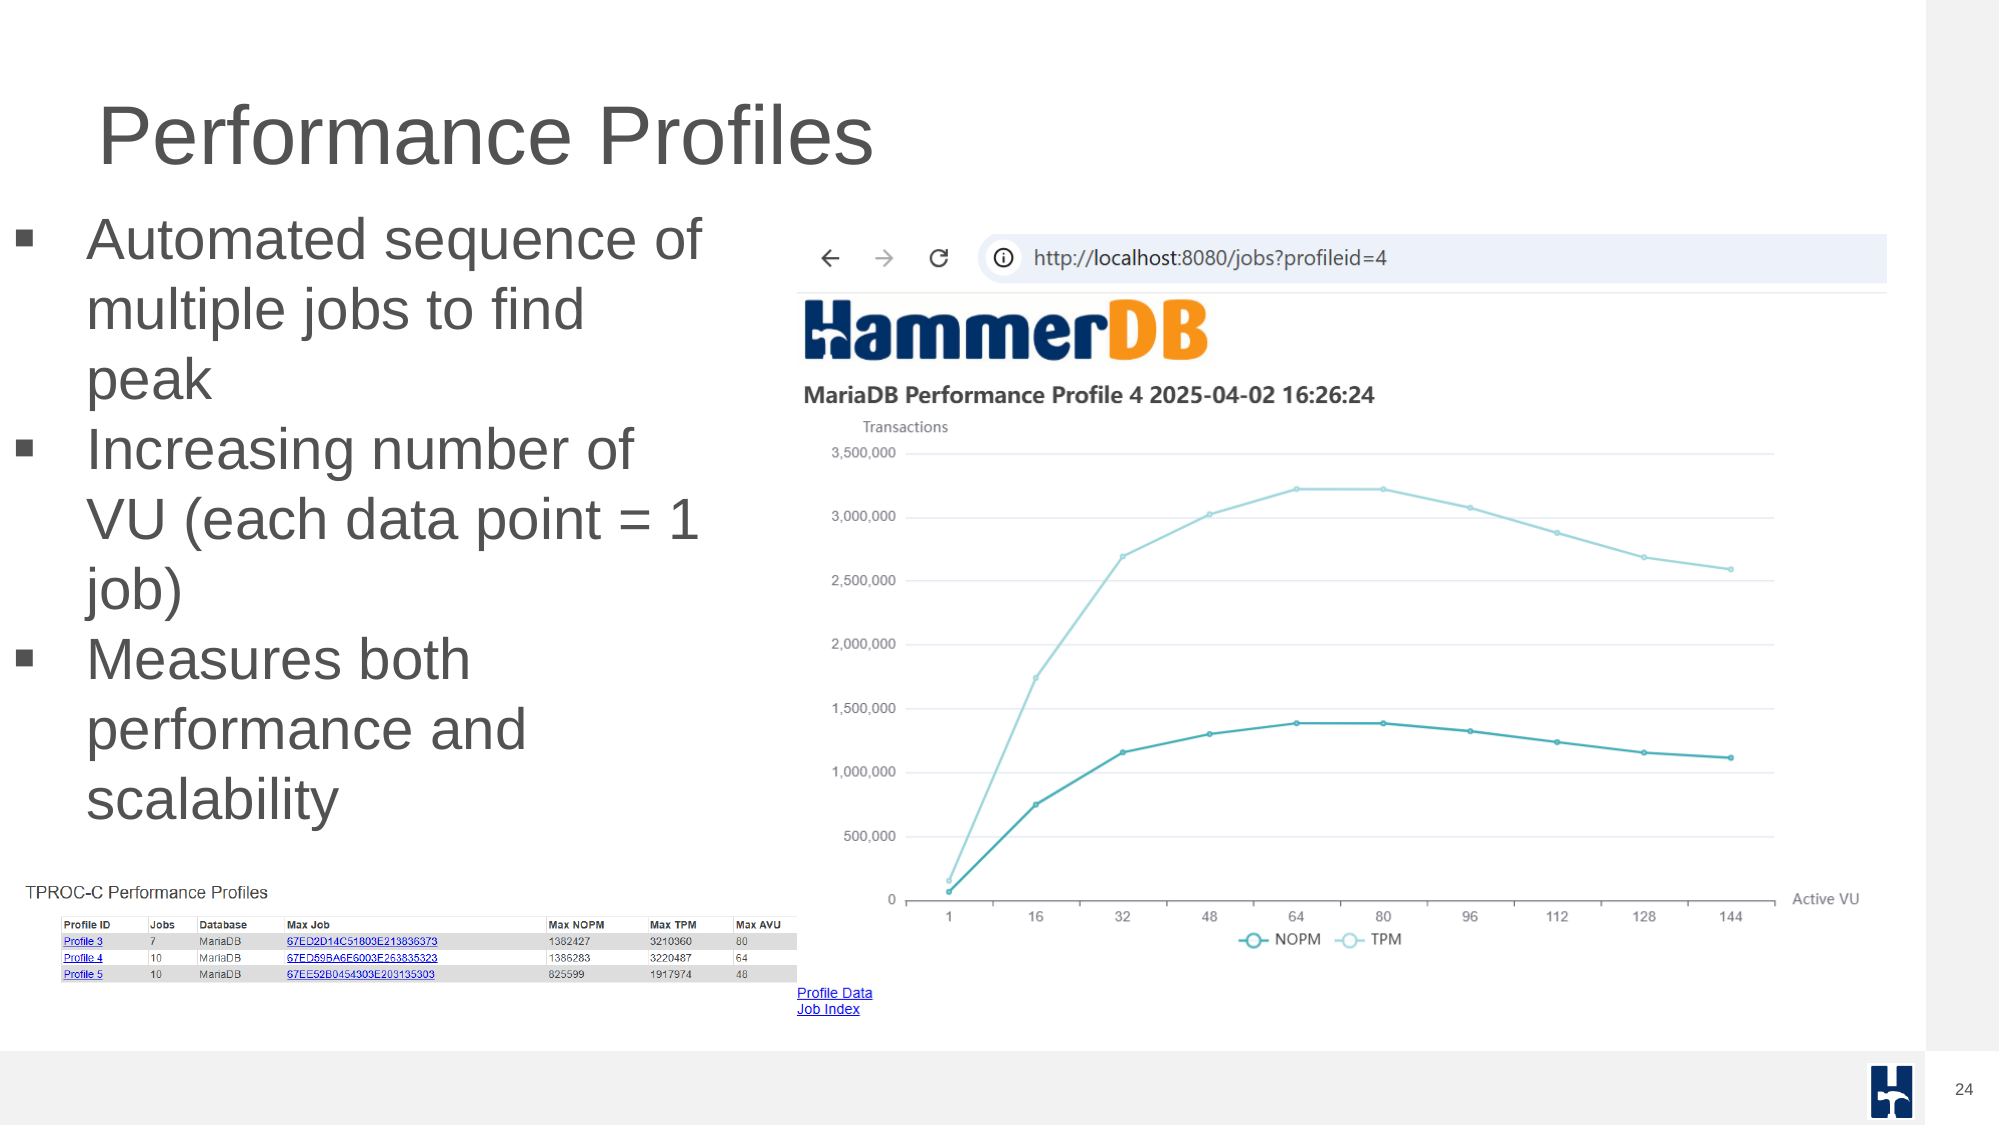
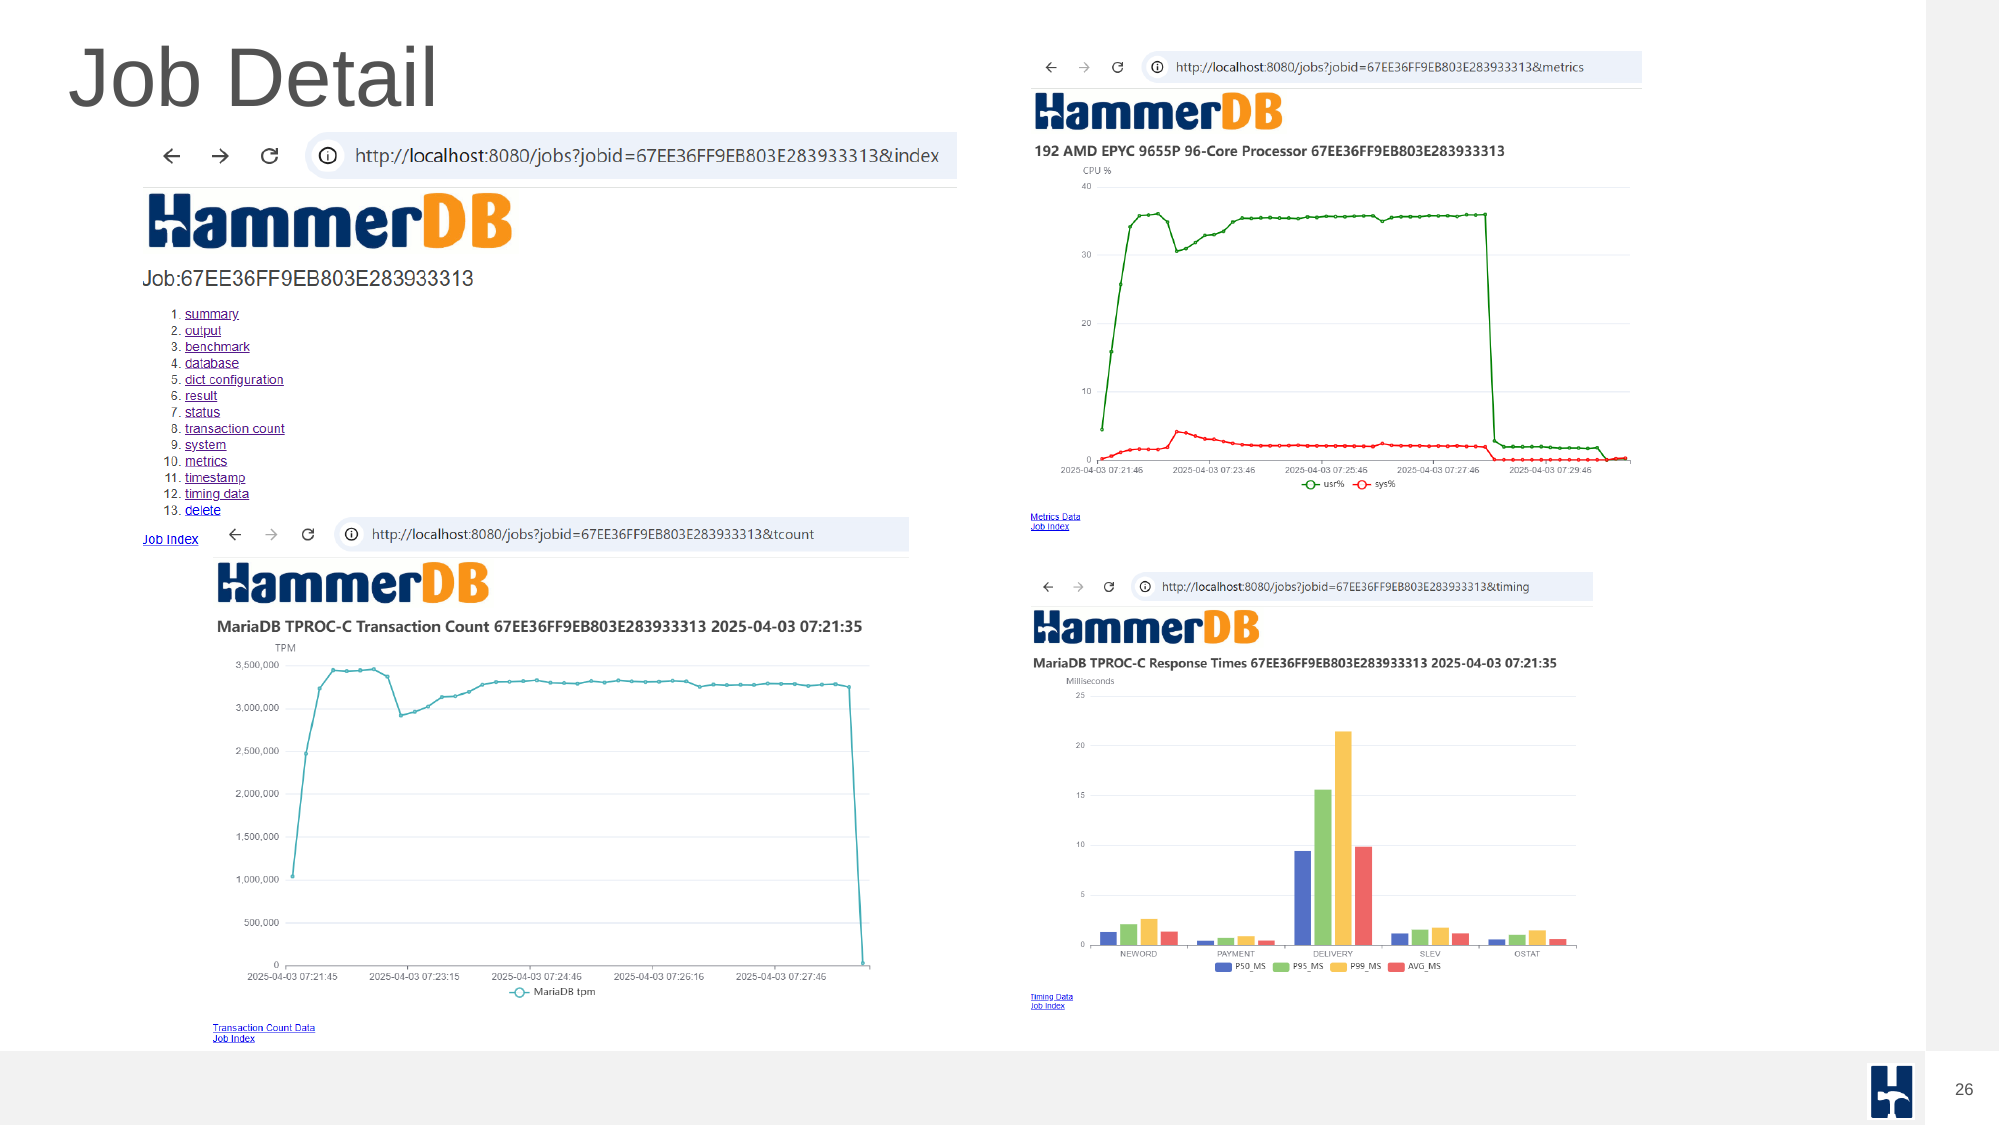
Each benchmark run is recorded as a job in the SQLite repository, enabling traceable, repeatable testing. HammerDB can sequence multiple jobs in an automated profile to discover scalability limits and performance plateaus. This helps expert performance engineers evaluate how well the database handles increasing user loads.
Job summaries and individual run details are available in the UI and exported formats, providing a clear view of performance characteristics.
Arguably, the most common database benchmarking error in OLTP environments is to run a single benchmark test and extrapolate the results to compare databases. This is where the performance profile is key. Automated job sequences increment virtual users to discover peak performance and scalability characteristics. Many database ‘scale’ perform and scale differently on different hardware and what may perform well on one system may not perform well on another. The most important metric is peak performance and advanced users often observe how closely this correlates with physical and logical CPU counts.
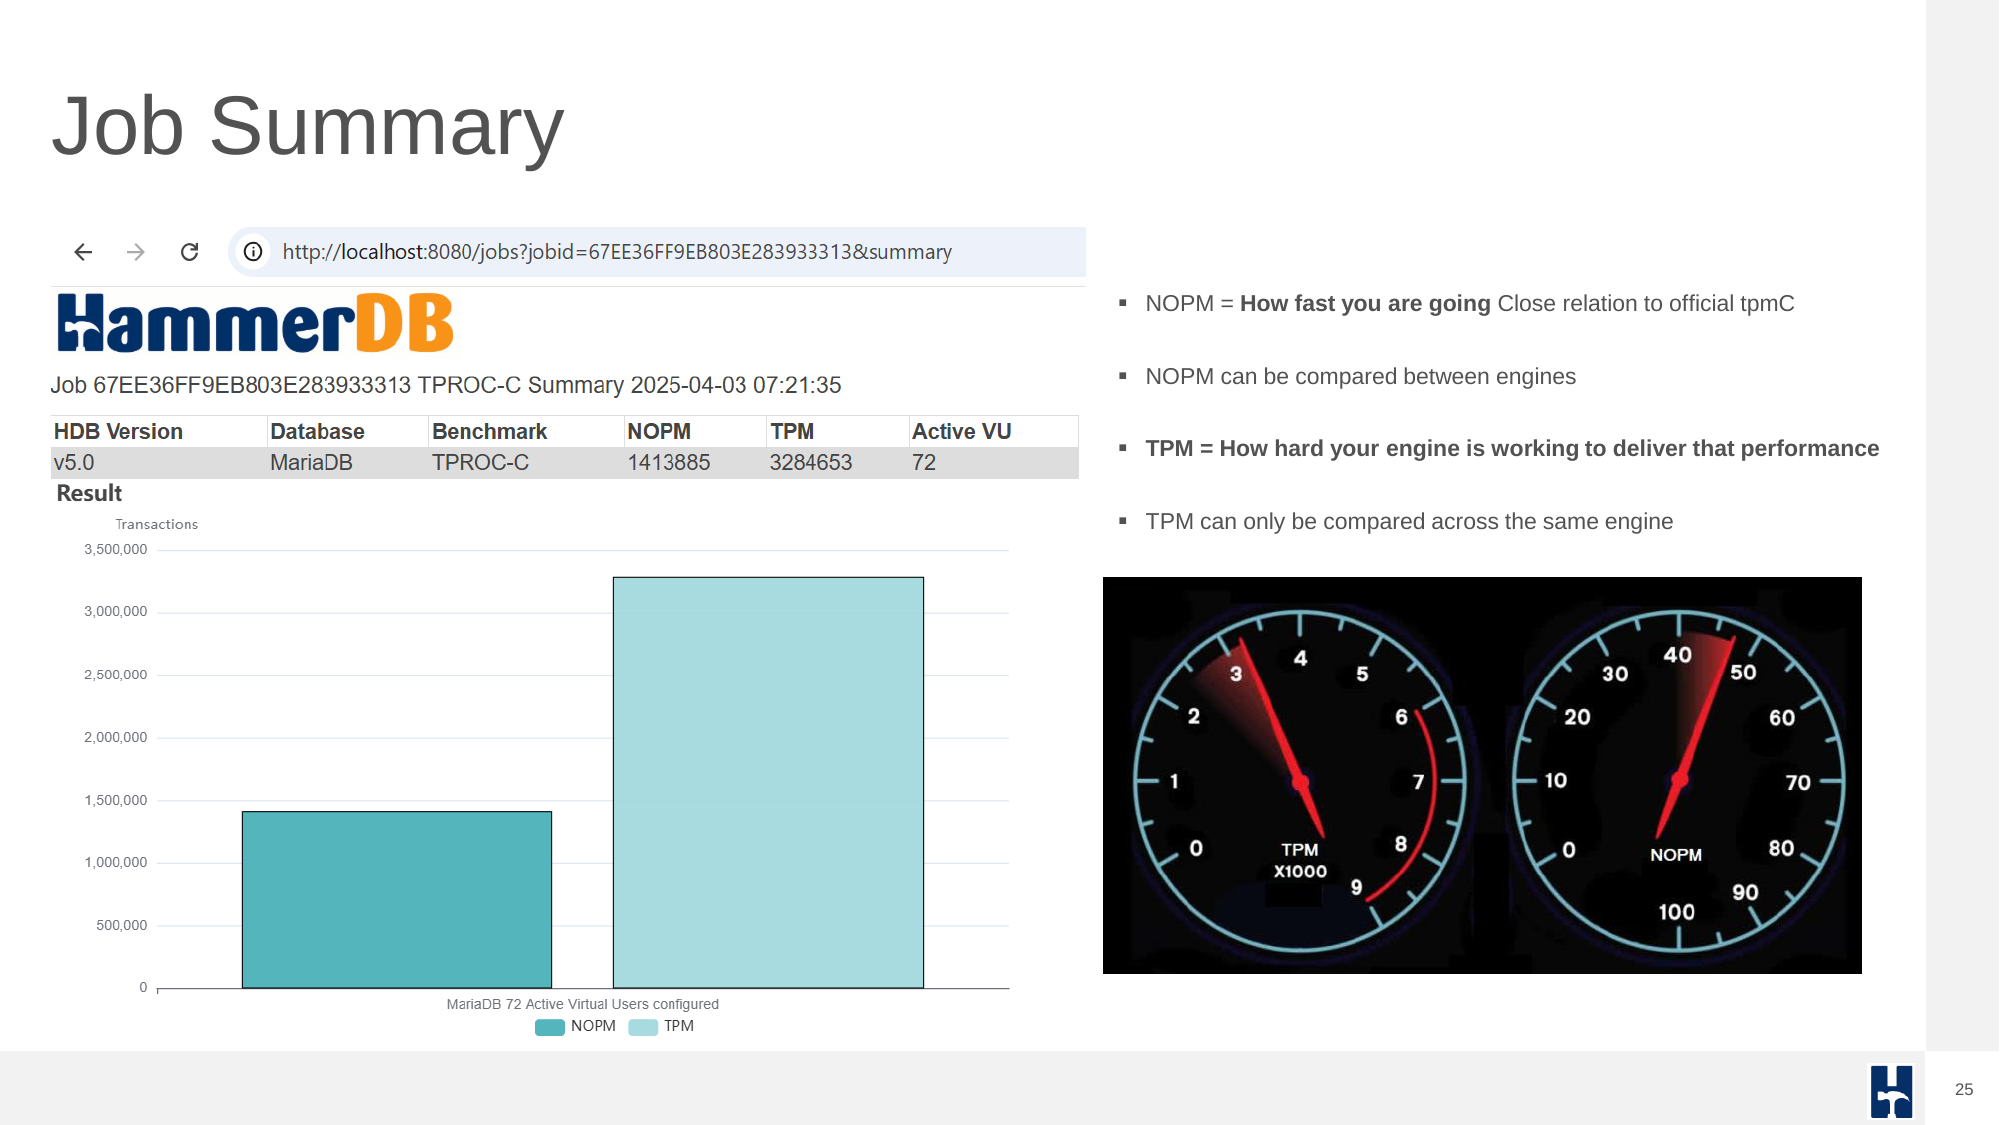
HammerDB reports two main performance indicators:
- NOPM (New Orders Per Minute) comparable across engines, approximates official tpmC scores.
- TPM (Transactions Per Minute) measures internal engine activity, only comparable within the same engine.
Job detail output provides insights into performance at individual run levels for tuning and analysis.
Oracle Workloads and Future Plans
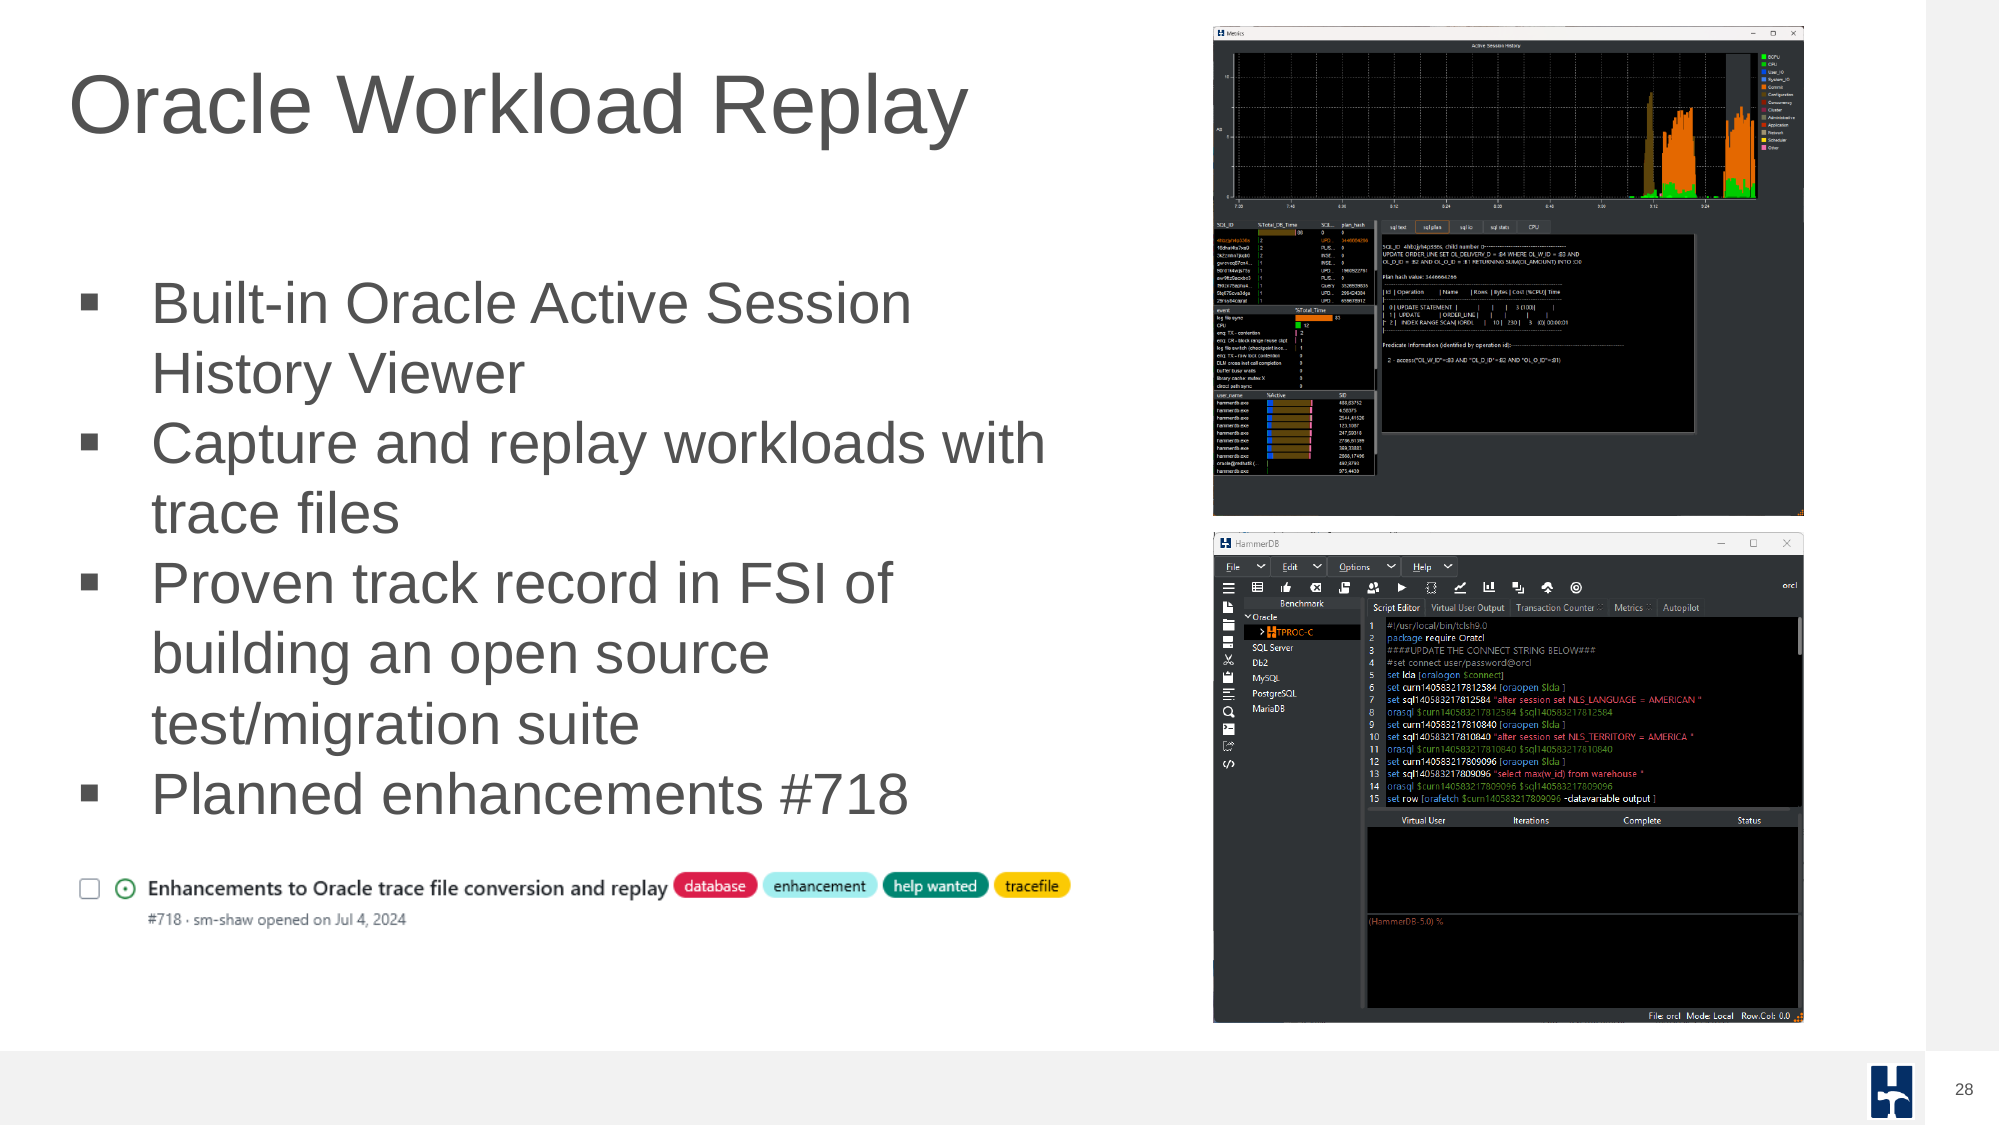
HammerDB continues to expand its capabilities. A key planned enhancement area is the Oracle workload replay feature, whereby Oracle trace files can be converted and run against a database for a bespoke test workload.
HammerDB Oracle functionality also includes an Active Session History (ASH) viewer for monitoring database performance over time. Active Session History is also supported for PostgreSQL.
Final Thoughts: Hardware and Transparency
Database performance is never just about the database engine. Hardware configurations including CPU topology, memory layout, I/O subsystems, and networking play a decisive role and only holistic testing of the entire system with a tool that is proven to scale such as HammerDB can accurately reveal the weak spots.
Lastly, if someone has already performed relevant benchmarks (where permitted) reuse them and contribute your own results back to the community.
HammerDB in the near future plans to support public uploads to the TPC to encourage transparency and shared learning.