
Introducing the PostgreSQL performance metrics viewer
Prior to version 4.3, HammerDB included a graphical performance metrics view for the Oracle database only. At v4.3 HammerDB includes the same functionality for PostgreSQL enabling the user to drill down on database metrics in real time. Additionally, using the Active Session History functionality, it is possible to select a previous time period of statistics in the graph and view the PostgreSQL metrics for this earlier period of time. This enables the user to compare and contrast performance across different benchmark scenarios.
Install pg_stat_statements and pg_sentinel extensions
To use the PostgreSQL graphical metrics, it is necessary to install the pg_stat_statements and pg_sentinel extensions first in the database to be viewed.
This example uses a PostgreSQL source based build with the pg_stat_statements extension found in the contrib directory. Running make and make install in this directory installs the extension.
/postgresql-14.1/contrib/pg_stat_statements$ make
...
make[1]: Entering directory '/opt/postgresql-4.1/src/backend'
gcc -Wall -Wmissing-prototypes -Wpointer-arith -Wdeclaration-after-statement -Werror=vla -Wendif-labels -Wmissing-format-attribute -Wimplicit-fallthrough=3 -Wcast-function-type -Wformat-security -fno-strict-aliasing -fwrapv -fexcess-precision=standard -Wno-format-truncation -Wno-stringop-truncation -O2 -fPIC -shared -o pg_stat_statements.so pg_stat_statements.o -L../../src/port -L../../src/common -Wl,--as-needed -Wl,-rpath,'/opt/postgresql-14.1/lib',--enable-new-dtags -lm
...
./postgresql-14.1/contrib/pg_stat_statements$ make install
...
/usr/bin/install -c -m 644 ./pg_stat_statements--1.4.sql ./pg_stat_statements--1.8--1.9.sql ./pg_stat_statements--1.7--1.8.sql ./pg_stat_statements--1.6--1.7.sql ./pg_stat_statements--1.5--1.6.sql ./pg_stat_statements--1.4--1.5.sql ./pg_stat_statements--1.3--1.4.sql ./pg_stat_statements--1.2--1.3.sql ./pg_stat_statements--1.1--1.2.sql ./pg_stat_statements--1.0--1.1.sql '/opt/postgresql-14.1/share/extension/'
...
To build pgsentinel it is necessary to download it from github and to run make and make install as we did previously for pg_stat_statements.
git clone https://github.com/pgsentinel/pgsentinel.git
cd pgsentinel/src
opt/postgresql-14.1/pgsentinel/src$ make
gcc -Wall -Wmissing-prototypes -Wpointer-arith -Wdeclaration-after-statement -Werror=vla -Wendif-labels -Wmissing-format-attribute -Wimplicit-fallthrough=3 -Wcast-function-type -Wformat-security -fno-strict-aliasing -fwrapv -fexcess-precision=standard -Wno-format-truncation -Wno-stringop-truncation -O2 -fPIC -I. -I./ -I/opt/postgresql-14.1/include/server -I/opt/postgresql-14.1/include/internal -D_GNU_SOURCE -c -o pgsentinel.o pgsentinel.c
/opt/postgresql-4.1/pgsentinel/src$ make install
/bin/mkdir -p '/opt/postgresql-14.1/lib'
...
Add the following example entries to the postgresql.conf
shared_preload_libraries = 'pg_stat_statements,pgsentinel'
track_activity_query_size=2048
pg_stat_statements.save=on
pg_stat_statements.track=all
pgsentinel_pgssh.enable = true
pgsentinel_ash.pull_frequency = 1
pgsentinel_ash.max_entries = 1000000
start the database and then login and create the extensions as follows
postgres=# create extension pg_stat_statements;
CREATE EXTENSION
postgres=# create extension pgsentinel;
CREATE EXTENSION
If the build went according to plan then the pg_active_session_history table will be found.
postgres=# select * from pg_active_session_history;
ash_time | datid | datname | pid | leader_pid | usesysid | usename | applicatio
n_name | client_addr | client_hostname | client_port | backend_start | xact_star
t | query_start | state_change | wait_event_type | wait_event | state | backend_
xid | backend_xmin | top_level_query | query | cmdtype | queryid | backend_type
| blockers | blockerpid | blocker_state
----------+-------+---------+-----+------------+----------+---------+-----------
-------+-------------+-----------------+-------------+---------------+----------
--+-------------+--------------+-----------------+------------+-------+---------
----+--------------+-----------------+-------+---------+---------+--------------
+----------+------------+---------------
(0 rows)
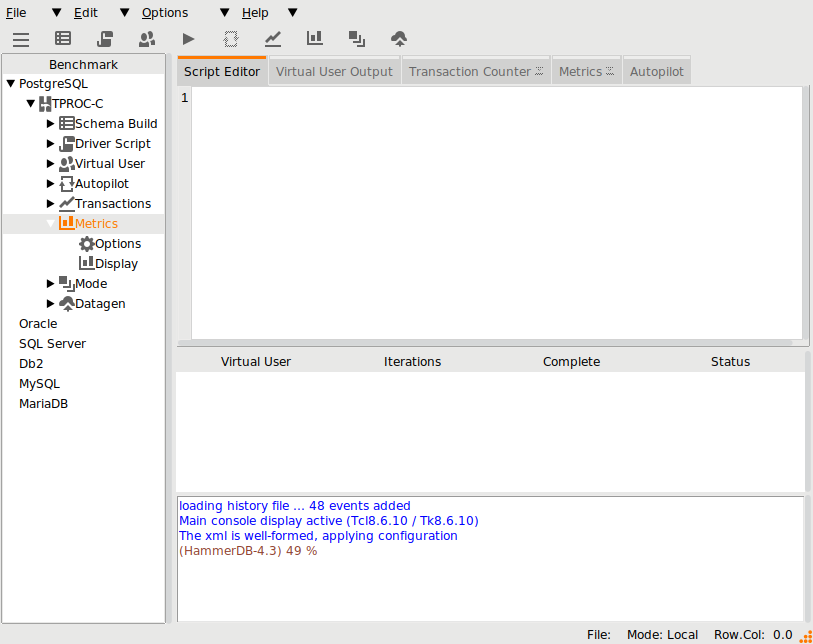
Starting the PostgreSQL Metrics
With the pg_stat_statements and pg_sentinel extensions installed, it is now possible to start the HammerDB graphical metrics to view the Active Session History.
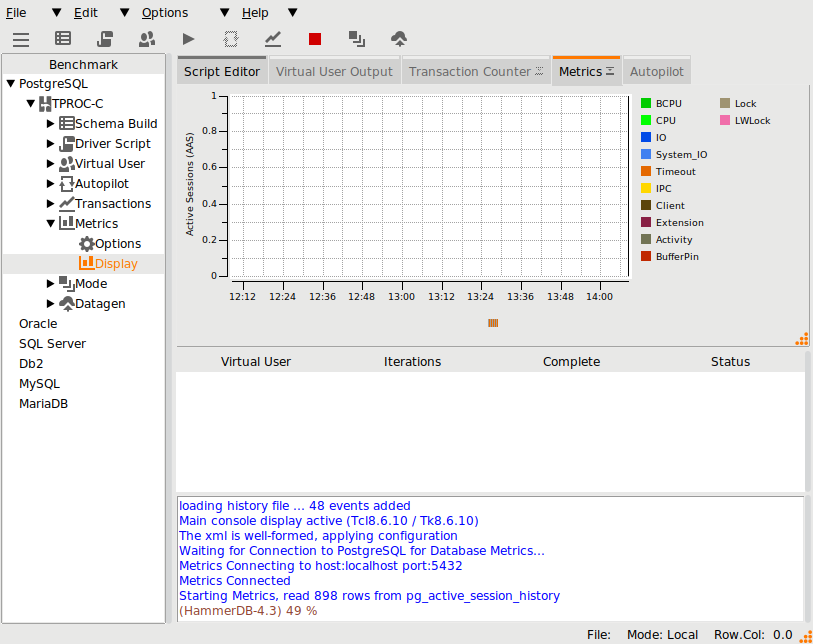
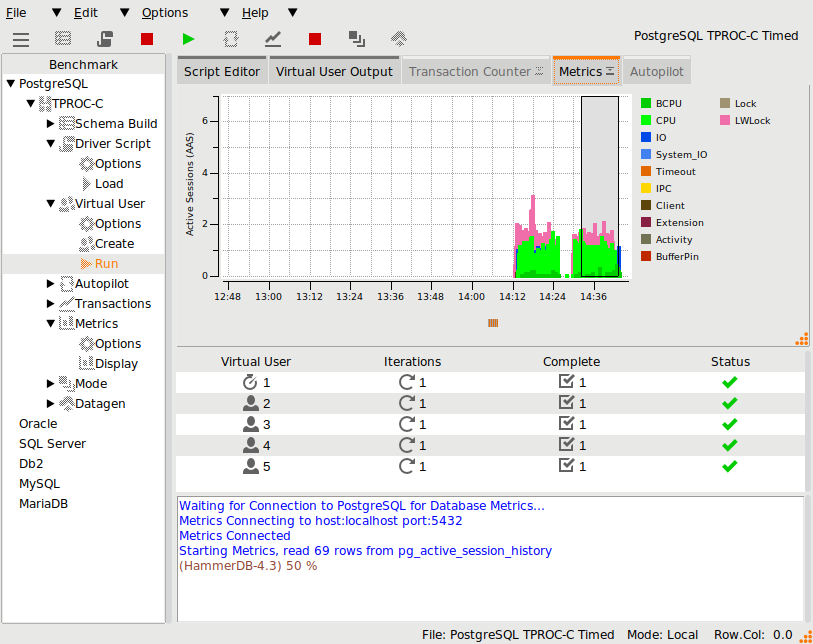
Under the tree view there is the Metrics entry enabling the editing of options and to start the display. Note that if a workload is running and the treeview is locked, it is also possible to access the options from the Options menu and to start the metrics from the Metrics button.
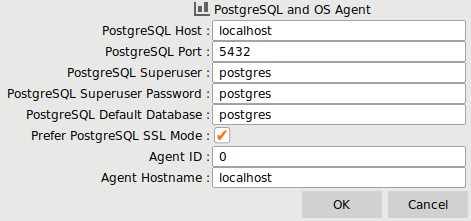
Clicking on options, it shows the login credentials for the PostgreSQL superuser. The Agent ID and Hostname are identical to the metrics option at earlier HammerDB versions, enabling the viewing of CPU performance by connecting to a running agent.
By clicking on the Metrics Display option, HammerDB will connect to the target database and start monitoring the performance, note that if the pg_active_session_history table is empty the viewer will report an error and refuse to start.
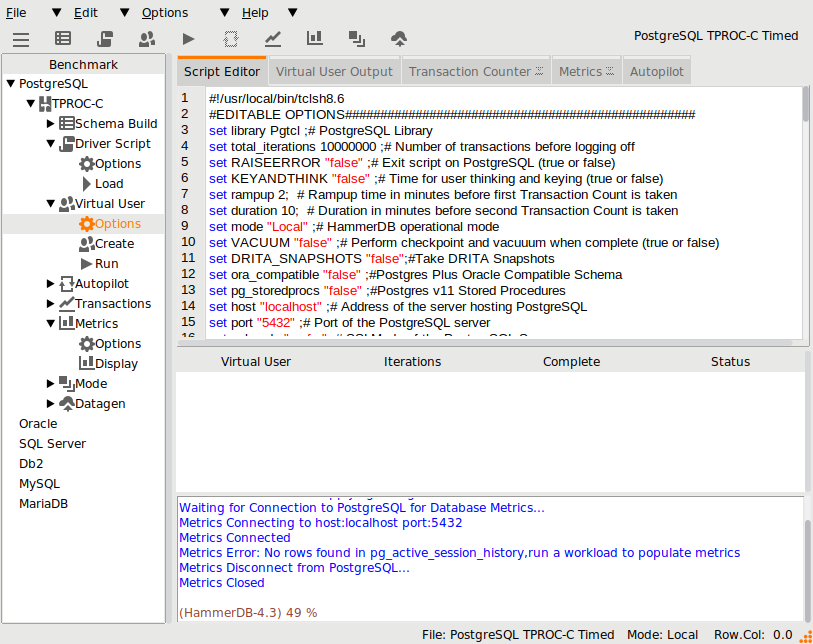
If the pg_active_session_history table is populated (after running or having previously run a workload) the Metrics tab will become activated.
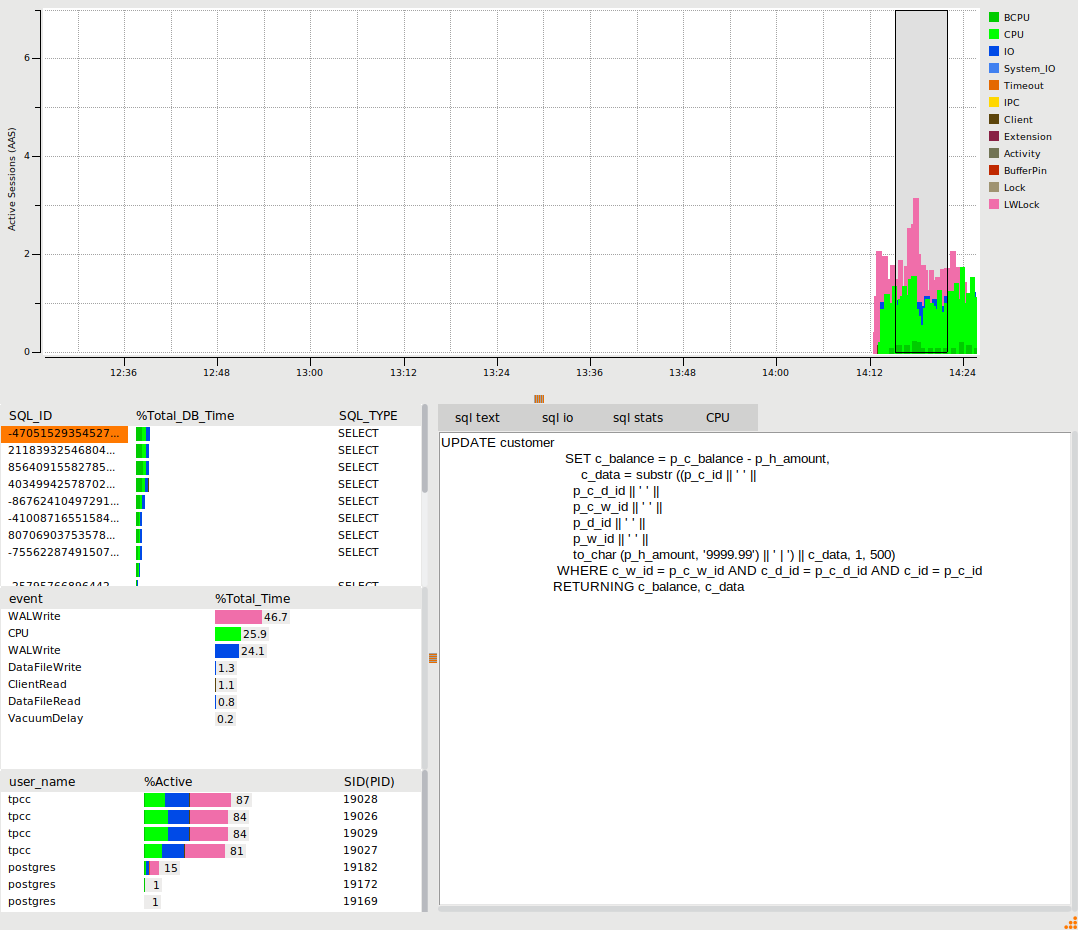
Viewing PostgreSQL Metrics for a HammerDB workload
For full performance details, grab the Metrics tab and pull it out of the HammerDB window to expand.
The example shows a TPROC-C workload running with 4 Active Virtual Users. The example has a configuration set to illustrate a number of wait events and has therefore not been configured for performance.
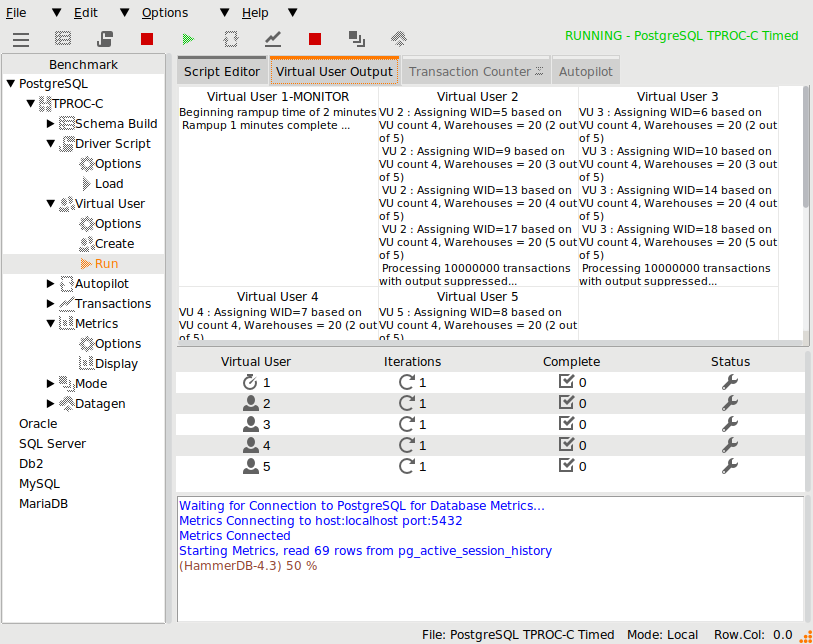
The PostgreSQL performance metrics will automatically start to be populated in the viewer. The options enable the user to drill down on the SQL running in the database, the wait events and the user statistics. The example shows we have 4 users called tpcc running the SQL from the TPROC-C workload with key WALWrite and CPU events. The events are colour coded and indexed in the graph to the wait event groups.
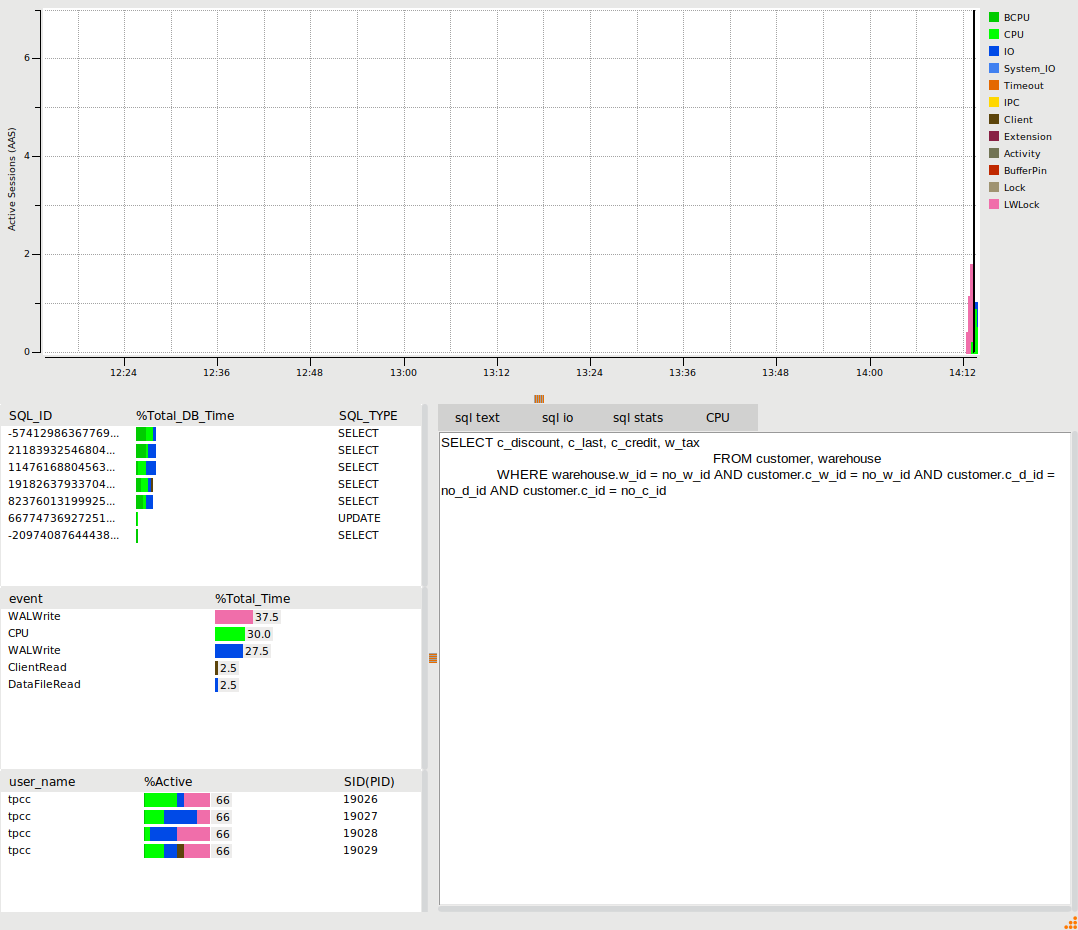
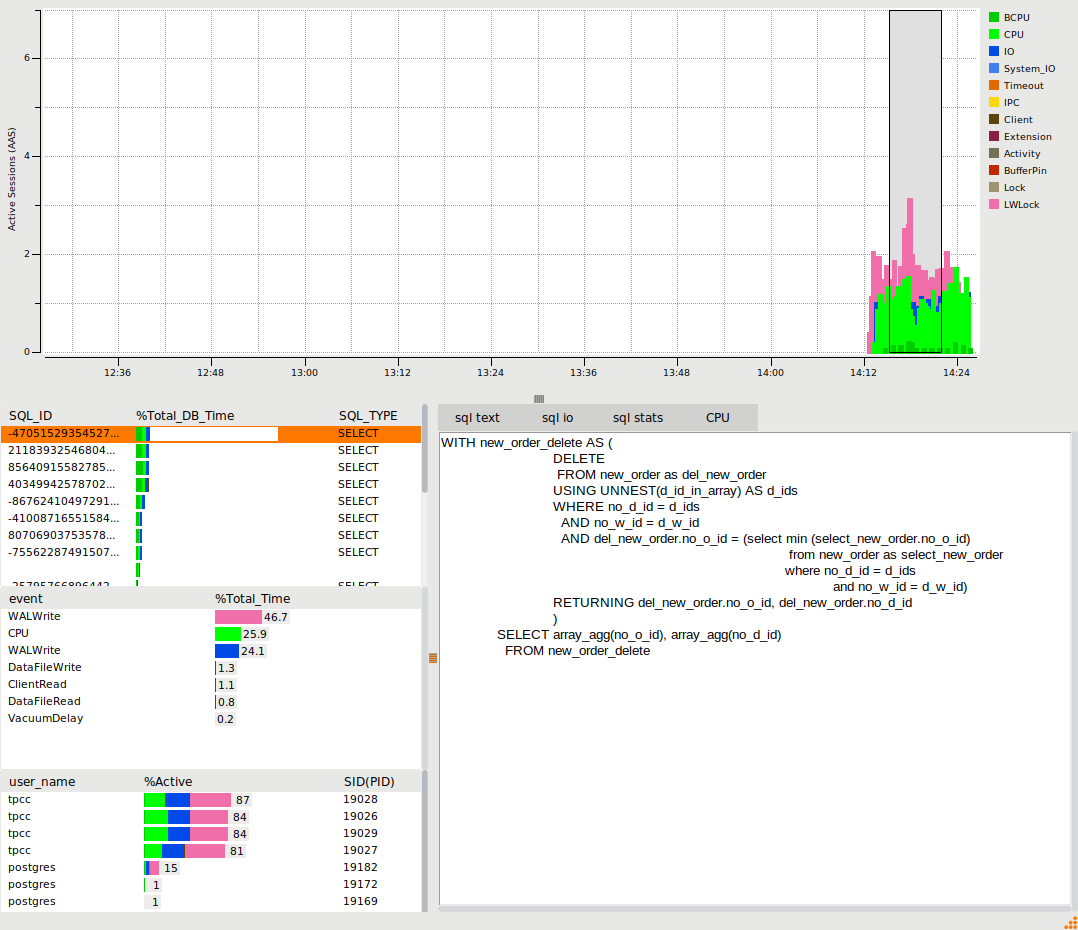
When a benchmark workload has completed, use the selection tool in the graph to select the metrics for a period of time of interest. The viewer will be populated with the metrics for that specific period of time. Clicking on the SQL, events or user will display the output relevant to that selection. The SQL entry gives further options of sql text, io and stats, the wait events show the SQL that caused that wait event and the users show a summary of statistics for that user. The following example shows the SQL view.
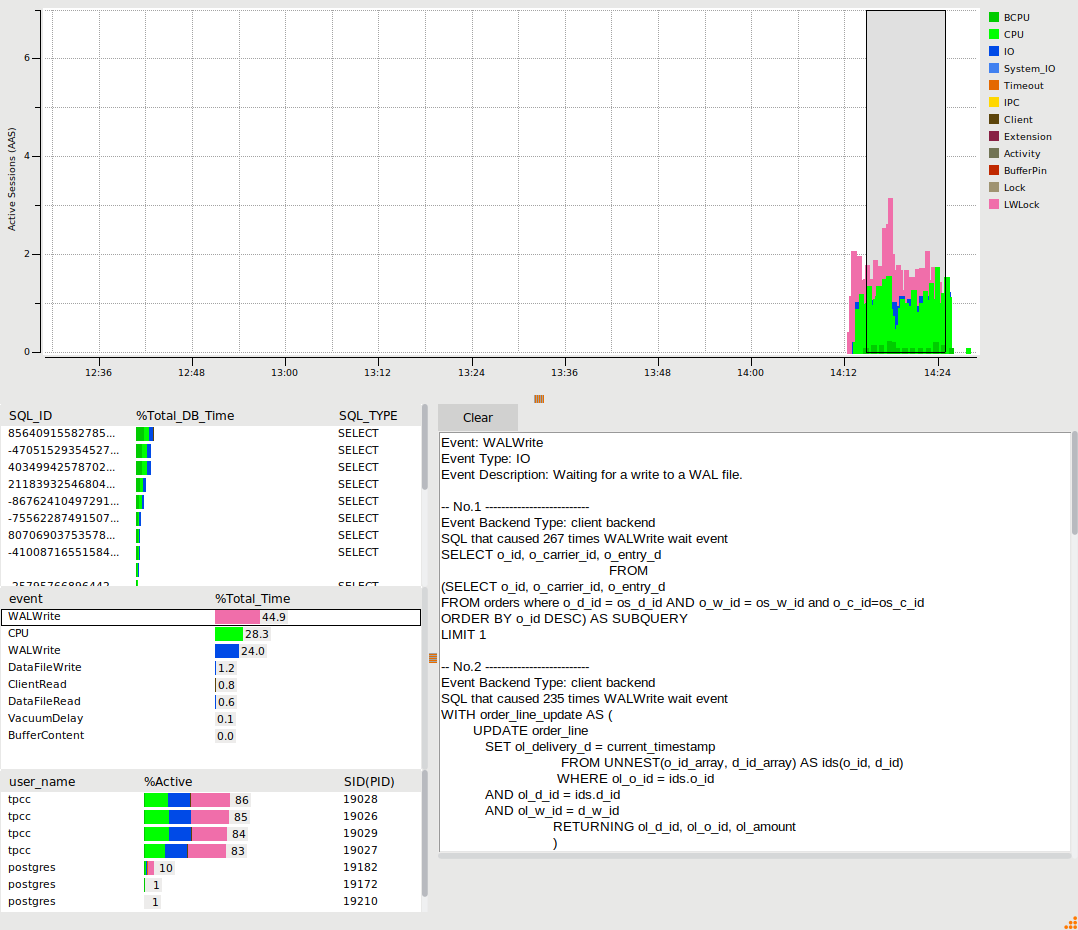
The following example shows the LWLock WalWrite event, illustrating the top SQL that caused that event.
Closing the Window will return it to the main GUI showing the performance graph summary.
Pressing stop on the Metrics button will close the PostgreSQL metrics viewer.
Summary
The HammerDB graphical metrics viewer in v4.3 adds the functionality to view the PostgreSQL active session history for benchmark workloads, enabling the user to find and diagnose bottlenecks in hardware and software configurations in a PostgreSQL environment. Further information on CPU and database metrics can be found in the documentation.