
Feedback from the Community raised the Issue Adding the enhancement for storing and retrieval of HammerDB results and configurations #352 that although HammerDB prints result output interactively and to log files, it would be preferred to have these results stored in a format that could be browsed at a later point. In particular, after a running a test it would be ideal to have a repository where we could verify the configuration of the workload that was run, the results and any timing or transaction count data generated to bring all the log output into a central location. HammerDB v4.6 does this with the “jobs” command.
Jobs Configuration and Storage
The base configuration for the jobs storage can be found in the generic.xml file in the commandline section.
<commandline>
<sqlite_db>TMP</sqlite_db>
<jobsoutput>JSON</jobsoutput>
<jobs_disable>0</jobs_disable>
</commandline>
The default storage location is set to “TMP” where HammerDB will firstly check to see if a TMP or TEMP environment variable has been set and if not find a default temp location and either create a SQLite database called hammer.DB if one does not already exist in this location or open the existing one. For example on Windows an example of opening a new database.
HammerDB CLI v4.6
Copyright (C) 2003-2022 Steve Shaw
Type "help" for a list of commands
Initialized new SQLite on-disk database C:/Users/Hdb/AppData/Local/Temp/hammer.DB
hammerdb>
and on Linux for opening a new database where we have set the TMP environment variable to a new directory called TMP under the HammerDB-4.6 directory.
HammerDB CLI v4.6
Copyright (C) 2003-2022 Steve Shaw
Type "help" for a list of commands
Initialized SQLite on-disk database /home/hdb/HammerDB-4.6/TMP/hammer.DB using existing tables (36,864 KB)
hammerdb>
If for any reason you wish to completely refresh all jobs data it is safe to remove the hammer.DB file and it will be recreated on the next restart. The options for jobs output and disabling jobs can be set at runtime.
An additional option is given in the timeprofile section called xt_job_storage, where if using the xt time profiler it will enable/disable the storage of the time profile data.
<timeprofile>
<profiler>xtprof</profiler>
...
<xt_job_storage>1</xt_job_storage>
</timeprofile>
By default, the jobs storage is disabled in the GUI for v4.6, however advanced users can fully enable it by modifying the following sections in the jobs and xtprof modules respectively with the output from the GUI queryable from the CLI at this release.
proc init_job_tables_gui { } {
#In the GUI, we disable the jobs output even though it works by running the jobs command in the console
 rename jobs {}
 uplevel #0 {proc hdbjobs { args } { return "" }}
#If we want to enable jobs output in the GUI comment out previous 2 lines and uncomment the following line
 #init_job_tables
}

To enable the time profiling in the GUI in the xtprof module update the following:

#If running in the GUI do not try to store output in SQLite
if { [ tsv::exists commandline sqldb ] eq 0 } {
set xtjob_storage 0
}
Disabling Jobs
If the storage of job related data is not desired, then it is possible to disable/enable this feature with the jobs disable command.
hammerdb>jobs disable 1
Disabling jobs repository, restart HammerDB to take effect

hammerdb>jobs disable 0
Enabling jobs repository, restart HammerDB to take effect
If disabled, the SQLite repository database is not opened, and it is not possible to query any jobs related data. Doing so will prompt on how to re-enable the feature. When enabled, the repository will be opened and it will be possible to query the data previously stored.
$ ./hammerdbcli
HammerDB CLI v4.6
Copyright (C) 2003-2022 Steve Shaw
Type "help" for a list of commands
hammerdb>jobs
Error: Jobs Disabled: enable with command "jobs disable 0" and restart HammerDB

$ ./hammerdbcli
HammerDB CLI v4.6
Copyright (C) 2003-2022 Steve Shaw
Type "help" for a list of commands
Initialized SQLite on-disk database /home/steve/HammerDB-4.6/TMP/hammer.DB using existing tables (36,864 KB)
hammerdb>
Creating Jobs and Formatting Output
When enabled, a job will be created with a unique id whenever a workload is run. This happens for both a schema build and running a test.
For example, we will run the following script to build a TPROC-C schema
puts "SETTING CONFIGURATION"
dbset db maria
dbset bm TPC-C

diset connection maria_host localhost
diset connection maria_port 3306
diset connection maria_socket /tmp/mariadb.sock

set vu [ numberOfCPUs ]
set warehouse [ expr {$vu * 5} ]
diset tpcc maria_count_ware $warehouse
diset tpcc maria_num_vu $vu
diset tpcc maria_user root
diset tpcc maria_pass maria
diset tpcc maria_dbase tpcc
diset tpcc maria_storage_engine innodb
if { $warehouse >= 200 } {
diset tpcc maria_partition true
    } else {
diset tpcc maria_partition false
    }
puts "SCHEMA BUILD STARTED"
buildschema
puts "SCHEMA BUILD COMPLETED"
and the following to run a test
puts "SETTING CONFIGURATION"
dbset db maria
dbset bm TPC-C

diset connection maria_host localhost
diset connection maria_port 3306
diset connection maria_socket /tmp/mariadb.sock

diset tpcc maria_user root
diset tpcc maria_pass maria
diset tpcc maria_dbase tpcc
diset tpcc maria_driver timed
diset tpcc maria_rampup 2
diset tpcc maria_duration 5
diset tpcc maria_allwarehouse true
diset tpcc maria_timeprofile true

loadscript
puts "TEST STARTED"
vuset vu vcpu
vucreate
tcstart
tcstatus
set jobid [ vurun ]
vudestroy
tcstop
puts "TEST COMPLETE"
After running the scripts using the jobs command we can now see that we have created 2 jobs. One for building the schema and one for running the test as expected.
hammerdb>jobs
[
  "6388A0385EEC03E263531353",
  "6388A1585EEC03E243839333"
]
For querying a build, the status command will show whether all Virtual Users started and finished successfully, allowing a quick way to check the status of a build.
hammerdb>job 6388A0385EEC03E263531353 status
[
  "0",
  "Ready to create a 20 Warehouse MariaDB TPROC-C schema\nin host LOCALHOST:\/TMP\/MARIADB.SOCK under user ROOT in database TPCC with storage engine INNODB?",
  "0",
  "Vuser 1:RUNNING",
  "0",
  "Vuser 2:RUNNING",
  "0",
  "Vuser 3:RUNNING",
  "0",
  "Vuser 4:RUNNING",
  "0",
  "Vuser 5:RUNNING",
  "0",
  "Vuser 2:FINISHED SUCCESS",
  "0",
  "Vuser 3:FINISHED SUCCESS",
  "0",
  "Vuser 5:FINISHED SUCCESS",
  "0",
  "Vuser 4:FINISHED SUCCESS",
  "0",
  "Vuser 1:FINISHED SUCCESS",
  "0",
  "ALL VIRTUAL USERS COMPLETE"
]
For formatting output, there is the option of converting the output to JSON or outputting text which is done with the jobs format command.
hammerdb>job format JSON
Setting jobs output format to json

hammerdb>jobs format text
Setting jobs output format to text
In the following example, we verify more details about the build by querying the output of Virtual User 1, we can see that it monitored all of the Virtual Users to load the data correctly and created the stored procedures and gathered statistics, so we can be sure that the schema build was fully complete.
hammerdb>job 6388A0385EEC03E263531353 1
Virtual User 1: Monitor Thread
Virtual User 1: CREATING TPCC SCHEMA
Virtual User 1: Ssl_cipher {}
Virtual User 1: CREATING DATABASE tpcc
Virtual User 1: CREATING TPCC TABLES
Virtual User 1: Loading Item
Virtual User 1: Loading Items - 50000
Virtual User 1: Loading Items - 100000
Virtual User 1: Item done
Virtual User 1: Monitoring Workers...
Virtual User 1: Workers: 4 Active 0 Done
Virtual User 1: Workers: 0 Active 4 Done
Virtual User 1: CREATING TPCC STORED PROCEDURES
Virtual User 1: GATHERING SCHEMA STATISTICS
Virtual User 1: TPCC SCHEMA COMPLETE
Querying Job Output
As we ran a workload we can now query the configuration of HammerDB when the job was run, in the example we query the database, benchmark, timestamp for the job and the dict at the time it was run.
hammerdb>job 6388A1585EEC03E243839333 db
["MariaDB"]

hammerdb>job 6388A1585EEC03E243839333 bm
["TPC-C"]

hammerdb>job 6388A1585EEC03E243839333 timestamp
6388A1585EEC03E243839333 {2022-12-01 12:43:04}

hammerdb>job 6388A1585EEC03E243839333 dict
{
  "connection": {
    "maria_host": "localhost",
    "maria_port": "3306",
    "maria_socket": "\/tmp\/mariadb.sock",
    "maria_ssl": "false",
    "maria_ssl_two_way": "false",
    "maria_ssl_linux_capath": "\/etc\/mysql\/certs",
    "maria_ssl_windows_capath": "C:\\mysql\\certs",
    "maria_ssl_ca": "ca-cert.pem",
    "maria_ssl_cert": "client-cert.pem",
    "maria_ssl_key": "client-key.pem",
    "maria_ssl_cipher": "server"
  },
  "tpcc": {
    "maria_count_ware": "20",
    "maria_num_vu": "4",
    "maria_user": "root",
    "maria_pass": "maria",
    "maria_dbase": "tpcc",
    "maria_storage_engine": "innodb",
    "maria_partition": "false",
    "maria_prepared": "false",
    "maria_total_iterations": "10000000",
    "maria_raiseerror": "false",
    "maria_keyandthink": "false",
    "maria_driver": "timed",
    "maria_rampup": "2",
    "maria_duration": "5",
    "maria_allwarehouse": "true",
    "maria_timeprofile": "true",
    "maria_async_scale": "false",
    "maria_async_client": "10",
    "maria_async_verbose": "false",
    "maria_async_delay": "1000",
    "maria_connect_pool": "false"
  }
}
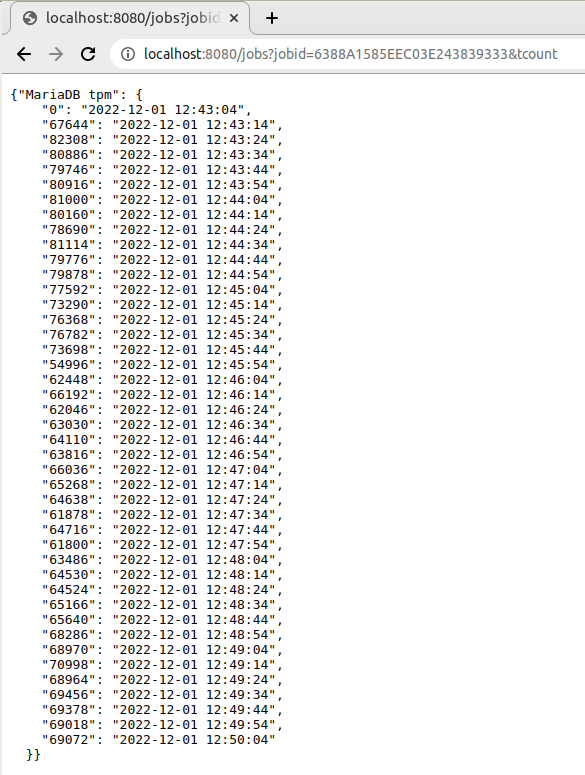
We can also query the job result, the transaction count and the captured xtprof timings. By default the summary timings are reported, however by adding the vuid you can also drill down into the timings for a specific virtual user.
hammerdb>job 6388A1585EEC03E243839333 result
[
  "6388A1585EEC03E243839333",
  "2022-12-01 12:43:04",
  "4 Active Virtual Users configured",
  "TEST RESULT : System achieved 28564 NOPM from 66576 MariaDB TPM"
]

hammerdb>job 6388A1585EEC03E243839333 tcount
{"MariaDB tpm": {
    "0": "2022-12-01 12:43:04",
    "67644": "2022-12-01 12:43:14",
    "82308": "2022-12-01 12:43:24",
    "80886": "2022-12-01 12:43:34",
    "79746": "2022-12-01 12:43:44",
    "80916": "2022-12-01 12:43:54",
    "81000": "2022-12-01 12:44:04",
    "80160": "2022-12-01 12:44:14",
    "78690": "2022-12-01 12:44:24",
    "81114": "2022-12-01 12:44:34",
    "79776": "2022-12-01 12:44:44",
    "79878": "2022-12-01 12:44:54",
    "77592": "2022-12-01 12:45:04",
    "73290": "2022-12-01 12:45:14",
    "76368": "2022-12-01 12:45:24",
    "76782": "2022-12-01 12:45:34",
    "73698": "2022-12-01 12:45:44",
    "54996": "2022-12-01 12:45:54",
    "62448": "2022-12-01 12:46:04",
    "66192": "2022-12-01 12:46:14",
    "62046": "2022-12-01 12:46:24",
    "63030": "2022-12-01 12:46:34",
    "64110": "2022-12-01 12:46:44",
    "63816": "2022-12-01 12:46:54",
    "66036": "2022-12-01 12:47:04",
    "65268": "2022-12-01 12:47:14",
    "64638": "2022-12-01 12:47:24",
    "61878": "2022-12-01 12:47:34",
    "64716": "2022-12-01 12:47:44",
    "61800": "2022-12-01 12:47:54",
    "63486": "2022-12-01 12:48:04",
    "64530": "2022-12-01 12:48:14",
    "64524": "2022-12-01 12:48:24",
    "65166": "2022-12-01 12:48:34",
    "65640": "2022-12-01 12:48:44",
    "68286": "2022-12-01 12:48:54",
    "68970": "2022-12-01 12:49:04",
    "70998": "2022-12-01 12:49:14",
    "68964": "2022-12-01 12:49:24",
    "69456": "2022-12-01 12:49:34",
    "69378": "2022-12-01 12:49:44",
    "69018": "2022-12-01 12:49:54",
    "69072": "2022-12-01 12:50:04"
  }}

hammerdb>job 6388A1585EEC03E243839333 timing
{
  "NEWORD": {
    "elapsed_ms": "420522.5",
    "calls": "53829",
    "min_ms": "1.284",
    "avg_ms": "4.239",
    "max_ms": "187.509",
    "total_ms": "228207.349",
    "p99_ms": "14.224",
    "p95_ms": "6.92",
    "p50_ms": "3.846",
    "sd": "3409.688",
    "ratio_pct": "54.213"
  },
  "PAYMENT": {
    "elapsed_ms": "420522.5",
    "calls": "53889",
    "min_ms": "0.612",
    "avg_ms": "1.685",
    "max_ms": "193.093",
    "total_ms": "90797.186",
    "p99_ms": "6.48",
    "p95_ms": "3.134",
    "p50_ms": "1.434",
    "sd": "1893.599",
    "ratio_pct": "21.57"
  },
  "DELIVERY": {
    "elapsed_ms": "420522.5",
    "calls": "5321",
    "min_ms": "5.065",
    "avg_ms": "13.447",
    "max_ms": "250.596",
    "total_ms": "71553.841",
    "p99_ms": "85.008",
    "p95_ms": "30.665",
    "p50_ms": "9.919",
    "sd": "15320.906",
    "ratio_pct": "16.998"
  },
  "OSTAT": {
    "elapsed_ms": "420522.5",
    "calls": "5472",
    "min_ms": "0.413",
    "avg_ms": "2.232",
    "max_ms": "127.654",
    "total_ms": "12215.15",
    "p99_ms": "34.898",
    "p95_ms": "4.028",
    "p50_ms": "1.155",
    "sd": "6872.841",
    "ratio_pct": "2.902"
  },
  "SLEV": {
    "elapsed_ms": "420522.5",
    "calls": "5393",
    "min_ms": "0.903",
    "avg_ms": "1.932",
    "max_ms": "30.993",
    "total_ms": "10419.8",
    "p99_ms": "6.303",
    "p95_ms": "3.094",
    "p50_ms": "1.706",
    "sd": "1177.113",
    "ratio_pct": "2.475"
  }
}
For a TPROC-H workload, we can query the output of the individual Virtual Users to capture the query times.
hammerdb>job 6388A4F05EEC03E233931323 1
[
  "1",
  "Ssl_cipher {}",
  "1",
  "Executing Query 14 (1 of 22)",
  "1",
  "query 14 completed in 16.743 seconds",
  "1",
  "Executing Query 2 (2 of 22)",
  "1",
  "query 2 completed in 0.719 seconds",
  "1",
  "Executing Query 9 (3 of 22)",
  "1",
  "query 9 completed in 5.79 seconds",
  "1",
  "Executing Query 20 (4 of 22)",
  "1",
  "query 20 completed in 0.299 seconds",
  "1",
  "Executing Query 6 (5 of 22)",
  "1",
  "query 6 completed in 1.932 seconds",
  "1",
  "Executing Query 17 (6 of 22)",
  "1",
  "query 17 completed in 0.103 seconds",
  "1",
  "Executing Query 18 (7 of 22)",
  "1",
  "query 18 completed in 5.682 seconds",
  "1",
  "Executing Query 8 (8 of 22)",
  "1",
  "query 8 completed in 1.99 seconds",
  "1",
  "Executing Query 21 (9 of 22)",
  "1",
  "query 21 completed in 9.813 seconds",
  "1",
  "Executing Query 13 (10 of 22)",
  "1",
  "query 13 completed in 4.022 seconds",
  "1",
  "Executing Query 3 (11 of 22)",
  "1",
  "query 3 completed in 1.451 seconds",
  "1",
  "Executing Query 22 (12 of 22)",
  "1",
  "query 22 completed in 0.116 seconds",
  "1",
  "Executing Query 16 (13 of 22)",
  "1",
  "query 16 completed in 0.276 seconds",
  "1",
  "Executing Query 4 (14 of 22)",
  "1",
  "query 4 completed in 0.631 seconds",
  "1",
  "Executing Query 11 (15 of 22)",
  "1",
  "query 11 completed in 0.196 seconds",
  "1",
  "Executing Query 15 (16 of 22)",
  "1",
  "query 15 completed in 4.406 seconds",
  "1",
  "Executing Query 1 (17 of 22)",
  "1",
  "query 1 completed in 10.899 seconds",
  "1",
  "Executing Query 10 (18 of 22)",
  "1",
  "query 10 completed in 4.585 seconds",
  "1",
  "Executing Query 19 (19 of 22)",
  "1",
  "query 19 completed in 0.127 seconds",
  "1",
  "Executing Query 5 (20 of 22)",
  "1",
  "query 5 completed in 1.258 seconds",
  "1",
  "Executing Query 7 (21 of 22)",
  "1",
  "query 7 completed in 0.948 seconds",
  "1",
  "Executing Query 12 (22 of 22)",
  "1",
  "query 12 completed in 5.403 seconds",
  "1",
  "Completed 1 query set(s) in 78 seconds",
  "1",
  "Geometric mean of query times returning rows (21) is \"1.33547\""
]
Deleting Jobs
When the data related to a job is no loger required it can be deleted with the jobs delete command.
hammerdb>jobs
[
  "6388A0385EEC03E263531353",
  "6388A1585EEC03E243839333",
  "6388A3035EEC03E243830373",
  "6388A4F05EEC03E233931323"
]


hammerdb>job 6388A0385EEC03E263531353 delete
Deleted Jobid 6388A0385EEC03E263531353


hammerdb>job 6388A3035EEC03E243830373 delete
Deleted Jobid 6388A3035EEC03E243830373


hammerdb>jobs
[
  "6388A1585EEC03E243839333",
  "6388A4F05EEC03E233931323"
]
Job Web Service
HammerDB CLI jobs are also compatible with the HammerDB Web Service command allowing the querying of the jobs output over HTTP. It is planned to enhance this webservice to provide an interactive to more easily visualise and analyse job data.
Summary
The HammerDB jobs interface has been added to provide a central repository stored in a SQLite database where all output and configuration related to a workload is stored for ease of querying at a later point. The jobs interface provides a foundation for future development to provide more comprehensive insight into job related data.