The most popular interface to HammerDB is using the GUI, however demand for running HammerDB workloads in environments without GUI interfaces led to the development of the CLI. From v3.2 cloud based usage led to the development of a HammerDB HTTP based web service interface with output data stored in a SQLite database repository. From v4.3 this web interface has been enhanced to add command line functionality to the service as well as extending the ability to query the database of configuration, results and timing data to be returned in JSON format, enabling a long-term repository of HammerDB benchmark data for integrating HammerDB into service based cloud environments.
Configuring and starting the Webservice
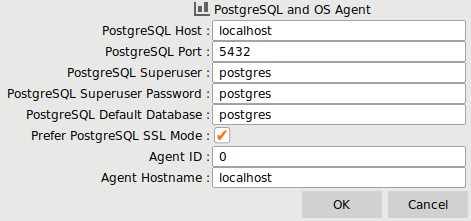
The webservice configuration is set in the generic.xml file in the config directory. ws_port defines on which port to start the HTTP service, whilst sqlite_db sets the location of the SQLite repository database. The default value of TMP allows HammerDB to find a suitable temp directory in which to store the database. if :memory: is given an in-memory database will be used, however some functionality such as the storing of timing data is not available (because multiple threads cannot open the same in-memory database).
<webservice>
<ws_port>8080</ws_port>
<sqlite_db>TMP</sqlite_db>
</webservice>
To start hammerdb run the ./hammerdbws command on Linux or hammerdbws.bat on Windows.
./hammerdbws
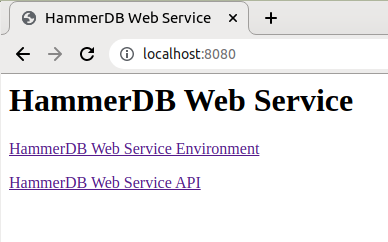
Navigating to the defined port will show the Web Service interface, and clicking on the API link will return the available commands.
In addition to the HTTP interface, the web service interface also provides a CLI interface to the service. This CLI interface translates the existing CLI commands to call the HTTP API whilst translating the output to JSON format. At v4.3 the web service CLI supports all commands support by the standard CLI except for primary/replica features meaning switchmode and steprun are not available.
The web service CLI means that direct HTTP calls and CLI commands can be mixed whilst storing all output in the SQLite repository for querying at a later time.
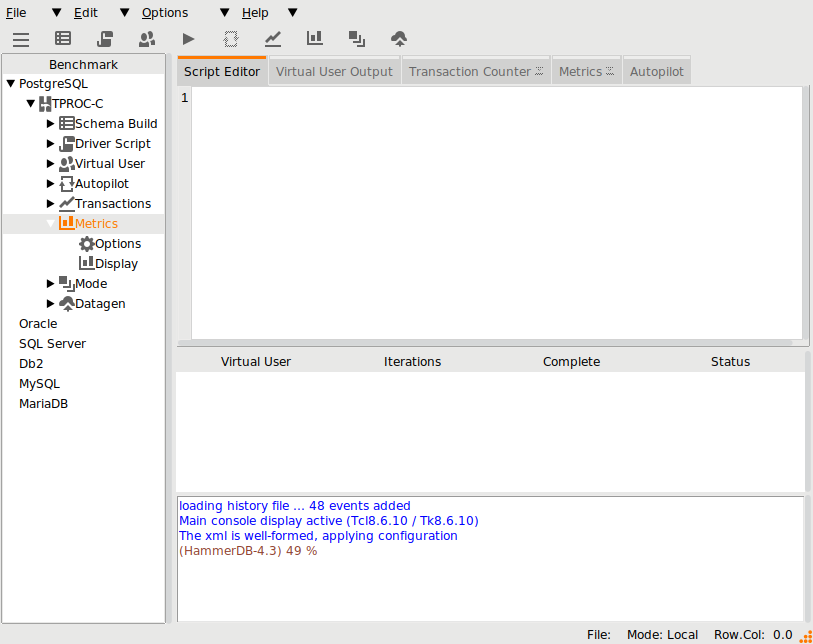
Running a schema build
The following PostgreSQL build script will run in both the standard and web service CLI.
dbset db pg
dbset bm TPC-C
diset tpcc pg_count_ware 20
diset tpcc pg_num_vu 4
diset tpcc pg_superuser postgres
diset tpcc pg_superuserpass postgres
buildschema
Running in the web service CLI we can see that the command output is returned to the user, however the virtual user output is no longer returned and instead a jobid is given.
./hammerdbws
HammerDB Web Service v4.3
Copyright (C) 2003-2021 Steve Shaw
Type "help" for a list of commands
The xml is well-formed, applying configuration
Initialized new SQLite on-disk database /tmp/hammer.DB
Starting HammerDB Web Service on port 8080
Listening for HTTP requests on TCP port 8080
hammerws>source pgbuild.tcl
{"success": {"message": "Database set to PostgreSQL"}}
{"success": {"message": "Benchmark set to TPC-C for PostgreSQL"}}
{"success": {"message": "Changed tpcc:pg_count_ware from 1 to 20 for PostgreSQL"}}
{"success": {"message": "Changed tpcc:pg_num_vu from 1 to 4 for PostgreSQL"}}
{"success": {"message": "Value postgres for tpcc:pg_superuserpass is the same as existing value postgres, no change made"}}
{"success": {"message": "Building 20 Warehouses with 5 Virtual Users, 4 active + 1 Monitor VU(dict value pg_num_vu is set to 4): JOBID=619CF6B05D1703E263931333"}}
The jobids can be queried directly over HTTP
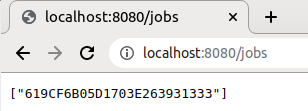
and also for example the status of the current job.
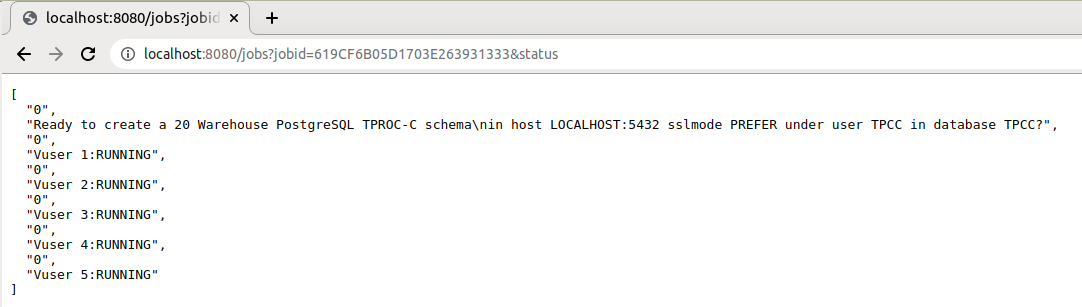
This same output is available at the CLI prompt using the jobs command.
hammerws>jobs
["619CF6B05D1703E263931333"]

hammerws>jobs 619CF6B05D1703E263931333 status
[
"0",
"Ready to create a 20 Warehouse PostgreSQL TPROC-C schema\nin host LOCALHOST:5432 sslmode PREFER under user TPCC in database TPCC?",
"0",
"Vuser 1:RUNNING",
"0",
"Vuser 2:RUNNING",
"0",
"Vuser 3:RUNNING",
"0",
"Vuser 4:RUNNING",
"0",
"Vuser 5:RUNNING"
]

hammerws>jobs 619CF6B05D1703E263931333 1
[
"1",
"Monitor Thread",
"1",
"CREATING TPCC SCHEMA",
"1",
"CREATING DATABASE tpcc under OWNER tpcc",
"1",
"CREATING TPCC TABLES",
"1",
"Loading Item",
"1",
"Loading Items - 10000",
"1",
"Loading Items - 20000",
"1",
"Loading Items - 30000",
"1",
"Loading Items - 40000",
"1",
"Loading Items - 50000",
"1",
"Loading Items - 60000",
"1",
"Loading Items - 70000",
"1",
"Loading Items - 80000",
"1",
"Loading Items - 90000",
"1",
"Loading Items - 100000",
"1",
"Item done",
"1",
"Monitoring Workers...",
"1",
"Workers: 4 Active 0 Done"
]
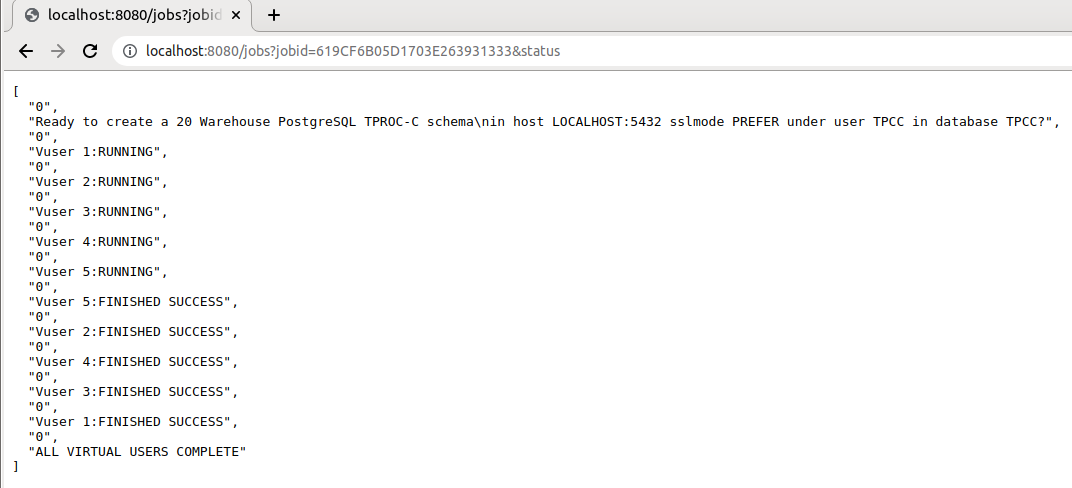
In this example, we use the HTTP interface to verify the output that the build completed successfully.
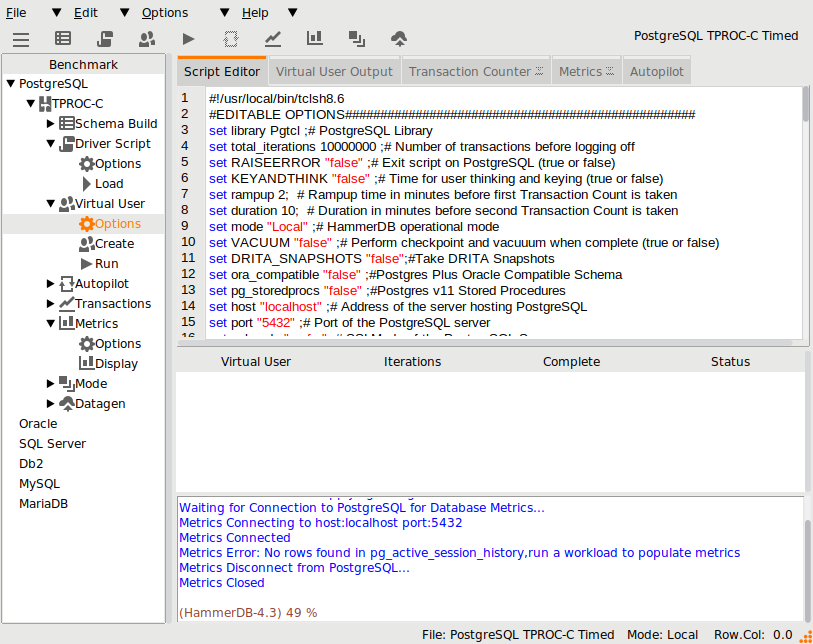
Running a Test
The following script is also recognisable as a valid CLI script with the addition of jobs commands to retrieve the test output.
dbset db pg
print dict
diset tpcc pg_superuser postgres
diset tpcc pg_defaultdbase postgres
diset tpcc pg_driver timed
diset tpcc pg_rampup 1
diset tpcc pg_duration 2
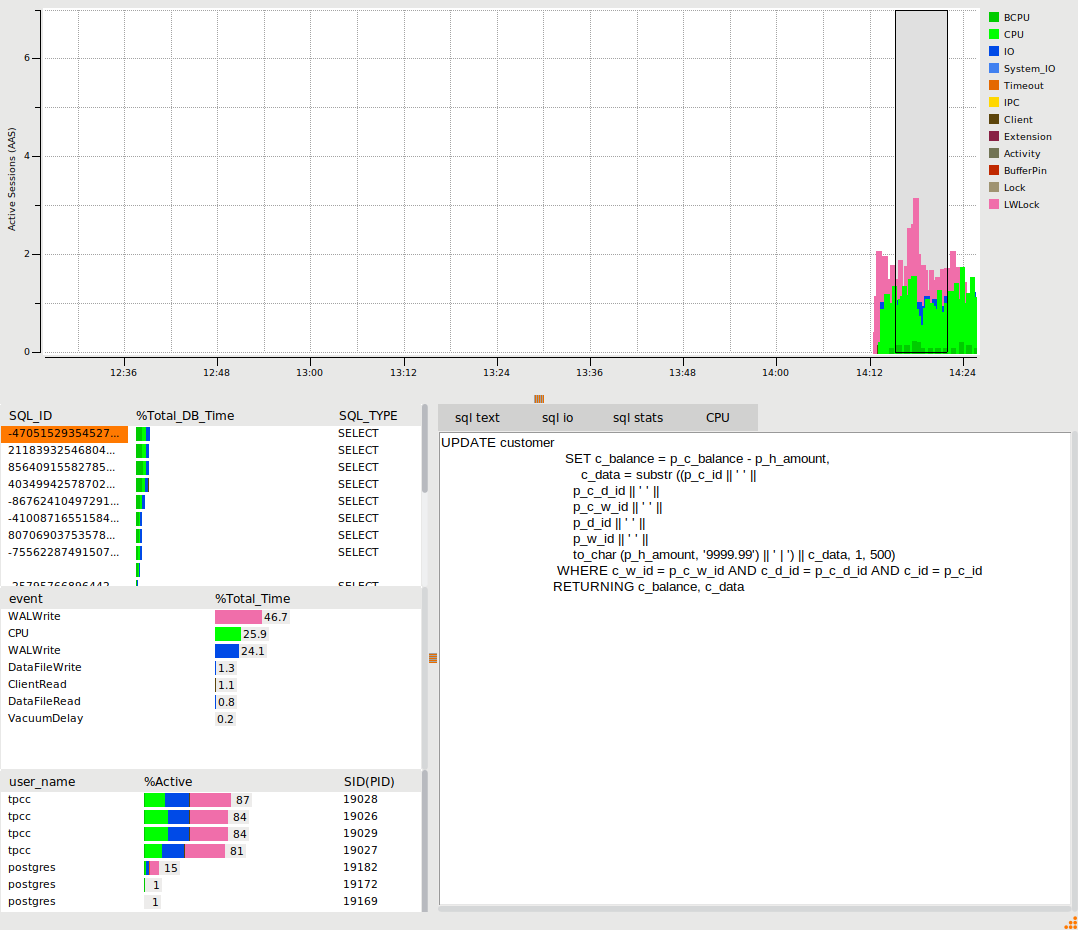
diset tpcc pg_timeprofile true
tcset refreshrate 10
loadscript
foreach z {1 2 4 8} {
puts "$z VU TEST"
vuset vu $z
vucreate
tcstart
set jobid [ vurun ]
runtimer 200
tcstop
jobs $jobid result
jobs $jobid timing
vudestroy
}
puts "JOB SEQUENCE ENDED"
Note that in this example using runtimer to automate the tests means that the interactive prompt will not return whilst the test is running, however it is still possible to query the jobs using the HTTP interface whilst running.
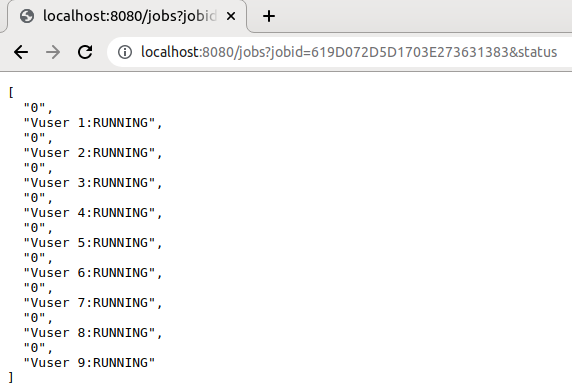
Running this test script returns the following output. Note that the job result and timing data is now queried from the SQLite repository during the script run.
hammerws>source pgrun.tcl
{"success": {"message": "Database set to PostgreSQL"}}
{
"connection": {
"pg_host": "localhost",
"pg_port": "5432",
"pg_sslmode": "prefer"
},
"tpcc": {
"pg_count_ware": "1",
"pg_num_vu": "1",
"pg_superuser": "postgres",
"pg_superuserpass": "postgres",
"pg_defaultdbase": "postgres",
"pg_user": "tpcc",
"pg_pass": "tpcc",
"pg_dbase": "tpcc",
"pg_tspace": "pg_default",
"pg_vacuum": "false",
"pg_dritasnap": "false",
"pg_oracompat": "false",
"pg_storedprocs": "false",
"pg_partition": "false",
"pg_total_iterations": "10000000",
"pg_raiseerror": "false",
"pg_keyandthink": "false",
"pg_driver": "test",
"pg_rampup": "2",
"pg_duration": "5",
"pg_allwarehouse": "false",
"pg_timeprofile": "false",
"pg_async_scale": "false",
"pg_async_client": "10",
"pg_async_verbose": "false",
"pg_async_delay": "1000",
"pg_connect_pool": "false"
}
}
{"success": {"message": "Value postgres for tpcc:pg_defaultdbase is the same as existing value postgres, no change made"}}
{"success": {"message": "Set driver script to timed, clearing Script, reload script to activate new setting"}}
{"success": {"message": "Changed tpcc:pg_rampup from 2 to 1 for PostgreSQL"}}
{"success": {"message": "Changed tpcc:pg_duration from 5 to 2 for PostgreSQL"}}
{"success": {"message": "Changed tpcc:pg_timeprofile from false to true for PostgreSQL"}}
{"success": {"message": "Transaction Counter refresh rate set to 10"}}
{"success": {"message": "script loaded"}}
1 VU TEST
{"success": {"message": "Virtual users set to 1"}}
{"success": {"message": "2 Virtual Users Created with Monitor VU"}}
{"success": {"message": "Transaction Counter Thread Started"}}
{"success": {"message": "Running Virtual Users: JOBID=619D05045D1703E213238373"}}
{"success": {"message": "Timer: 1 minutes elapsed"}}
{"success": {"message": "Timer: 2 minutes elapsed"}}
{"success": {"message": "Timer: 3 minutes elapsed"}}
{"success": {"message": "runtimer returned after 183 seconds"}}
{"success": {"message": "Transaction Counter thread running with threadid:tid0x7effcb1c5700"}}{"success": {"message": "Stopping Transaction Counter"}}
[
"619D05045D1703E213238373",
"2021-11-23 15:13:08",
"1 Active Virtual Users configured",
"TEST RESULT : System achieved 8089 NOPM from 18636 PostgreSQL TPM"
]
{
"NEWORD": {
"elapsed_ms": "181149.0",
"calls": "23974",
"min_ms": "1.856",
"avg_ms": "3.664",
"max_ms": "116.224",
"total_ms": "87851.402",
"p99_ms": "7.321",
"p95_ms": "5.624",
"p50_ms": "3.203",
"sd": "2550.005",
"ratio_pct": "48.497"
},
"PAYMENT": {
"elapsed_ms": "181149.0",
"calls": "23990",
"min_ms": "1.412",
"avg_ms": "2.799",
"max_ms": "119.255",
"total_ms": "67138.15",
"p99_ms": "4.552",
"p95_ms": "3.868",
"p50_ms": "2.52",
"sd": "2448.404",
"ratio_pct": "37.062"
},
"DELIVERY": {
"elapsed_ms": "181149.0",
"calls": "2473",
"min_ms": "2.609",
"avg_ms": "5.227",
"max_ms": "33.868",
"total_ms": "12927.033",
"p99_ms": "10.588",
"p95_ms": "8.638",
"p50_ms": "4.569",
"sd": "2507.252",
"ratio_pct": "7.136"
},
"SLEV": {
"elapsed_ms": "181149.0",
"calls": "2452",
"min_ms": "0.7",
"avg_ms": "2.679",
"max_ms": "13.246",
"total_ms": "6569.494",
"p99_ms": "6.72",
"p95_ms": "5.279",
"p50_ms": "2.258",
"sd": "1407.091",
"ratio_pct": "3.627"
},
"OSTAT": {
"elapsed_ms": "181149.0",
"calls": "2407",
"min_ms": "0.182",
"avg_ms": "0.74",
"max_ms": "2.494",
"total_ms": "1781.993",
"p99_ms": "1.75",
"p95_ms": "1.436",
"p50_ms": "0.614",
"sd": "392.984",
"ratio_pct": "0.984"
}
}
{"success": {"message": "vudestroy success"}}
2 VU TEST
{"success": {"message": "Virtual users set to 2"}}
{"success": {"message": "3 Virtual Users Created with Monitor VU"}}
{"success": {"message": "Transaction Counter Thread Started"}}
{"success": {"message": "Running Virtual Users: JOBID=619D05BC5D1703E263930313"}}
{"success": {"message": "Timer: 1 minutes elapsed"}}
{"success": {"message": "Timer: 2 minutes elapsed"}}
{"success": {"message": "Timer: 3 minutes elapsed"}}
{"success": {"message": "runtimer returned after 181 seconds"}}
{"success": {"message": "Transaction Counter thread running with threadid:tid0x7effca74c700"}}{"success": {"message": "Stopping Transaction Counter"}}
[
"619D05BC5D1703E263930313",
"2021-11-23 15:16:12",
"2 Active Virtual Users configured",
"TEST RESULT : System achieved 14102 NOPM from 32446 PostgreSQL TPM"
]
{
"NEWORD": {
"elapsed_ms": "179711.5",
"calls": "20902",
"min_ms": "2.13",
"avg_ms": "3.97",
"max_ms": "150.767",
"total_ms": "82979.222",
"p99_ms": "8.438",
"p95_ms": "5.836",
"p50_ms": "3.293",
"sd": "4482.874",
"ratio_pct": "46.323"
},
"PAYMENT": {
"elapsed_ms": "179711.5",
"calls": "20749",
"min_ms": "1.601",
"avg_ms": "3.56",
"max_ms": "147.367",
"total_ms": "73867.606",
"p99_ms": "6.637",
"p95_ms": "4.614",
"p50_ms": "3.201",
"sd": "4299.084",
"ratio_pct": "41.237"
},
"DELIVERY": {
"elapsed_ms": "179711.5",
"calls": "2114",
"min_ms": "2.789",
"avg_ms": "5.394",
"max_ms": "85.028",
"total_ms": "11401.954",
"p99_ms": "11.38",
"p95_ms": "8.898",
"p50_ms": "4.95",
"sd": "3780.131",
"ratio_pct": "6.365"
},
"SLEV": {
"elapsed_ms": "179711.5",
"calls": "2152",
"min_ms": "0.803",
"avg_ms": "2.459",
"max_ms": "12.131",
"total_ms": "5292.509",
"p99_ms": "6.567",
"p95_ms": "5.241",
"p50_ms": "2.039",
"sd": "1300.169",
"ratio_pct": "2.955"
},
"OSTAT": {
"elapsed_ms": "179711.5",
"calls": "2131",
"min_ms": "0.181",
"avg_ms": "0.631",
"max_ms": "2.649",
"total_ms": "1345.042",
"p99_ms": "1.656",
"p95_ms": "1.331",
"p50_ms": "0.526",
"sd": "329.533",
"ratio_pct": "0.751"
}
}
{"success": {"message": "vudestroy success"}}
4 VU TEST
{"success": {"message": "Virtual users set to 4"}}
{"success": {"message": "5 Virtual Users Created with Monitor VU"}}
{"success": {"message": "Transaction Counter Thread Started"}}
{"success": {"message": "Running Virtual Users: JOBID=619D06735D1703E263039373"}}
{"success": {"message": "Timer: 1 minutes elapsed"}}
{"success": {"message": "Timer: 2 minutes elapsed"}}
{"success": {"message": "Timer: 3 minutes elapsed"}}
{"success": {"message": "runtimer returned after 183 seconds"}}
{"success": {"message": "Transaction Counter thread running with threadid:tid0x7effc974a700"}}{"success": {"message": "Stopping Transaction Counter"}}
[
"619D06735D1703E263039373",
"2021-11-23 15:19:15",
"4 Active Virtual Users configured",
"TEST RESULT : System achieved 22392 NOPM from 51340 PostgreSQL TPM"
]
{
"NEWORD": {
"elapsed_ms": "180723.5",
"calls": "17438",
"min_ms": "2.082",
"avg_ms": "5.08",
"max_ms": "160.272",
"total_ms": "88591.161",
"p99_ms": "10.536",
"p95_ms": "7.33",
"p50_ms": "4.737",
"sd": "5223.001",
"ratio_pct": "48.826"
},
"PAYMENT": {
"elapsed_ms": "180723.5",
"calls": "17340",
"min_ms": "1.815",
"avg_ms": "4.011",
"max_ms": "133.818",
"total_ms": "69556.936",
"p99_ms": "8.386",
"p95_ms": "5.476",
"p50_ms": "3.329",
"sd": "5131.308",
"ratio_pct": "38.335"
},
"DELIVERY": {
"elapsed_ms": "180723.5",
"calls": "1723",
"min_ms": "2.601",
"avg_ms": "7.267",
"max_ms": "130.229",
"total_ms": "12520.634",
"p99_ms": "14.639",
"p95_ms": "11.303",
"p50_ms": "6.758",
"sd": "5597.635",
"ratio_pct": "6.901"
},
"SLEV": {
"elapsed_ms": "180723.5",
"calls": "1738",
"min_ms": "0.75",
"avg_ms": "2.816",
"max_ms": "7.497",
"total_ms": "4893.517",
"p99_ms": "6.261",
"p95_ms": "5.099",
"p50_ms": "2.784",
"sd": "1344.462",
"ratio_pct": "2.697"
},
"OSTAT": {
"elapsed_ms": "180723.5",
"calls": "1697",
"min_ms": "0.164",
"avg_ms": "0.781",
"max_ms": "3.79",
"total_ms": "1324.922",
"p99_ms": "2.155",
"p95_ms": "1.436",
"p50_ms": "0.755",
"sd": "414.512",
"ratio_pct": "0.73"
}
}
{"success": {"message": "vudestroy success"}}
8 VU TEST
{"success": {"message": "Virtual users set to 8"}}
{"success": {"message": "9 Virtual Users Created with Monitor VU"}}
{"success": {"message": "Transaction Counter Thread Started"}}
{"success": {"message": "Running Virtual Users: JOBID=619D072D5D1703E273631383"}}
{"success": {"message": "Timer: 1 minutes elapsed"}}
{"success": {"message": "Timer: 2 minutes elapsed"}}
{"success": {"message": "Timer: 3 minutes elapsed"}}
{"success": {"message": "runtimer returned after 184 seconds"}}
{"success": {"message": "Transaction Counter thread running with threadid:tid0x7effaaffd700"}}{"success": {"message": "Stopping Transaction Counter"}}
[
"619D072D5D1703E273631383",
"2021-11-23 15:22:21",
"8 Active Virtual Users configured",
"TEST RESULT : System achieved 36483 NOPM from 84065 PostgreSQL TPM"
]
{
"PAYMENT": {
"elapsed_ms": "181853.0",
"calls": "12384",
"min_ms": "1.85",
"avg_ms": "6.93",
"max_ms": "378.076",
"total_ms": "85816.379",
"p99_ms": "68.816",
"p95_ms": "11.981",
"p50_ms": "4.779",
"sd": "13572.668",
"ratio_pct": "48.716"
},
"NEWORD": {
"elapsed_ms": "181853.0",
"calls": "12454",
"min_ms": "2.182",
"avg_ms": "5.892",
"max_ms": "412.09",
"total_ms": "73383.456",
"p99_ms": "66.096",
"p95_ms": "10.838",
"p50_ms": "3.967",
"sd": "11271.032",
"ratio_pct": "41.658"
},
"DELIVERY": {
"elapsed_ms": "181853.0",
"calls": "1272",
"min_ms": "1.174",
"avg_ms": "7.539",
"max_ms": "103.49",
"total_ms": "9589.561",
"p99_ms": "65.102",
"p95_ms": "16.171",
"p50_ms": "5.538",
"sd": "8412.093",
"ratio_pct": "5.444"
},
"SLEV": {
"elapsed_ms": "181853.0",
"calls": "1260",
"min_ms": "1.165",
"avg_ms": "2.744",
"max_ms": "18.103",
"total_ms": "3456.896",
"p99_ms": "10.539",
"p95_ms": "7.59",
"p50_ms": "2.09",
"sd": "1989.072",
"ratio_pct": "1.962"
},
"OSTAT": {
"elapsed_ms": "181853.0",
"calls": "1270",
"min_ms": "0.205",
"avg_ms": "0.824",
"max_ms": "9.996",
"total_ms": "1045.855",
"p99_ms": "4.74",
"p95_ms": "2.312",
"p50_ms": "0.516",
"sd": "857.958",
"ratio_pct": "0.594"
}
}
{"success": {"message": "vudestroy success"}}
JOB SEQUENCE ENDED
With all jobs complete the SQLite repository can be queried either over HTTP or from the jobs command. If the webservice is stopped and restarted an on-disk repository is retained for querying at a later point in time.
hammerws>jobs
[
"619CF6B05D1703E263931333",
"619D05045D1703E213238373",
"619D05BC5D1703E263930313",
"619D06735D1703E263039373",
"619D072D5D1703E273631383"
]
hammerws>
The help jobs command can show the available commands to query the repository.
hammerws>help jobs
jobs - Usage: jobs
list all jobs.

jobs - Usage: jobs [jobid|result|timestamp]
jobid: list VU output for jobid.
result: list result for all jobs.
timestamp: list starting timestamp for all jobs.

jobs jobid - Usage: jobs jobid [bm|db|delete|dict|result|status|tcount|timestamp|timing|vuid]
bm: list benchmark for jobid.
db: list database for jobid.
delete: delete jobid.
dict: list dict for jobid.
result: list result for jobid.
status: list status for jobid.
tcount: list count for jobid.
timestamp: list starting timestamp for jobid.
timing: list xtprof summary timings for jobid.
vuid: list VU output for VU with vuid for jobid.

jobs jobid timing - Usage: jobs jobid timing vuid
timing vuid: list xtprof timings for vuid for jobid.
The CLI jobs result command will query all jobs and return the result if it finds one. In the example below as expected the build job does not have a result but the results are returned for all of the driver jobs.
hammerws>jobs result
[
"619CF6B05D1703E263931333",
"Jobid has no test result"
]
[
"619D05045D1703E213238373",
"2021-11-23 15:13:08",
"1 Active Virtual Users configured",
"TEST RESULT : System achieved 8089 NOPM from 18636 PostgreSQL TPM"
]
[
"619D05BC5D1703E263930313",
"2021-11-23 15:16:12",
"2 Active Virtual Users configured",
"TEST RESULT : System achieved 14102 NOPM from 32446 PostgreSQL TPM"
]
[
"619D06735D1703E263039373",
"2021-11-23 15:19:15",
"4 Active Virtual Users configured",
"TEST RESULT : System achieved 22392 NOPM from 51340 PostgreSQL TPM"
]
[
"619D072D5D1703E273631383",
"2021-11-23 15:22:21",
"8 Active Virtual Users configured",
"TEST RESULT : System achieved 36483 NOPM from 84065 PostgreSQL TPM"
]
An individual job can queried for any related information such as the timestamp when the job started, the configuration dict for the job or as the example below because the transaction counter was started the transaction count data for the run can retrieved based on the jobid.
hammerws>job 619D072D5D1703E273631383 tcount
{"PostgreSQL tpm": {
"0": "2021-11-23 15:22:21",
"76662": "2021-11-23 15:22:31",
"102426": "2021-11-23 15:22:41",
"74574": "2021-11-23 15:22:51",
"71526": "2021-11-23 15:23:01",
"119334": "2021-11-23 15:23:11",
"96852": "2021-11-23 15:23:21",
"59640": "2021-11-23 15:23:31",
"79512": "2021-11-23 15:23:41",
"93750": "2021-11-23 15:23:51",
"92322": "2021-11-23 15:24:01",
"68988": "2021-11-23 15:24:11",
"95556": "2021-11-23 15:24:21",
"97512": "2021-11-23 15:24:31",
"76590": "2021-11-23 15:24:41",
"55236": "2021-11-23 15:24:51",
"97254": "2021-11-23 15:25:01",
"98364": "2021-11-23 15:25:11",
"95784": "2021-11-23 15:25:21"
}}
Summary
It should be clear that the v4.3 Webservice functionality provides a building block to integrate HammerDB functionality into wider webservice environments. The addition of the CLI provides an easy to use command line interface to the functionality whilst the SQLite repository and output in JSON format enables HammerDB workloads to be automated with results, output, timing data and configuration all able to be retrieved for a particular job at any further point in time.