Percona Live ONLINE, THE Open Source Database Conference, is taking place May 12-13, 2021. This year Steve Shaw will be presenting HammerDB: A better Way to Benchmark Your Open Source Database on Thursday, May 13th 2021 at 13.30-14.30 EDT.
This presentation is now available to view on demand on YouTube. With slides also available for download from Percona.
Percona Live is a community-focused conference with an emphasis on promoting and increasing the adoption of open source database software. It provides a forum for open source database users and experts to ask questions, and share knowledge and experience.
Online and free to attend in 2021, register to hear industry experts discuss their experiences, deep-dive into software features, and offer insight and advice.
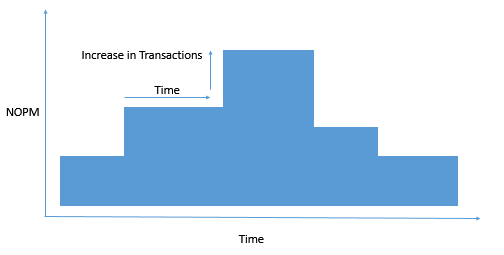
HammerDB Variable or Step Workloads are an advanced testing feature that enables you to automatically vary the load on the database over a period of time. When taking this approach you would not focus on the test result but instead monitor the databases ability to cope with the variation in demand and transaction response times.
Step Workloads
To implement Step Workloads, HammerDB v4.1 introduces a CLI only command called steprun combined with a new XML configuration file called steps.xml. the steprun command reads the XML configuration file and creates primary and replica instances of HammerDB per step with the replica instances starting at pre-defined time intervals automatically connecting back to the primary instance of HammerDB.
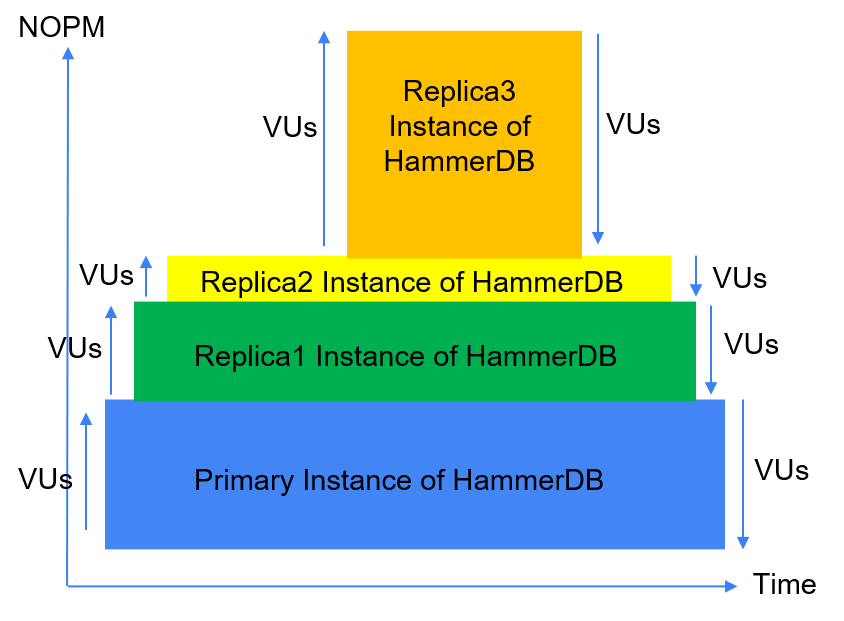
Primary and Replicas
When defining the workload it is best to think of the configuration as defining a pyramid with the primary at the base and the replicas sitting above it. Each replica must finish at the same time or earlier than the primary. The primary running time continues to be defined by the standard settings. For example for configuring an Oracle workload the following commands set the rampup and duration running times respectively. Therefore in this case the workload woud run for 12 minutes with 2 minutes of rampup and 10 minutes of duration.
diset tpcc rampup 2
diset tpcc duration 10
The replicas are defined in steps.xml in the config directory to determine how many virtual users each replica will configure, how soon after the previous instance has started the replica should start and how long it will run for.
If the configuration is incorrect HammerDB will report the error and fail to start the Step Workload. In the following example we have set the default 2 minutes of rampup and 5 minutes of test.
diset tpcc rampup 2
diset tpcc duration 5
In this case the workload errors because the replica running times exceed the primary.
Value 2 for tpcc:rampup is the same as existing value 2, no change made
Value 5 for tpcc:duration is the same as existing value 5, no change made
primary starts immediately, runs rampup for 2 minutes then runs test for 5 minutes with 2 Active VU
replica1 starts 2 minutes after rampup completes and runs test for 8 minutes with 2 Active VU
Error: replica1 is set to complete after 12 minutes and is longer than the Primary running time of 7 minutes
replica2 starts 2 minutes after previous replica starts and runs test for 6 minutes with 2 Active VU
Error: replica2 is set to complete after 12 minutes and is longer than the Primary running time of 7 minutes
replica3 starts 2 minutes after previous replica starts and runs test for 4 minutes with 2 Active VU
Error: replica3 is set to complete after 12 minutes and is longer than the Primary running time of 7 minutes
replica4 starts 2 minutes after previous replica starts and runs test for 2 minutes with 2 Active VU
Error: replica4 is set to complete after 12 minutes and is longer than the Primary running time of 7 minutes
Error: Step workload primary running time must exceed the running time of all replicas
Instead the following script defines the rampup of 2 minutes and duration of 10 correctly so that the primary provides an adequate base for the pyramid, starting before and ending at the same time or after all of the replicas. The workload is started with the steprun command as the last command. No commands should follow steprun as the command will intentionally exit all replicas and the primary when the workload is complete.
Running this script it can be seen that without further intervention the primary and replicas are created with the replicas automatically connecting back to the primary, the replicas are then started at the time interval given in the steps.xml file.
The primary sets the rampup in the replicas to zero (as the rampup has completed in the primary) and then sends the individual duration times to the replicas. Time profiling is also disabled in the replicas. When complete replicas will call exit from the primary and when the final replica has completed the primary will also exit.
Note that it is expected for Virtual User 1 of the replicas to end immediately with the message.
Vuser 1:FINISHED SUCCESS
This is because Virtual User 1 is the monitor Virtual User but this Virtual User does not run in the replica meaning it ends immediately. When the replicas are started the message sending “run_virtual” is recorded.
Sending "run_virtual" ....
The following output shows the previously defined step workload running against an Oracle database.
hammerdb>source runstepora.tcl
Database set to Oracle
Benchmark set to TPC-C for Oracle
Value system for connection:system_user is the same as existing value system, no change made
Changed connection:system_password from manager to oracle for Oracle
Changed connection:instance from oracle to RAZPDB1 for Oracle
Value tpcc for tpcc:tpcc_user is the same as existing value tpcc, no change made
Value tpcc for tpcc:tpcc_pass is the same as existing value tpcc, no change made
Changed tpcc:total_iterations from 1000000 to 10000000 for Oracle
Clearing Script, reload script to activate new setting
Script cleared
Changed tpcc:ora_driver from test to timed for Oracle
Value 2 for tpcc:rampup is the same as existing value 2, no change made
Changed tpcc:duration from 5 to 10 for Oracle
primary starts immediately, runs rampup for 2 minutes then runs test for 10 minutes with 2 Active VU
replica1 starts 2 minutes after rampup completes and runs test for 8 minutes with 2 Active VU
replica2 starts 2 minutes after previous replica starts and runs test for 6 minutes with 2 Active VU
replica3 starts 2 minutes after previous replica starts and runs test for 4 minutes with 2 Active VU
replica4 starts 2 minutes after previous replica starts and runs test for 2 minutes with 2 Active VU
Switch from Local
to Primary mode?
Enter yes or no: replied yes
Setting Primary Mode at id : 20166, hostname : razorbill.home
Primary Mode active at id : 20166, hostname : razorbill.home
Starting 1 replica HammerDB instance
Starting 2 replica HammerDB instance
HammerDB CLI v4.1
Copyright (C) 2003-2021 Steve Shaw
Type "help" for a list of commands
HammerDB CLI v4.1
Copyright (C) 2003-2021 Steve Shaw
Type "help" for a list of commands
Starting 3 replica HammerDB instance
Starting 4 replica HammerDB instance
Doing wait to connnect ....
Primary waiting for all replicas to connect .... 0 out of 4 are connected
HammerDB CLI v4.1
Copyright (C) 2003-2021 Steve Shaw
Type "help" for a list of commands
HammerDB CLI v4.1
Copyright (C) 2003-2021 Steve Shaw
Type "help" for a list of commands
The xml is well-formed, applying configuration
The xml is well-formed, applying configuration
The xml is well-formed, applying configuration
Switch from Local
to Replica mode?
Enter yes or no: replied yes
Switch from Local
to Replica mode?
Enter yes or no: replied yes
Setting Replica Mode at id : 20182, hostname : razorbill.home
Replica connecting to localhost 20166 : Connection succeeded
Received a new replica connection from host ::1
Setting Replica Mode at id : 20181, hostname : razorbill.home
Replica connecting to localhost 20166 : Connection succeeded
New replica joined : {20182 razorbill.home}
The xml is well-formed, applying configuration
Received a new replica connection from host ::1
New replica joined : {20182 razorbill.home} {20181 razorbill.home}
Switch from Local
to Replica mode?
Primary call back successful
Switched to Replica mode via callback
Enter yes or no: replied yes
Primary call back successful
Switched to Replica mode via callback
Setting Replica Mode at id : 20183, hostname : razorbill.home
Received a new replica connection from host ::1
Replica connecting to localhost 20166 : Connection succeeded
New replica joined : {20182 razorbill.home} {20181 razorbill.home} {20183 razorbill.home}
Primary call back successful
Switched to Replica mode via callback
Switch from Local
to Replica mode?
Enter yes or no: replied yes
Setting Replica Mode at id : 20184, hostname : razorbill.home
Received a new replica connection from host ::1
Replica connecting to localhost 20166 : Connection succeeded
New replica joined : {20182 razorbill.home} {20181 razorbill.home} {20183 razorbill.home} {20184 razorbill.home}
Primary call back successful
Switched to Replica mode via callback
Primary waiting for all replicas to connect .... {20182 razorbill.home} {20181 razorbill.home} {20183 razorbill.home} {20184 razorbill.home} out of 4 are connected
Primary Received all replica connections {20182 razorbill.home} {20181 razorbill.home} {20183 razorbill.home} {20184 razorbill.home}
Database set to Oracle
Database set to Oracle
Database set to Oracle
Setting primary to run 2 virtual users for 10 duration
Database set to Oracle
Database set to Oracle
Value 10 for tpcc:duration is the same as existing value 10, no change made
Sending dbset all to 20182 razorbill.home
Setting replica1 to start after 2 duration 8 VU count 2, Replica instance is 20182 razorbill.home
Sending "diset tpcc ora_timeprofile false" to 20182 razorbill.home
Value false for tpcc:ora_timeprofile is the same as existing value false, no change made
Sending "diset tpcc rampup 0" to 20182 razorbill.home
Changed tpcc:rampup from 2 to 0 for Oracle
Sending "diset tpcc duration 8" to 20182 razorbill.home
Changed tpcc:duration from 10 to 8 for Oracle
Sending "vuset vu 2" to 20182 razorbill.home
Sending dbset all to 20181 razorbill.home
Setting replica2 to start after 2 duration 6 VU count 2, Replica instance is 20181 razorbill.home
Sending "diset tpcc ora_timeprofile false" to 20181 razorbill.home
Value false for tpcc:ora_timeprofile is the same as existing value false, no change made
Sending "diset tpcc rampup 0" to 20181 razorbill.home
Changed tpcc:rampup from 2 to 0 for Oracle
Sending "diset tpcc duration 6" to 20181 razorbill.home
Changed tpcc:duration from 10 to 6 for Oracle
Sending "vuset vu 2" to 20181 razorbill.home
Sending dbset all to 20183 razorbill.home
Setting replica3 to start after 2 duration 4 VU count 2, Replica instance is 20183 razorbill.home
Sending "diset tpcc ora_timeprofile false" to 20183 razorbill.home
Value false for tpcc:ora_timeprofile is the same as existing value false, no change made
Sending "diset tpcc rampup 0" to 20183 razorbill.home
Changed tpcc:rampup from 2 to 0 for Oracle
Sending "diset tpcc duration 4" to 20183 razorbill.home
Changed tpcc:duration from 10 to 4 for Oracle
Sending "vuset vu 2" to 20183 razorbill.home
Sending dbset all to 20184 razorbill.home
Setting replica4 to start after 2 duration 2 VU count 2, Replica instance is 20184 razorbill.home
Sending "diset tpcc ora_timeprofile false" to 20184 razorbill.home
Value false for tpcc:ora_timeprofile is the same as existing value false, no change made
Sending "diset tpcc rampup 0" to 20184 razorbill.home
Changed tpcc:rampup from 2 to 0 for Oracle
Sending "diset tpcc duration 2" to 20184 razorbill.home
Changed tpcc:duration from 10 to 2 for Oracle
Sending "vuset vu 2" to 20184 razorbill.home
Script loaded, Type "print script" to view
Script loaded, Type "print script" to view
Script loaded, Type "print script" to view
Script loaded, Type "print script" to view
Script loaded, Type "print script" to view
Vuser 1 created MONITOR - WAIT IDLE
Vuser 2 created - WAIT IDLE
Vuser 3 created - WAIT IDLE
Vuser 1 created MONITOR - WAIT IDLE
Vuser 2 created - WAIT IDLE
Vuser 1 created MONITOR - WAIT IDLE
Vuser 3 created - WAIT IDLE
Vuser 2 created - WAIT IDLE
3 Virtual Users Created with Monitor VU
Vuser 3 created - WAIT IDLE
3 Virtual Users Created with Monitor VU
Vuser 1 created MONITOR - WAIT IDLE
Vuser 2 created - WAIT IDLE
Vuser 3 created - WAIT IDLE
3 Virtual Users Created with Monitor VU
Vuser 1 created MONITOR - WAIT IDLE
Vuser 2 created - WAIT IDLE
Vuser 3 created - WAIT IDLE
3 Virtual Users Created with Monitor VU
Logging activated
to /tmp/hammerdb.log
3 Virtual Users Created with Monitor VU
Starting Primary VUs
Vuser 1:RUNNING
Vuser 1:Beginning rampup time of 2 minutes
Vuser 2:RUNNING
Vuser 2:Processing 10000000 transactions with output suppressed...
Vuser 3:RUNNING
Vuser 3:Processing 10000000 transactions with output suppressed...
Delaying Start of Replicas to rampup 2 replica1 2 replica2 2 replica3 2 replica4 2
Delaying replica1 for 4 minutes.
Delaying replica2 for 6 minutes.
Delaying replica3 for 8 minutes.
Delaying replica4 for 10 minutes.
Primary entering loop waiting for vucomplete
Vuser 1:Rampup 1 minutes complete ...
Vuser 1:Rampup 2 minutes complete ...
Vuser 1:Rampup complete, Taking start AWR snapshot.
Vuser 1:Start Snapshot 18 taken at 10 MAY 2021 09:07 of instance RAZCDB1 (1) of database RAZCDB1 (171153594)
Vuser 1:Timing test period of 10 in minutes
Vuser 1:1 ...,
Sending "run_virtual" to 20182 razorbill.home
Vuser 1:RUNNING
Vuser 1:Operating in Replica Mode, No Snapshots taken...
Vuser 1:FINISHED SUCCESS
Vuser 2:RUNNING
Vuser 2:Processing 10000000 transactions with output suppressed...
Vuser 3:RUNNING
Vuser 3:Processing 10000000 transactions with output suppressed...
Vuser 1:2 ...,
Vuser 1:3 ...,
Sending "run_virtual" to 20181 razorbill.home
Vuser 1:RUNNING
Vuser 1:Operating in Replica Mode, No Snapshots taken...
Vuser 1:FINISHED SUCCESS
Vuser 2:RUNNING
Vuser 2:Processing 10000000 transactions with output suppressed...
Vuser 3:RUNNING
Vuser 3:Processing 10000000 transactions with output suppressed...
Vuser 1:4 ...,
Vuser 1:5 ...,
Sending "run_virtual" to 20183 razorbill.home
Vuser 1:RUNNING
Vuser 1:Operating in Replica Mode, No Snapshots taken...
Vuser 1:FINISHED SUCCESS
Vuser 2:RUNNING
Vuser 2:Processing 10000000 transactions with output suppressed...
Vuser 3:RUNNING
Vuser 3:Processing 10000000 transactions with output suppressed...
Vuser 1:6 ...,
Vuser 1:7 ...,
Sending "run_virtual" to 20184 razorbill.home
Vuser 1:RUNNING
Vuser 1:Operating in Replica Mode, No Snapshots taken...
Vuser 1:FINISHED SUCCESS
Vuser 2:RUNNING
Vuser 2:Processing 10000000 transactions with output suppressed...
Vuser 3:RUNNING
Vuser 3:Processing 10000000 transactions with output suppressed...
Vuser 1:8 ...,
Vuser 1:9 ...,
Vuser 1:10 ...,
Vuser 1:Test complete, Taking end AWR snapshot.
Vuser 1:End Snapshot 19 taken at 10 MAY 2021 09:17 of instance RAZCDB1 (1) of database RAZCDB1 (171153594)
Vuser 1:Test complete: view report from SNAPID 18 to 19
Vuser 1:2 Active Virtual Users configured
Vuser 1:TEST RESULT : System achieved 13607 NOPM from 28559 Oracle TPM
Vuser 1:FINISHED SUCCESS
Vuser 2:FINISHED SUCCESS
Vuser 3:FINISHED SUCCESS
Vuser 2:FINISHED SUCCESS
Vuser 3:FINISHED SUCCESS
Vuser 3:FINISHED SUCCESS
ALL VIRTUAL USERS COMPLETE
Vuser 2:FINISHED SUCCESS
Replica workload complete and calling exit from primary
Lost connection to : 20182 razorbill.home because target application died or connection lost
Vuser 3:FINISHED SUCCESS
ALL VIRTUAL USERS COMPLETE
Vuser 3:FINISHED SUCCESS
ALL VIRTUAL USERS COMPLETE
Vuser 2:FINISHED SUCCESS
ALL VIRTUAL USERS COMPLETE
Vuser 2:FINISHED SUCCESS
ALL VIRTUAL USERS COMPLETE
Replica workload complete and calling exit from primary
Lost connection to : 20181 razorbill.home because target application died or connection lost
Replica workload complete and calling exit from primary
Lost connection to : 20183 razorbill.home because target application died or connection lost
Replica workload complete and calling exit from primary
Lost connection to : 20184 razorbill.home because target application died or connection lost
Primary complete
deleting port_file /tmp/hdbcallback.tcl
Step workload complete
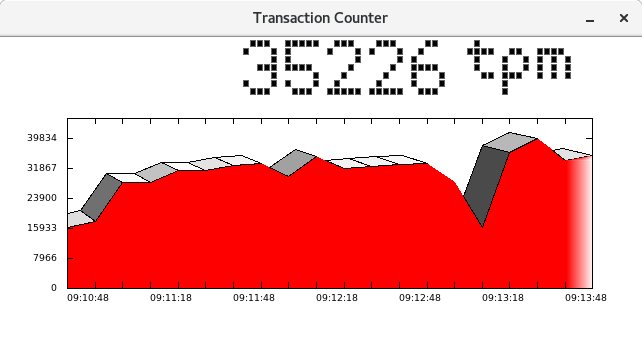
Monitoring the workload enables you to see the variation and the impact of starting additional instances against the same database over time.
Oracle Transaction Counter
Step workloads enable you to configure complex Virtual User configurations to see how your database responds to changes in load over time.
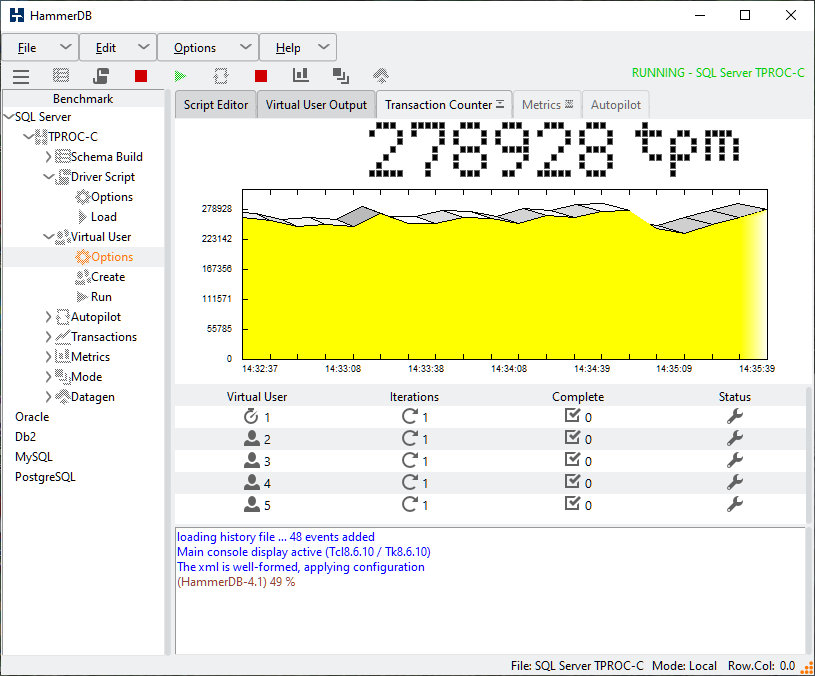
Prior to v4.1 HammerDB has featured a graphical transaction counter, this enables you to see the transaction rate taking place on the database during the test. The transaction counter is designed not to be intrusive on the schema being tested. It also enables you to verify that the transaction rate reported at the end of the test is consistent throughout without peaks and troughs in the graph that would indicate bottlenecks due to configuration issues.
GUI Transaction Counter
From v4.1 HammerDB also features a transaction counter in the CLI. Similarly to the GUI transaction counter the CLI one also runs in a separate thread to be non-intrusive to main workload. To configure the CLI transaction counter use the tcset command with the same options available in the GUI. The transaction counter can then be started with tcstart, stopped with tcstop and queried with tcstatus.
hammerdb>help tcset
tcset - Usage: tcset [refreshrate|logtotemp|unique|timestamps]
Configure the transaction counter options. Equivalent to the Transaction Counter Options window in the graphical interface.

hammerdb>help tcstart
tcstart - Usage: tcstart
Starts the Transaction Counter.

hammerdb>help tcstatus
status - Usage: tcstatus
Checks the status of the Transaction Counter.

hammerdb>help tcstop
tcstop - Usage: tcstop
Stops the Transaction Counter.
An example test script is shown including the transaction counter commands.
When we run the script we have now activated the transaction counter to run throughout the test.
hammerdb>source sqlrun.tcl
Database set to MSSQLServer
Changed connection:mssqls_server from (local) to (local)\SQLDEVELOP for MSSQLServer
Clearing Script, reload script to activate new setting
Script cleared
Changed tpcc:mssqls_driver from test to timed for MSSQLServer
Changed tpcc:mssqls_rampup from 2 to 1 for MSSQLServer
Changed tpcc:mssqls_duration from 5 to 2 for MSSQLServer
Transaction Counter log to temp set to 1
Transaction Counter timestamps set to 1
Script loaded, Type "print script" to view
Vuser 1 created MONITOR - WAIT IDLE
Vuser 2 created - WAIT IDLE
Vuser 3 created - WAIT IDLE
Vuser 4 created - WAIT IDLE
Vuser 5 created - WAIT IDLE
Logging activated
to C:/Users/Steve/AppData/Local/Temp/hammerdb.log
5 Virtual Users Created with Monitor VU
Transaction Counter logging activated to C:/Users/Steve/AppData/Local/Temp/hdbtcount.log
Transaction Counter Started
Transaction Counter thread running with threadid:tid0000000000002F88
Vuser 1:RUNNING
0 MSSQLServer tpm
Vuser 1:Beginning rampup time of 1 minutes
Vuser 2:RUNNING
Vuser 2:Processing 1000000 transactions with output suppressed...
Vuser 3:RUNNING
Vuser 3:Processing 1000000 transactions with output suppressed...
Vuser 4:RUNNING
Vuser 4:Processing 1000000 transactions with output suppressed...
Vuser 5:RUNNING
Vuser 5:Processing 1000000 transactions with output suppressed...
238182 MSSQLServer tpm
261366 MSSQLServer tpm
251310 MSSQLServer tpm
255102 MSSQLServer tpm
252180 MSSQLServer tpm
Vuser 1:Rampup 1 minutes complete ...
Vuser 1:Rampup complete, Taking start Transaction Count.
Vuser 1:Timing test period of 2 in minutes
228408 MSSQLServer tpm
Timer: 1 minutes elapsed
267666 MSSQLServer tpm
248466 MSSQLServer tpm
283332 MSSQLServer tpm
270900 MSSQLServer tpm
242988 MSSQLServer tpm
Vuser 1:1 ...,
246384 MSSQLServer tpm
Timer: 2 minutes elapsed
255042 MSSQLServer tpm
275712 MSSQLServer tpm
260112 MSSQLServer tpm
258246 MSSQLServer tpm
243798 MSSQLServer tpm
Vuser 1:2 ...,
Vuser 1:Test complete, Taking end Transaction Count.
Vuser 1:4 Active Virtual Users configured
Vuser 1:TEST RESULT : System achieved 112009 NOPM from 257938 SQL Server TPM
Vuser 1:FINISHED SUCCESS
Vuser 3:FINISHED SUCCESS
Vuser 2:FINISHED SUCCESS
Vuser 5:FINISHED SUCCESS
Vuser 4:FINISHED SUCCESS
ALL VIRTUAL USERS COMPLETE
runtimer returned after 178 seconds
235392 MSSQLServer tpm
vudestroy success
Transaction Counter thread running with threadid:tid0000000000002F88
Stopping Transaction Counter
Closed Transaction Counter Log
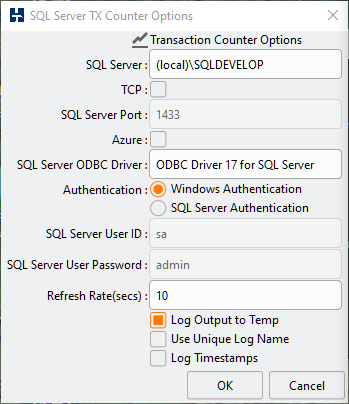
It should also be noted that we now have the option to record the output of the transaction counter to a new log file called hdbtcount.log. We also have the option of giving this file a unique log name and adding timestamps to each line of output. The following shows the contents in the logfile from the previous test.
This option to record the transaction counter output is not only available in the CLI, it has also been added to the GUI with a checkbox option of Log Output to Temp with the same additional options as the CLI to use a unique log name and add timestamps.
GUI Log Transaction Counter
Adding the Transaction Counter to the CLI and Transaction Counter Logging to both GUI and CLI enables you to record the transaction rate during the test to ensure that the rates are consistent throughout the test without significant variance around your test result.
Up to HammerDB v4.0 you have had the ability to do time profiling for the first Active Virtual User only. This post showed you how to graph the transaction response times using this package called etprof. v4.1 enhances time profiling by introducing a new package called xtprof that enables you to capture timing data for all Active Virtual Users simultaneously. This post will get you started with time profiling in v4.1.
Time profiling of a workload is the process of capturing transaction response times. Response times give us multiple insights beyond just transaction rates in the form of NOPM and TPM. NOPM shows us the new orders per minute so the number of new order transactions only. TPM shows us the user commits and user rollbacks across the whole database, however with both values we are recording the average transaction rate across a minute. With the transaction counter this shows us how even this transaction rate is across the measured time, however time profiling enables a much finer granular view on the workload of each Virtual User.
Within the TPROC-C workload there is a transaction mix of neword 45%, payment 43%, delivery 4%, order status 4%, stock level 4%. The transaction to run is selected according to this mix and NOPM records only 45% of this mix. Note that for example New Order is called 45% of the time however the actual time ratio attributed to the transaction could be longer or shorter.
So using the test workload as an example for a single Virtual User they will run a sequence of transactions such as follows.
Vuser 1:order status
Vuser 1:payment
Vuser 1:payment
Vuser 1:new order
Vuser 1:new order
Vuser 1:new order
Vuser 1:stock level
Vuser 1:new order
Vuser 1:payment
Vuser 1:payment
Vuser 1:payment
Vuser 1:new order
Vuser 1:payment
Vuser 1:payment
Vuser 1:order status
Vuser 1:new order
Vuser 1:new order
Vuser 1:payment
Vuser 1:new order
Vuser 1:delivery
Looking at this single Virtual User if for example the Stock Level or Order Status transactions takes longer, then it should be clear they are going to be able to run fewer New Orders in a minute because while they are running other transactions they are not recording any New Order transactions.
However, it is in most cases not just one Virtual User, instead it is tens, hundreds or thousands running at the same time and the database is managing the concurrency between them. Stock Level for example is querying the district, stock and order_line tables so while other virtual users are inserting and updating these tables with New Order and Payment or deleting with Delivery, Stock Level is doing a longer running query with locks and multiversioning to ensure that the data is consistent. A very basic database approach for Stock Level would be to lock the tables to ensure consistency, however doing this would block any other transactions from running until Stock Level was complete resulting in low performance overall. This is the very design of TPC-C specification in that the transactions are intended to do inserts, updates, deletes and queries on the data at the same time to test how well the database engine can manage the concurrency. Time profiling can give you a deeper insight into how well this is managed.
To begin using extended profiling view the settings in the generic.xml file in the config directory. From v4.1 the default profiler will be the newer xtprof, however this can be changed back to etprof to use the earlier single Virtual User profiler. As xtprof profiles all Virtual Users output now gets written to a dedicated log file and therefore there is the option of whether a unique log name is required, 0 for a regular filename and 1 for a unique id.
With the profiler setting set to xtprof HammerDB will use the new profiler automatically enabling it for all Virtual Users when selected.
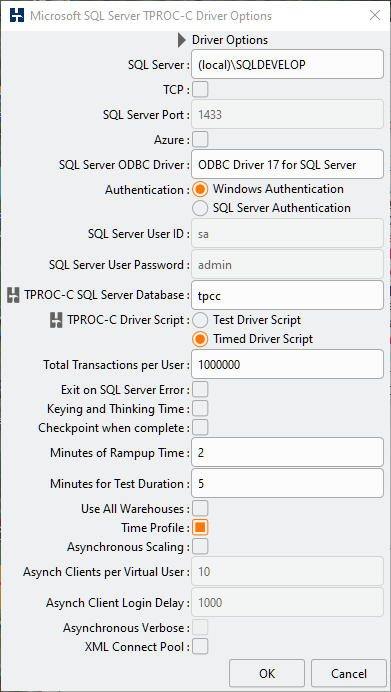
To enable time profiling when configuring the driver script select the time profiling option.
Time Profile Option
In the CLI set the timeprofile option to true.
hammerdb>diset tpcc mssqls_timeprofile true
Changed tpcc:mssqls_timeprofile from false to true for MSSQLServer
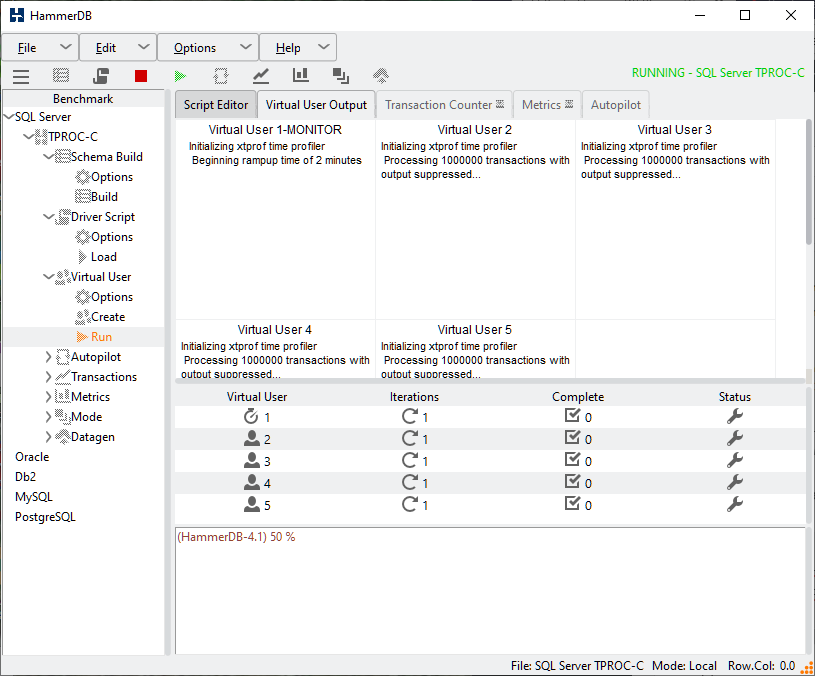
When running a workload you will now see a message “Initializing xtprof time profiler” in all Virtual Users. Note that the package initializes in the Monitor Virtual User also as all data is gathered, processed and reported by the Monitor.
Time Profiling Started
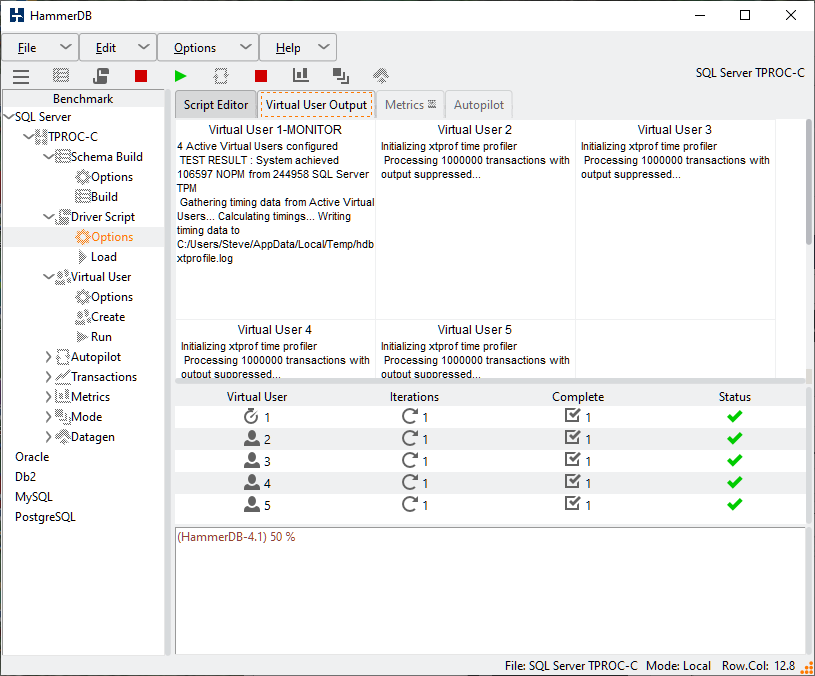
When the workload is complete after reporting the NOPM/TPM the Monitor Virtual User will report messages on Gathering timing data/Calculating timings and Writing timing data to an external logfile to mark the separate stages of gathering and processing the data.
In the logfile there is a report of the timings for all of the Active Virtual Users followed by a summary of the cumulative data.
In the report the values have the following meaning with all timings in milliseconds.
Value
Description
CALLS
Number of times that the stored procedure was called.
MIN
Minimum response time in milliseconds.
AVG
Average response time in milliseconds.
MAX
Maximum response time in milliseconds.
TOTAL
Total time spent in that stored procedure during the measuring interval. The total time will include both rampup and timed test times.
P99
99th percentile in milliseconds.
P95
95th percentile in milliseconds.
P50
50th percentile in milliseconds.
SD
Standard Deviation showing variance in captured values.
RATIO
Ratio showing percentage time taken for that stored procedure. The total of these values may be less than 100% as only timings for the stored procedures are shown.
Some key observations are to note that time profiling begins immediately for each Virtual User and includes both rampup and timed durations. For this reason by default the captured time for the first Virtual User will be longer than the second and so on because there is a pause between each starting. It is a proposal to Exclude ramp up duration for time profiling #233 and this may be an enhancement for a future version. Also note that for the summary the elapsed times will be proprtionally longer than the duration of the test as it is recording the elapsed time for all Virtual Users.
Typically the key metrics you will want to observe will be P95 & P99 as this shows that 95% and 99% respectively of transactions completed inside this time. You would normally expect the total elapsed time to be in the order of NEWORD, PAYMENT, DELIVERY, SLEV, OSTAT however this may vary for some databases when higher levels of locking are experienced. Finally the SD value or standard deviation can give an indication of the variance between the recorded values. A higher variation gives an indication of less consistent transaction processing times.
Finally for advanced users comfortable with examining the HammerDB source code in the xtprof module there is the following comment as a reference point.
#At this point [dict get $monitortimings $vutr $sproc clickslist] will return all unsorted data points for vuser $vutr for stored proc $sproc
#To record all individual data points for a virtual user write the output of this command to a file
As shown in the comment at this section of the code if desired you can use the commands given to print out all individual data points for all Virtual Users for advanced plotting and analysis of timing data. This is also functionality considered for future releases beyond v4.1 and a potential area for future code contribution.