HammerDB v4.0 Signed Installer for Windows

There is now a signed installer available for HammerDB v4.0 for Windows from the HammerDB releases. The installation steps from HammerDB-4.0-Win-x64-Signed-Setup.exe is identical to HammerDB-4.0-Win-x64-Setup.exe and the contents in the installed directory are the same.

The key difference between the 2 installers is that the Signed Setup has been signed with a code signing certificate, whereas for the unsigned installer you can verify the installer itself manually with the provided checksums. When running the signed setup it will confirm the Verified publisher as the TPC Council as shown.

If you choose to Show more details you can view the Certificate Information from the TPC Council.

For Linux installations and the provided zip file for Windows, verification of the release files continues to be done through checksums.

HammerDB v4.0 New Features Pt4: Connect Pooling for Clusters

Prior to HammerDB v4.0 for the TPROC-C test there was the option to connect to one database instance only. If it was required to connect to multiple instances in a cluster then the Primary/Replica modes were used to create multiple HammerDB instances to connect to the separate database instances simultaneously. HammerDB has introduced a connect pool feature whereby a single instance of HammerDB can create a pool of multiple database instance connections with policies defined at the stored procedure level to determine how the individual stored procedures are run on which connections to the database instances. For example in an environment where there are primary read-write instances and secondary read-only it would be possible to define a policy whereby the neworder, payment and delivery stored procedures run against the read-write instance and stocklevel and orderstatus run against the read-only instance. Where there are multiple instances serving a similar purpose the policy can determine how an individual transaction is assigned. For example if there are three read write-instances then the neworder stored procedure can be defined to execute a transaction at each in a round-robin fashion or instead select an instance at random.

Connect Pool

To define the connect pool there are new XML files in the config/connectpool directory. These provide a template for the multiple connections with the same connection options for the standard interface defined in the connections section. The connections are named c, c2, c3 and so on with no limit on the number of connections that you define. There is also an sprocs section where you define what connections each stored procedure should use and what policy to apply, the policy can be  first_named, last_named, random or round_robin.

pgcpool.xml

When you have defined your configuration, select the XML Connect Pool option when loading the driver script. Your active Virtual Users will then use your XML defined connections and connect to each defined one thereby holding a pool of connections open to distribute the transactions to. For all databases the connect pool connections use prepared statements and once the connection is established will prepare statements for all of the stored procedures against each connection.

PostgreSQL XML Connect Pool

Within the driver script there is a commented line that can be uncommented to report details on all of the connections and prepared statements that are made.

postgresql connection information

Finally it is important to note that the main monitor connection continues to connect to the standard defined connection and reports NOPM and TPM from that single instance. Where a clustered environment such as Oracle RAC reports performance data for the entire cluster this will report cluster performance. If however you have defined connections to separate unrelated instances then this monitor connection will only report out for the instance it is connected to. For this reason where a database will not report performance data across the cluster the XML connect pool driver script will also report client side transactions for each Virtual User and in total to provide a guide to the workload directed to each instance.

The connect pool can be used in conjunction with other features such as use all warehouses and asynchronous connections. For more information on configuring the XML connect pool see the relevant section in the HammerDB documentation.

HammerDB v4.0 New Features Pt3: Refactored Stored Procedures

Another key feature introduced with HammerDB v4.0 is the refactoring of the stored procedures for some of the TPROC-C workloads. This means that the performance metrics reported in NOPM/TPM could be different from previous releases as well as the ratio between NOPM and TPM for these workloads. Therefore results from v4.0 may not be directly comparable with the results from previous releases for your database. The reason for these changes is that over time for some databases more advanced features or drivers have been introduced that improve performance since the time that the original HammerDB transactions or interfaces were written. These changes were contributed and accepted into HammerDB v4.0.

NOPM vs TPM

Firstly it is important to understand the metrics NOPM, TPM and the difference between them. The TPROC-C workload is derived from the TPC-C workload, the primary metric for TPC-C is called tpmC, the number of new order transactions processed per minute. As HammerDB TPROC-C is a derived workload it is not permitted to use tpmC and therefore instead uses a metric called NOPM that records the number of new order transactions processed per minute. Although a similar metric to tpmC it is not considered to be directly comparable. From HammerDB v4.0 NOPM should be considered the primary metric and is the only one that should be used for a cross database comparison. For this reason from HammerDB v4.0 NOPM is printed first.

NOPM Primary Metric

However for backward compatibility the generic.xml configuration file contains an option called first_result, setting this to TPM will print the results in the same format as v3.3 and earlier.

<benchmark>
...
<first_result>TPM</first_result>
...
</benchmark>

So why not just print NOPM and report a single metric for TPROC-C as per the official TPC-C workloads? The key reason is that HammerDB is intended to give us more insights into database performance and whereas NOPM is a cross-database comparable metric TPM is a database specific metric that can give more details on the workload and be related to other database specific metrics but cannot be compared between different databases. For example for the Oracle database the TPM value is calculated from the number of user commits + user rollbacks and you can query these metrics in the v$sysstat table during the test. This metric is the same used in Oracle tools such as AWR reports and as shown the TPM metric captured by HammerDB is exactly the same as Transactions and Rollbacks in the Load Profile section when these values are multiplied by a value of 60. This can then be used to compare with other Oracle specific metrics such as redo size and logical reads.

Load Profile

Per SecondPer TransactionPer ExecPer Call
DB Time(s):151.20.00.000.00
DB CPU(s):124.90.00.000.00
Background CPU(s):0.00.00.000.00
Redo size (bytes):862,578,321.35,390.2  
Logical read (blocks):10,369,967.864.8  
Block changes:5,009,042.831.3  
Physical read (blocks):498.80.0  
Physical write (blocks):23.60.0  
Read IO requests:329.70.0  
Write IO requests:2.20.0  
Read IO (MB):6.80.0  
Write IO (MB):0.20.0  
IM scan rows:0.00.0  
Session Logical Read IM:0.00.0  
User calls:122,685.10.8  
Parses (SQL):74,085.20.5  
Hard parses (SQL):0.00.0  
SQL Work Area (MB):155.90.0  
Logons:0.00.0  
User logons:0.00.0  
Executes (SQL):3,303,622.120.6  
Rollbacks:270.40.0  
Transactions:160,026.2 
Oracle AWR Report Load Profile

Similarly for SQL Server TPM records Batches/sec which is the same value seen in the Activity Monitor in SSMS. Using the database specific metric means that we can sample the transaction rate in real time for the HammerDB transaction counter whereas doing so for the NOPM value would impact the test by reading from a table being modified during the test. It can be seen from the example below that the HammerDB Transaction Counter

Transaction Counter

reports the same data per minute as Activity Monitor reports per second and can therefore be related directly to the other data that Activity Monitor provides such as Database I/O.

Activity Monitor

Refactoring Differences

When using HammerDB v4.0 the notable differences between TPM and NOPM rates than can be observed are as follows:

SQL Server

For SQL Server note that a change in the TPM metric was introduced at v3.3 and continues into v4.0. Initially these releases were planned close together however v4.0 was delayed to introduce UHD scalable graphics. The key difference is that in v3.2 the TPM value is reported as 2X the value of v4.0 (and v3.3) due to a change in the SQL Server driver interface used. The reason for the change was that there was a bug raised for the previous ODBC v1 interface tclodbc the bug meant that the 3rd party library would crash if SQL Server was shutdown during a test and then the Virtual Users subsequently closed after they had correctly reported the error. The fix to this was to move to a newer ODBCv3 interface called tdbc::odbc. The previous tclodbc interface required 2 commits per transaction one in the stored procedure and one outside in the driver script. If the external one was removed or commented then the driver would error saying that the connection was already in use by a previous command. Moving to the newer interface this external commit was no longer needed and was removed, as a result the TPM value has reduced however the NOPM value is exactly the same. (From tests it should be slightly higher with the newer ODBC v3 interface). It is important to note that as far as the HammerDB TPROC-C workload is concerned it is not doing any more work as such – just doing one less commit for the same work. If you compare the driver scripts for the different versions you can observe where the extra commit that was removed. For comparisons with previous releases NOPM can be used unmodified as the primary metric or the TPM value multiplied by 2X to account for the removed commit.

Oracle

For Oracle from v4.0 the stored procedures have been updated to use bulk processing features. As we are now doing bulk operations  we are processing more changes per database commit and this can seen in an AWR report that the redo generated per transaction has also increased from v3.3 to v4.0.  For this reason the NOPM value has increased whilst the TPM value has remained level, therefore the TPM to NOPM ratio has changed for Oracle between these releases. This has been measured at 3.0X TPM to NOPM for v3.3 and earlier but has reduced to 2.11X for v4.0. Therefore HammerDB v4.0 improves the Oracle performance by approximately 1.35-1.45X measured in NOPM for the same TPM. This improvement in NOPM is a recognition of actual improved TPROC-C transactional throughput by using advanced PL/SQL features.

PostgreSQL

The PostgreSQL stored procedures and functions have undergone similar changes as Oracle to take advantage of bulk processing features. These changes have improved NOPM and TPM by approximately 1.35X in HammerDB v4.0 compared to previous releases and is also a recognition of the use of more advanced features.

In conclusion in v4.0 HammerDB has undergone a number of evolutionary changes for some of the database workloads that impact performance results when compared to earlier versions. These differences should be accounted for when comparing results. Although the aim is to keep performance as consistent as possible between releases wherever possible as some databases had introduced new features or newer more advanced interfaces were available it was considered reasonable to modify the stored procedures or use these new interfaces to use available features even though reported results are different in the newer version.

It is also important to note that HammerDB is open source and therefore if it is considered that there are underused features in any of the supported databases then a pull request can be made to ensure that those features are fairly represented in the results reported by HammerDB. The overall goal is to remain consistent as possible whilst providing an accurate representation of the capabilities that each supported database provides as their features are updated and improved.

HammerDB v4.0 New Features Pt2: Scalable UHD Graphics

Up to version 3.3 the HammerDB GUI operated with a fixed scaling factor of 1.33 pixels per point. That means regardless of monitor resolution HammerDB was set to use a fixed number of pixels. Therefore on a higher resolution screen as shown the HammerDB GUI would appear smaller than on a standard DPI display.

HammerDB v3.3 on UHD

For most purposes this did not present an Issue and the HammerDB display rendered correctly up to 1920 x 1080 Full HD displays. However a GitHub Issue was raised because once moving to UHD displays with a pixel density beyond 1920×1080 the HammerDB interface became too small for use. Additionally these type of displays on devices such as PixelSense on Microsoft Surface Book were popular for presentations and demos and therefore the task was to update the HammerDB display to support scalable graphics. This meant that HammerDB would detect the display density and size the application interface accordingly. At HammerDB v4.0 the graphical interface has been extensively updated as shown to support UHD displays with pixel densities beyond 1920 x 1080 on both Windows and Linux.

HammerDB v4.0 on UHD

To achieve this scaling it was necessary to move from fixed PNG based graphics to SVG requiring all graphics and icons to be regenerated in the updated format and the interface rewritten to use SVG. Similarly it was necessary to use scalable fonts to ensure that the text scaled alongside the graphics. It was also needed to move to updated themes so that all dialogs and options scaled alongside the main display. With the move to the updated nomenclature of TPROC-C and TPROC-H already needing extensive re-documentation it was decided to delay the release of v4.0 in summer 2020 to invest the time in rewriting the interface to ensure usability on devices such as PixelSense displays.

Once the main interface was updated it was also necessary to update the transaction counter, otherwise the fixed display would have continue to render at a smaller size within the updated interface.

Transaction Counter

Similarly the CPU Metrics display was modified to scale in proportion to the main interface.

CPU Metrics

Finally it was needed to update the graphical Oracle metrics with the same scalability settings. Although this feature is only available for Oracle at v4.0 the plan is to make it available for other databases with future releases.

Oracle Metrics

With these changes the entire HammerDB application supports scalable graphics with the feature tuneable by the settings in the generic.xml file in the config directory.

<theme>
<scaling>auto</scaling>
<scaletheme>auto</scaletheme>
<pixelsperpoint>auto</pixelsperpoint>
</theme>

By default all of the theme settings are set to auto and this is the recommended configuration. However they can be modified if required. Firstly the scaling setting can be changed to fixed to revert to the previous fixed non-scaling graphics. This could for example be used when using a remote X-windows display for faster graphics rendering when a faster alternative such as VNC is not available. For the scaletheme you can use settings of “auto”, “awlight”, “arc” or “breeze”, with “awlight” the default on Linux and “breeze” the default on Windows, with the plan to introduce more theme options over time.

awlight theme

Finally pixelsperpoint is for expert usage to fine tune the scaling of HammerDB according to different screen settings.

Now that HammerDB is available with scalable graphics from v4.0 there is no longer any barrier to running database performance presentations and demos from devices with UHD displays.

HammerDB v4.0 New Features Pt1: TPROC-C & TPROC-H

One of the key differences that stands out with HammerDB v4.0 compared to previous releases is that the workload names have changed from TPC-C and TPC-H to TPROC-C and TPROC-H respectively and therefore a key question is how are the v4.0 workloads different from the previous releases of v3.3 and earlier, what has changed and how does this impact interpreting results? The simple answer is nothing, the workloads are exactly the same workloads derived from the TPC-C and TPC-H specifications and HammerDB v4.0 can be seen as a continuation and enhancement from previous releases, only the name has changed, not the workload itself.  From an engineering perspective this may be all that you need to know. However a reasonable follow-on question is then why change the name at all? This post aims to give some of the background to the change and provide you with the information of where and how the TPROC-C and TPROC-H differ from a ‘real’ TPC-C and TPC-H respectively.

First of all it has always been clear in the HammerDB documentation that the TPROC-C/TPC-C and TPROC-H/TPC-H workloads have not been ‘real’ audited and published TPC results instead providing a tool to run workloads based on these specifications.  For example HammerDB has not used tpmC terminology to report TPC-C based metrics instead using TPM and NOPM nomenclature.  Initially from TPC documentation it was not specified whether using TPC-C and TPC-H terminology for derived workloads was permitted. Additionally both commercial and open source tools based on the specifications also continued to use TPC-C and TPC-H to describe these workloads.  This has now been made explicitly clear, using TPC-C or TPC-H for a non-compliant workload to the full specification is a trademark violation.  For this reason HammerDB has changed the workload names to be legally compliant.  Any tools using TPC-C, TPC-H (or other trademarked TPC workload names) for tools or workloads both commercial and open source should also consider renaming for trademark compliance purposes or take legal guidance.

But why is this important? Surely it was clear that as a derived workload HammerDB results were not actual fully audited TPC results so that this non-compliance was implicit? In the vast majority of cases this was the case and even when using TPC terminology it was clear that using for example TPC-C meant “derived from TPC-C”. However there were cases where intermediate understanding based on some familiarity with the specifications (but without the implicit understanding that the difference was already clear) have questioned the validity of published performance data by users based on this implicit understanding. This change makes that difference explicit and puts everyone on the same page, TPROC-C means derived from TPC-C.

So why derive a workload from TPC-C or TPC-H at all and instead just rely on vendor published and fully audited results? This question is the very essence of what HammerDB is, a tool that takes the well designed and scalable TPC-C and TPC-H specifications and implements a workload derived from them that is accurate and repeatable yet tests database capabilities to the full (compared to alternative simple 1-table no contention workloads) so that running database performance benchmarks becomes fast, low cost and accessible to all, making database benchmarks open source thereby allowing anyone to compare the performance of their databases.

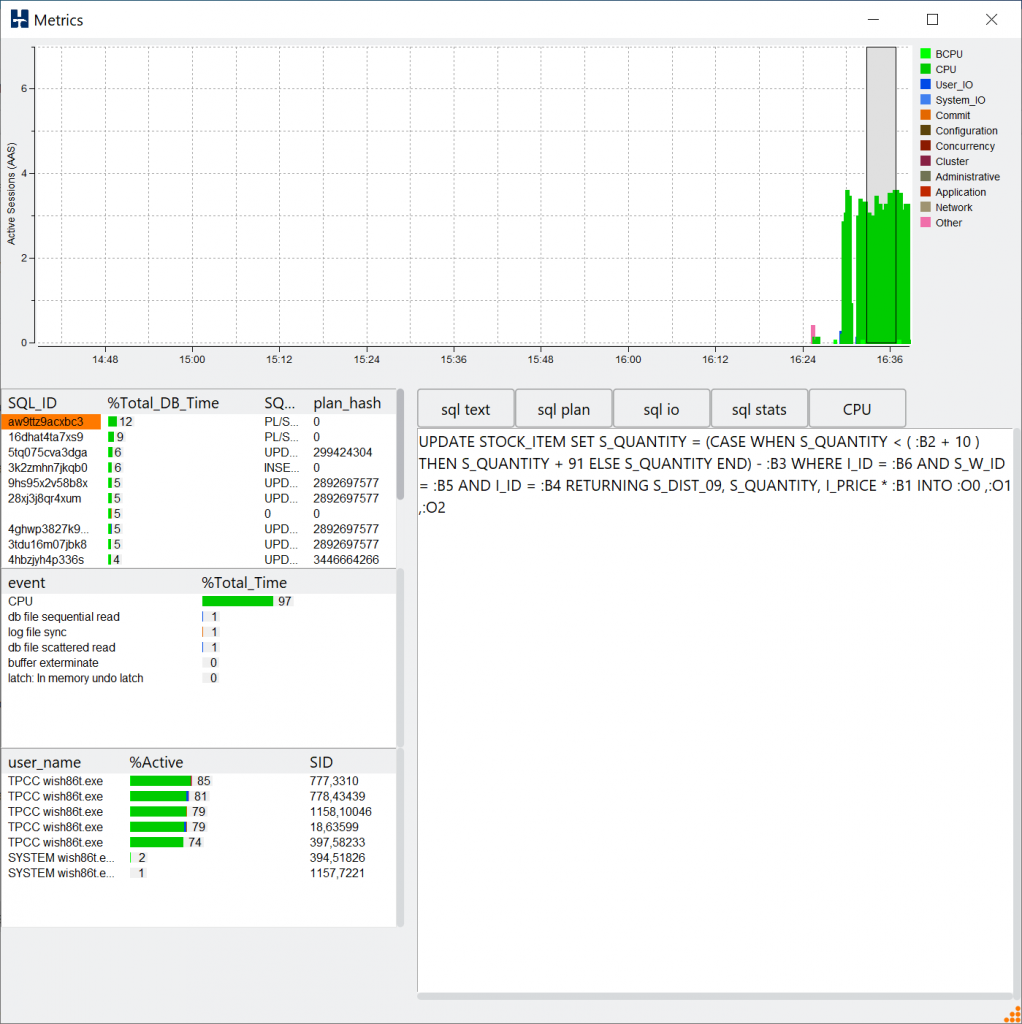
A full understanding of why this is important requires some knowledge of the evolution of database hardware and software.  The HammerDB TPROC-C workload by design intended as CPU and memory intensive workload derived from TPC-C – so that we get to benchmark at maximum CPU performance at a much smaller database footprint.  In the days before highly performant SSDs and persistent memory, database benchmarks had a significant challenge in comparing performance due to the available I/O performance.  For TPC-C this meant enough available spindles to reduce I/O latency and for TPC-H enough bandwidth for data throughput.  Fully audited configurations would require multiple racks of I/O capacity to reach maximum CPU performance. This was both expensive and time consuming to configure.  Even with superior I/O performance today the I/O configuration required on-premise or in the cloud remains costly.

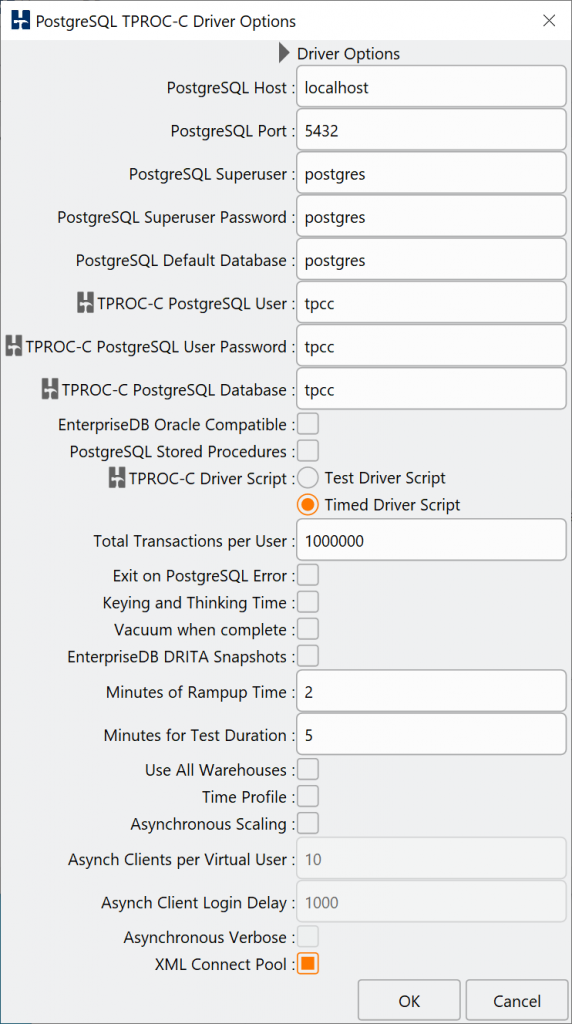
Additionally a fully audited benchmark requires multiple client servers to sustain the large volume of clients as well as a TP Monitor (Transaction Processing Monitor) This TP monitor acts as middleware transferring the transactions between the clients and the database server.  The challenge was how to take the essence of the TPC specifications that are made available for free and implement the workloads in a method that maximises CPU performance and can be run on anything from laptops to servers without the significant expense of I/O capacity and multiple client servers to run the workloads.  Therefore for HammerDB TPROC-C we eliminated keying and thinking time and eliminated the requirement for terminals. This meant we could dispense with the TP-monitor, reduce the number of clients, reduce the storage and the schema size but still run similar transactions to the TPC-C specification so that it was running a scalable and repeatable workload in a CPU and memory intensive manner.

Over time since we first ran HammerDB workloads we noticed that the CPU generation to generation performance ratios between systems was the same with this CPU intensive default mode as the official published TPC-C benchmarks. I.e. if system A generated 1.5X more transactions than system B in the fully audited benchmark then the HammerDB result was also 1.5X better.  Consequently we were getting very similar insights both faster and cheaper meaning we could test orders of magnitude more configurations in the same amount of time generating relative performance ratios.

Why would this be the case?  Surely if the database schema is smaller, the workload more intensive, and there is not the same I/O capacity demands then the results would be different. The key aspect is the presence of the TP Monitor and this is arguably the area where the most confusion arose in stating that a HammerDB TPC-C workload was not an actual TPC-C workload which should have already been clear. Typically in a fully audited TPC-C the client sessions are not connecting directly to the database with many 1000’s of sessions. Instead all of the client servers are connecting to the TP monitor.  This is not a new concept, as given in the description for the earlier TPC-B workload  “a transaction monitor can multiplex transaction streams to match the processing profile of the database subsystem. For example, 1000 user terminals would present transactions with human think times and delays, and the transaction monitor will concentrate them down to a steady stream of, say, 50 concurrent processes.”   Therefore the actual database server workload is both CPU and memory intensive with actual connections typically numbered in the hundreds processing transactions for the clients managed by the TP monitor.  HammerDB eliminates this stage instead implementing a workload that connects the steady stream of transactions directly to the database.  Additionally because the number of Virtual Users is lower for the HammerDB   default mode (see below for alternatives) each Virtual User will choose a home warehouse at random. Once that home warehouse is chosen then most of the work takes place against that warehouse – therefore for example you hit max CPU at 200 VUsers then most of the work is on 200 warehouses regardless of how many you have created.  As the home warehouse is chosen at random however you want enough to ensure an even spread of Virtual Users across the warehouses. Therefore the general advice is 250-500 warehouse per socket and for example a starting point of 1000 warehouses for a 2 socket server regardless of the database is a good starting point. This is also the reason why the default maximum number of warehouses is 5000. You can change this if you wish, however this limit is set to prevent a typical error of over configuring the database size in the expectation that it will improve performance.

Nevertheless more recently SSDs and persistent memory are lowering the price points for high performance I/O increasing the desire to test more I/O that wasn’t there when people needed to buy a dedicated storage array to do so. For this reason beyond the default mode there are the 3 more advanced features:

  1. Use All Warehouses (Choose a new warehouse per transaction)
  2. Event driven scaling (asynchronous clients with keying and thinking time)
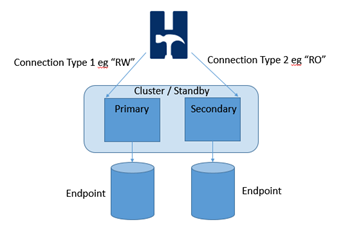
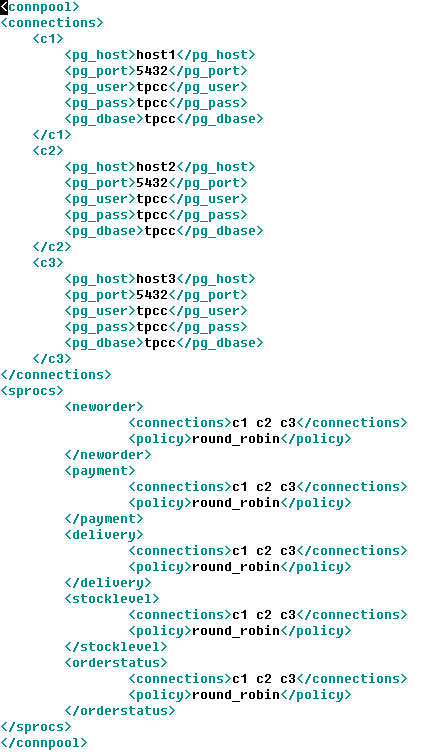
  3. XML Connect Pooling (test distributed clusters)

These can be used separately or together for the sort of scenarios where it is desired to increase the I/O load, the number of Virtual Users or to test a distributed environment.  However to test a large number of Virtual Users with event driven scaling will need increasing the number of HammerDB clients with primary and replica modes and you will also need to implement a form of middleware to concentrate these connections. Therefore you are moving away from a more agile and rapid form of testing to more complex configurations.  You are entirely in control of your test environment and therefore the choice is yours dependent on the scenarios you wish to test rather than being bound by a more rigid specification.

In terms of analytics and the TPROC-H workload derived from TPC-H, this specification  does not require middleware so when running TPROC-H you are close to the specification,  however there remain differences.  For example the TPC-H specification includes measuring database load times that is beyond the scope of HammerDB and you may wish to implement features such as in-memory column stores, partitioning and compression to improve performance. HammerDB cannot implement advanced features that may not be available in all test environments and therefore builds a base configuration that would be available to all. The user can then modify the schema as they wish. For this reason TPROC-H is also a workload derived from TPC-H and has moved away from providing information on calculating the QphH figure to focusing on actual query times for power and throughput tests and a total geometric mean of query times.

In conclusion, TPROC-C and TPROC-H are the new names for the same HammerDB specific workloads that mean “derived from TPC-C” and “derived from TPC-H” respectively to make running workloads based on these specification both faster and cheaper and available to all.  Official TPC-C and TPC-H compliant results can as has always been the case only be found on the official TPC website.