The information in this post is a duplicate of this GitHub Issue https://github.com/TPC-Council/HammerDB/issues/84. The issue regards running build and driver scripts automatically in Windows. As both build and driver examples are not given together in previous posts, the examples are copied here. This is intended as a template that you can take and modify for your own needs.
A few things to note. Firstly these scripts are multithreaded so once you do build schema and vurun it is running multiple threads. We need a different approach for both because in the schema build we are waiting for all of the virtual users to finish (vwait forever), however for the driver we are waiting for a set period of time before terminating them. For the build I have created more warehouses but with 5 virtual users to show the multithreaded nature of the build. For the driver we have set a rampup and duration of 3 minutes in total (180 secs) – this runs in the virtual users, then in the main monitor virtual user it runs a timer – this is set to 200 seconds more than the rampup and driver combined (if it is less it will terminate the test before ending).
With both I copied the scripts to C:\Program Files\HammerDB-3.3. I then did:
hammerdbcli.bat auto autorunbuild.tcl
and
hammerdbcli.bat auto autorundrive.tcl
When both are complete the shell will exit as intended therefore it is a good idea to set logtotemp to ensure that you receive both the output and errors (for example if the build script exits because the database already exists).
Build Script – autorunbuild.tcl
puts "SETTING CONFIGURATION"
global complete
proc wait_to_complete {} {
global complete
set complete [vucomplete]
if {!$complete} { after 5000 wait_to_complete } else { exit }
}
puts "SETTING CONFIGURATION"
dbset db mssqls
diset connection mssqls_server {(local)\SQLDEVELOP}
diset tpcc mssqls_count_ware 10
diset tpcc mssqls_num_vu 5
vuset logtotemp 1
buildschema
wait_to_complete
vwait forever
Driver Script – autorundrive.tcl
#!/bin/tclsh
proc runtimer { seconds } {
set x 0
set timerstop 0
while {!$timerstop} {
incr x
after 1000
  if { ![ expr {$x % 60} ] } {
          set y [ expr $x / 60 ]
          puts "Timer: $y minutes elapsed"
  }
update
if {  [ vucomplete ] || $x eq $seconds } { set timerstop 1 }
    }
return
}
puts "SETTING CONFIGURATION"
dbset db mssqls
diset connection mssqls_server {(local)\SQLDEVELOP}
diset tpcc mssqls_driver timed
diset tpcc mssqls_rampup 1
diset tpcc mssqls_duration 2
vuset logtotemp 1
loadscript
puts "SEQUENCE STARTED"
foreach z { 1 2 4 } {
puts "$z VU TEST"
vuset vu $z
vucreate
vurun
#Runtimer in seconds must exceed rampup + duration
runtimer 200
vudestroy
after 5000
}
puts "TEST SEQUENCE COMPLETE"
A recommended editor that recognises TCL syntax for editing HammerDB script is Vim.
The HammerDB workload derived from TPC-C contains a feature to record the response times for the stored procedures that are run in the logfile. This post shows how you can easily convert this data into spreadsheet format to view the response times you have captured over a run.
Firstly, to activate the time profile feature select Time Profile for the GUI or the set the equivalent parameter in the CLI to true.
Time Profile
You can note that when loaded the driver script is modified to report response times for the first active virtual user running the workload. (Only the first virtual user is tracked to minimise the impact on the workload). This data is reported every 10 seconds into the HammerDB log. The output is in percentile format reporting the minimum, 50th percentile, 95th percentile, 99th percentile and maximum for each of the procedures during that 10 second interval with an extract shown below.
In text from this data can be useful, however often it is better to view this in graphical form. The simple script below can be run at the command line and provided with a logfile with the data for one run only. (Note that it is important that to convert you only provide a logfile for that to convert, otherwise all of the data will be combined). When run on a logfile with data such as shown above this will output the data in tab delimited format that can be interpreted by a spreadsheet.
In this example we run the script above, pass the name of the logfile for the run where response times were captured and output them to a file with a spreadsheet extension name. Note that it is important to output the data to a file and not to a terminal with that data then cut and paste into a spreadsheet. If output to a terminal it may format the output by removing the tab characters which are essential to the formatting.
$ ./extracttp.tcl pgtp.log > pgtp.txt
If we look in this file we can see that it has extracted the data and output them into rows with the extracted values.
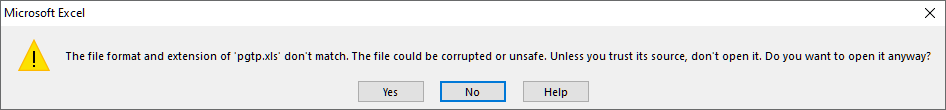
We now have an option. In testing with Excel 2013 we can simply give this file a .xls extension and open it. If we do it will give the following warning, however if you click OK it will open with the correctly formatted data.
Excel extension
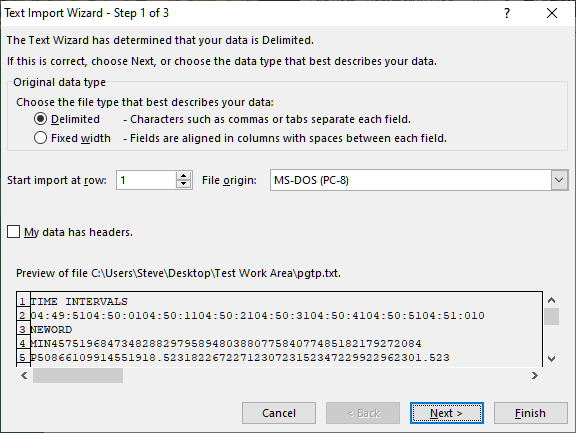
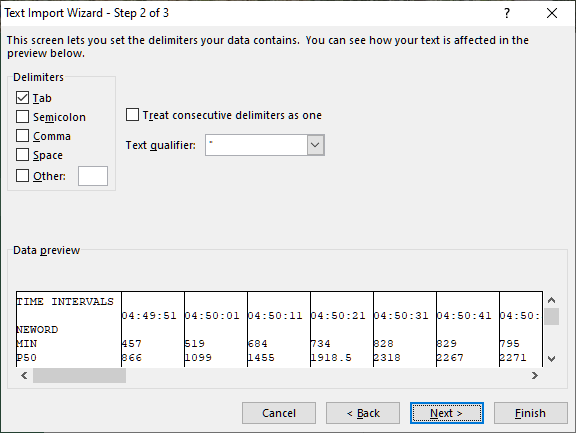
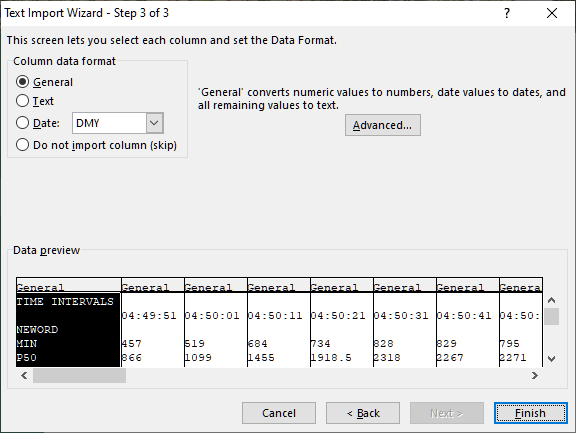
Alternatively if we open the file with the .txt extension it will show 3 steps for the Text Import Wizard. Click through the Wizard until Finish.
Text Import 1Text Import 2Text Import 3
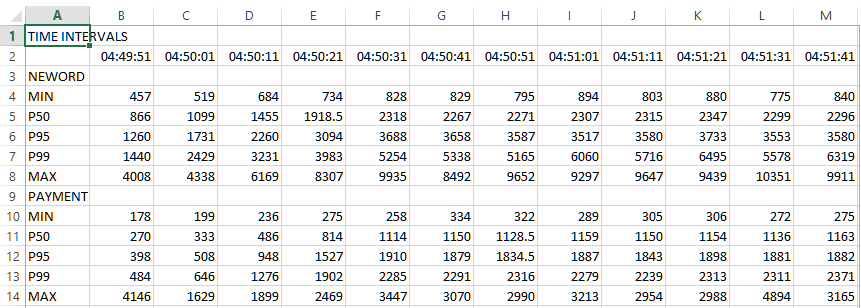
After clicking Finish the data has been imported into the spreadsheet without warnings.
Imported Data
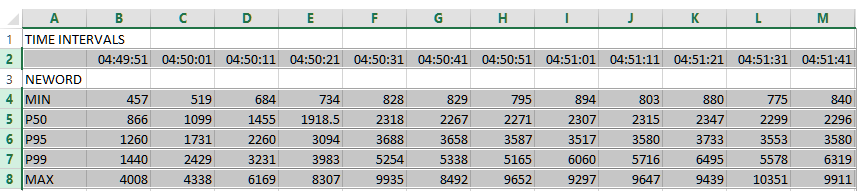
As an example we will highlight the rows we want to graph by clicking on the row numbers.
Highlighted Spreadsheet
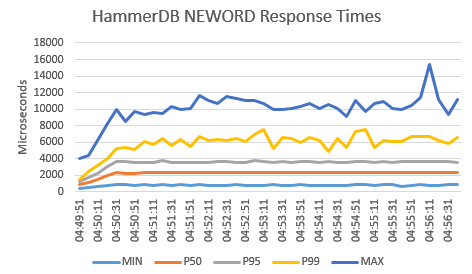
If we then click on Insert and Recommended Charts, the default graph produced by Excel is shown below with the addition of a vertical axis title and a chart header.
Finally make sure when saving the spreadsheet it is saved in Excel format rather than the imported Tab (Text Delimited).
With this approach it is straightforward to turn the captured response times into a visual representation to being further analysis to your workloads.
HammerDB v3.3 includes a new feature called event driven scaling to enable the scaling of virtual users to thousands of sessions running with keying and thinking time enabled. This feature adds additional benefit to your testing scenarios with the ability to handle large numbers of connections or testing with connection pooling. This post explains the benefits that this feature brings and how to enable it.
When running transactional workloads with HammerDB the default mode is CPU intensive meaning that one virtual user will run as many transactions as possible. As an example we will run a simple test by creating a 10 warehouse TPC-C schema and configuring a single virtual user to run a test in this default mode.
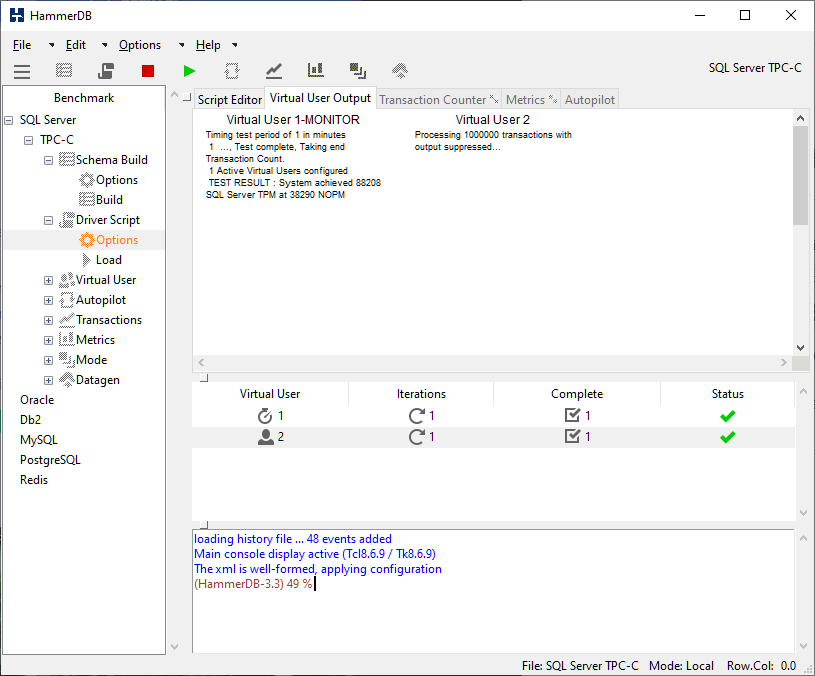
Once we’ve created this Virtual User and run the test for 1 minute on a simple PC configuration we receive a result showing that the Virtual User ran many thousands of transactions a minute.
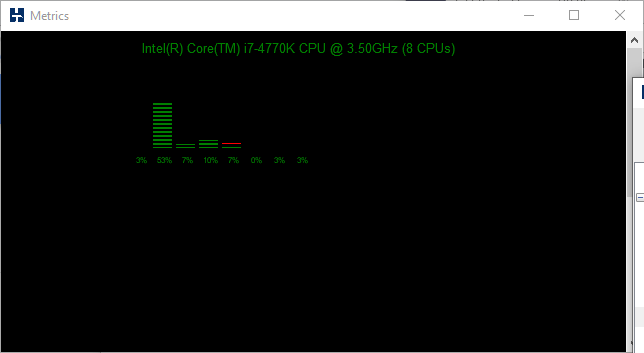
Using HammerDB metrics we can also see that this single Virtual User was using a fair amount of CPU.
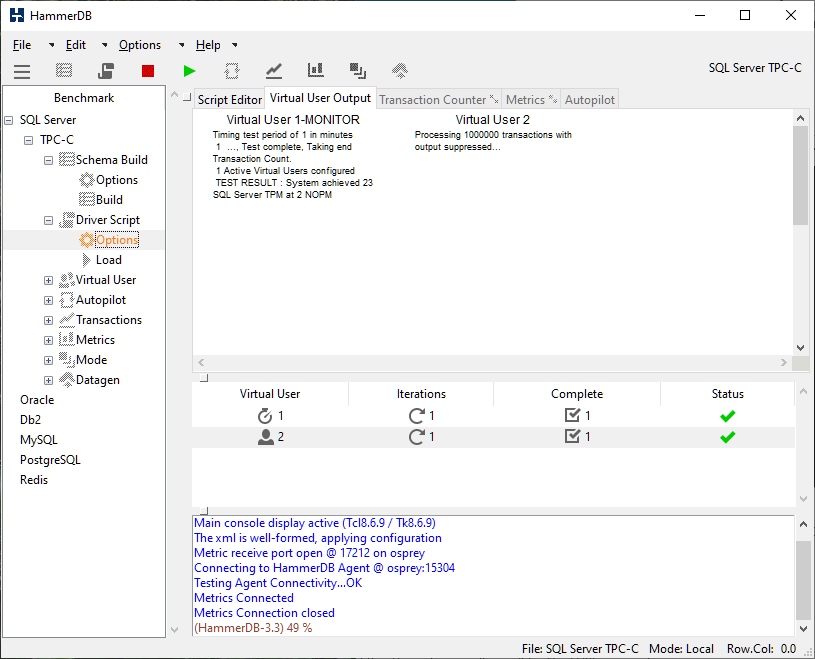
Now lets select keying and thinking time by checking the “Keying and Thinking Time” option we can now see that the transaction rate has dropped considerably.
It is clear that we would need to create a large number of Virtual Users to even begin approaching the same number of transactions that a single virtual user could process without keying and thinking time. Event driven scaling is a feature that enables each Virtual User to create multiple database sessions and manage the keying and thinking time for each asynchronously in an event-driven loop enabling HammerDB to create a much larger session count. It should be clear that this feature is only designed to work with keying and thinking time enabled as it is only the keying and thinking time that is managed asynchronously.
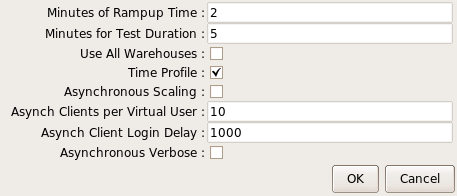
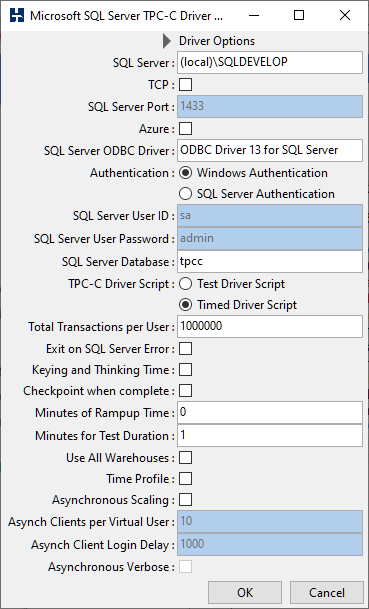
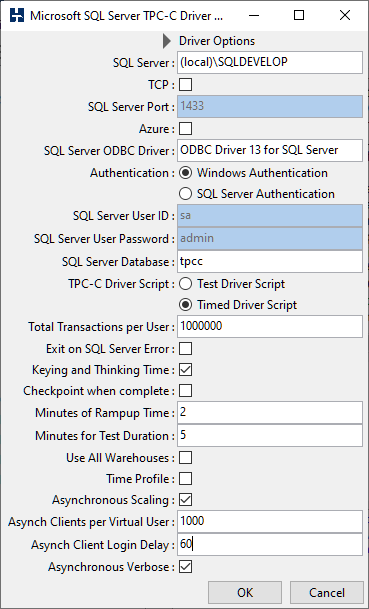
To configure this feature we now select Asynchronous Scaling noting that Keying and Thinking Time is automatically selected. We have also selected a 1000 clients for our one Virtual User and a Login Delay of 60ms. This means that each client will wait for 60ms after the previous client has logged in before then logging in itself. Finally we have chosen verbose output. Note that with this feature it is important to allow the clients enough time to both login fully before measuring performance and also at the end it will take additional time for the clients to all complete their current keying and thinking time and to exit before the virtual user reports all clients as complete.
We now create a single virtual user as before. However this time once all the clients have connected we now see that there are the 1000 asynchronous clients connected to the test database.
SELECT DB_NAME(dbid) as DBName, COUNT(dbid) as NumberOfConnections FROM sys.sysprocesses WHERE dbid > 0 GROUP BY dbid;
DBName
NumberOfConnections
master
43
tempdb
1
tpcc
1003
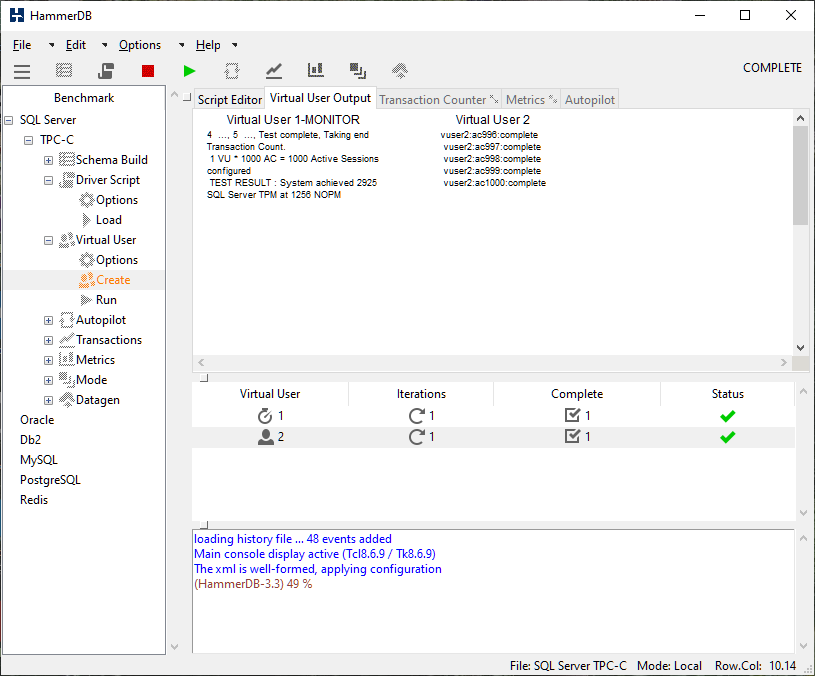
When the workload has completed (noting as before that additional time must be given to allow all of the asynchronous clients to complete their work and log off) we can see that HammerDB reports the active sessions based on the asynchronous client count and the transaction rate for the single virtual user is considerably higher with keying and thinking time.
The event driven scaling feature is not intended to replace the default CPU intensive mode of testing and it is expected that this will continue to be the most popular methodology. Instead being able to increase up client sessions with keying and thinking time adds additional test scenarios for highly scalable systems.