
In HammerDB v4.7 introduced the concept of Jobs to the CLI, a central repository to store workload output, configuration and results. v4.8 extends this functionality to the GUI and adds a Web Service to view and visualize this Job related data.
Turning Jobs Off and On
Of course one of the most important aspects is to be able to disable the functionality. To turn the functionality on or off in the CLI use the jobs disable command.
hammerdb>jobs disable 1
Disabling jobs repository, restart HammerDB to take effect
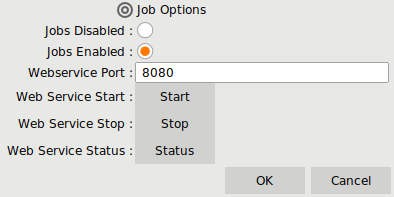
and in the GUI use the Jobs Disabled/Enabled option.
Configuring the Jobs Database
The base configuration is set in the xml files in the config directory with the jobs SQLite database being set in the commandline section of generic.xml by specifying the filename. So for example to change this to hammer.db in in the DATA directory, set this as follows:
<commandline>
    <sqlite_db>/opt/HammerDB-4.8/DATA/hammer.db</sqlite_db>
       <keepalive_margin>10</keepalive_margin>
       <jobsoutput>JSON</jobsoutput>
       <jobs_disable>0</jobs_disable>
</commandline>
Then HammerDB will initialize this database
$ ./hammerdbcli
HammerDB CLI v4.8
Copyright (C) 2003-2023 Steve Shaw
Type "help" for a list of commands
Initialized new Jobs on-disk database /opt/HammerDB-4.8/DATA/hammer.db
Note that this is the Jobs SQLite database. We also have the configuration SQLite databases that persists the configuration over restarts. This also includes the jobs SQLite database location, so after the configuration SQLite databases are created then changes to the XML files are not re-read until the files are deleted (or it detects a different version of HammerDB and will refresh them automatically).
Therefore the best approach is to leave the configuration as the default of TMP and set an environment variable to the preferred location. On Linux it will look for environment variables TMP, TMPDIR, or TEMP and then finally look for /tmp. On Windows it will look for TEMP, TMP, TMPDIR or finally C:. for example, on Linux.
$ export TMP=`pwd`/TMP
$ ./hammerdbcli
HammerDB CLI v4.8
Copyright (C) 2003-2023 Steve Shaw
Type "help" for a list of commands
Initialized new Jobs on-disk database /opt/HammerDB-4.8/TMP/hammer.DB
This database will be used by both the CLI and GUI and can be moved or removed as preferred. When jobs are enabled, if the database file does not exist in the specified location, it will be recreated.
Running a workload
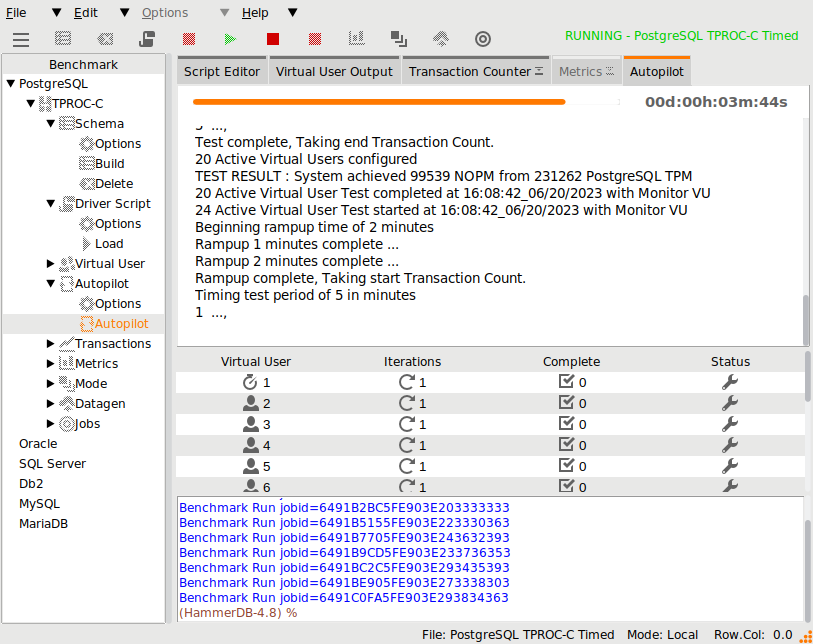
Jobs only modify how output is stored and not how the workload itself is run. In this example, we will run a PostgreSQL TPROC-C autopilot workload to generate some jobs to analyse. Note that if we want to capture a transaction count during a run, then the transaction counter must be enabled and similarly if we want to capture timing data this option must be enabled.
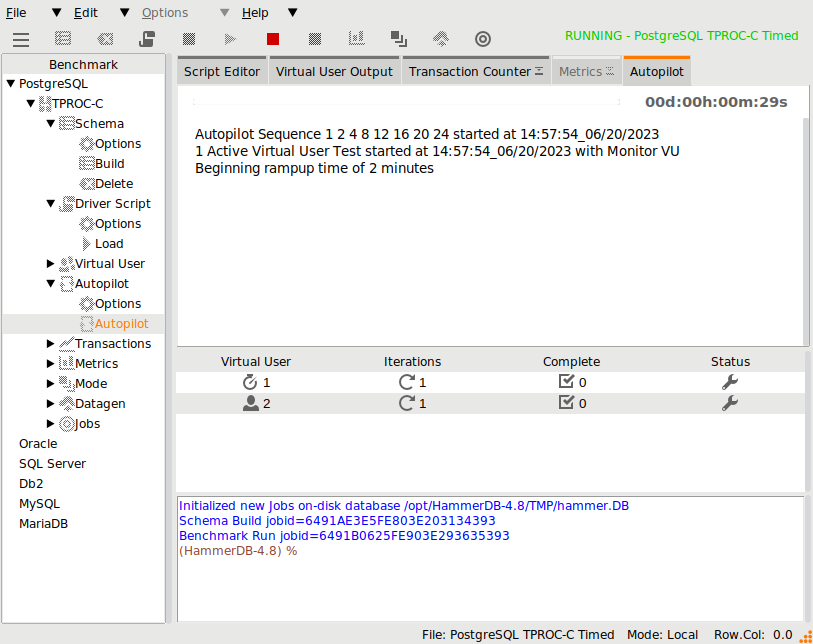
We can see that a Job id is created each time a new workload is run.
Starting and Stopping the Web Service
To start and stop the Web Service under the GUI select the Jobs Options under the Tree menu.
The options enable you to start/stop and query the status of the Web Service.
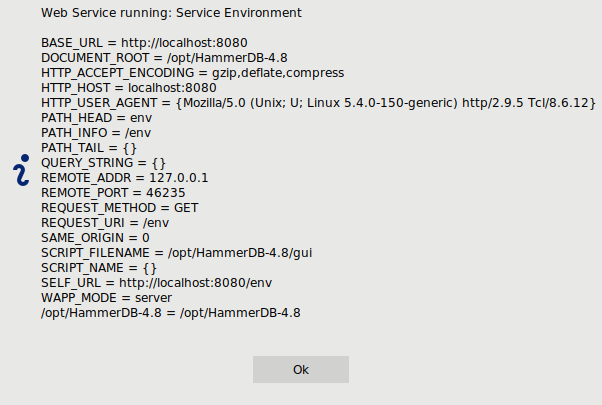
When running, the status will show the Web Service environment.
Note that on Windows, security features may prevent you opening the port which is by default 8080 and therefore you may need to review the additional options for starting and stopping the Web Service. Therefore we will give examples on Windows, however the commands are the same on Linux as well.
Under the CLI you have the command wsstart, wsstop and wsstatus for the same functionality as the GUI. Also the command wsport can query and change the port the Web Service runs on.
HammerDB CLI v4.8
Copyright (C) 2003-2023 Steve Shaw
Type "help" for a list of commands
Initialized Jobs on-disk database C:/Users/hdb/AppData/Local/Temp/hammer.DB using existing tables (245,760 KB)
hammerdb>wsstart
HammerDB Web Service v4.8
Copyright (C) 2003-2023 Steve Shaw
Type "help" for a list of commands
Starting HammerDB Web Service on port 8080
hammerdb>wsstop
Stopping HammerDB Web Service on port 8080
hammerdb>wsstatus
Web Service not running: connect failed connection refused
hammerdb>wsport
Web Service Port set to 8080
You can also run the Web Service directly from a command prompt with the additional options of wait/nowait and gui, with wait, waiting without a CLI prompt, nowait returning a prompt that enables querying the interface directly (with the help command providing a list of commands) and gui that returns no output at all (as run by the GUI).
C:\Program Files\HammerDB-4.8>hammerdbws wait
HammerDB Web Service v4.8
Copyright (C) 2003-2023 Steve Shaw
Type "help" for a list of commands
Starting HammerDB Web Service on port 8080
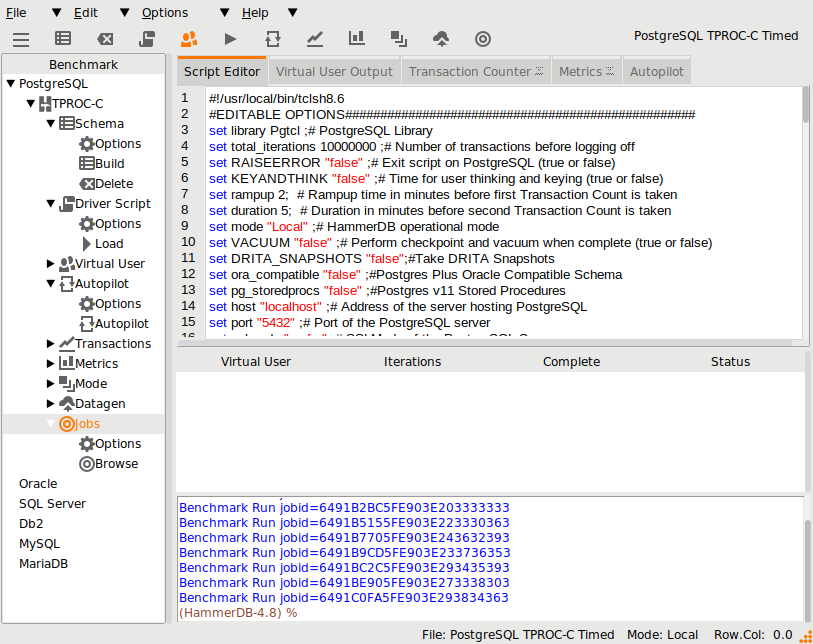
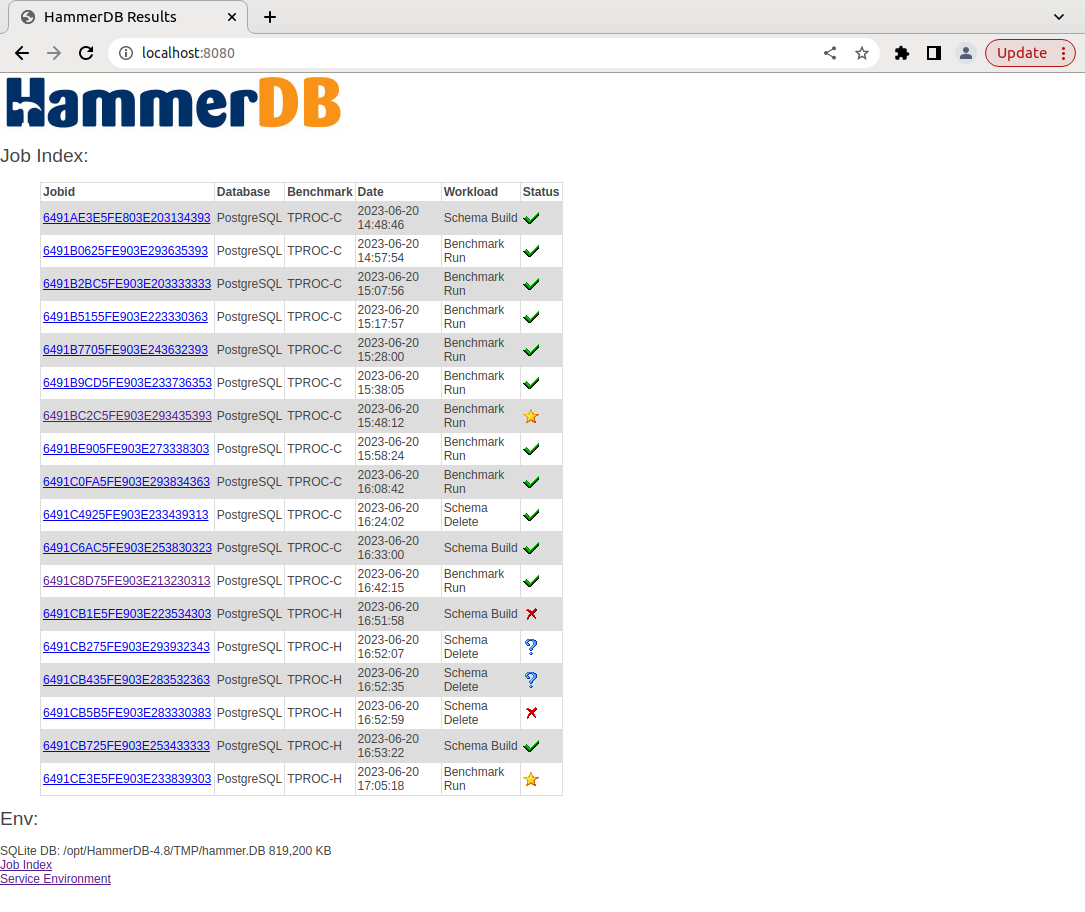
Querying Jobs
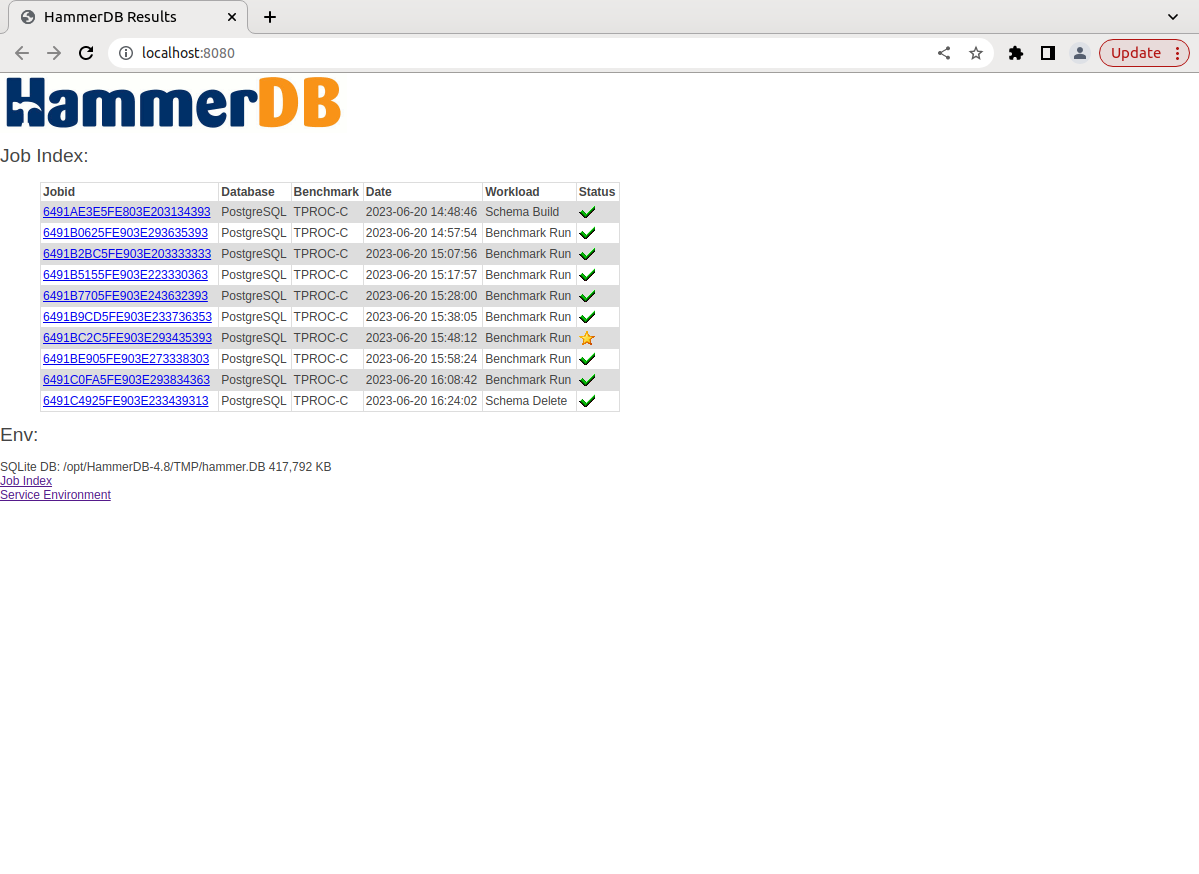
With the Web Service running, we can start a browser from the GUI with the Browse option or run a browser directly to the port we have configured. We can now see the list of Jobs we generated with autopilot, that they all ran successfully, and also pinpoint the highest performance.
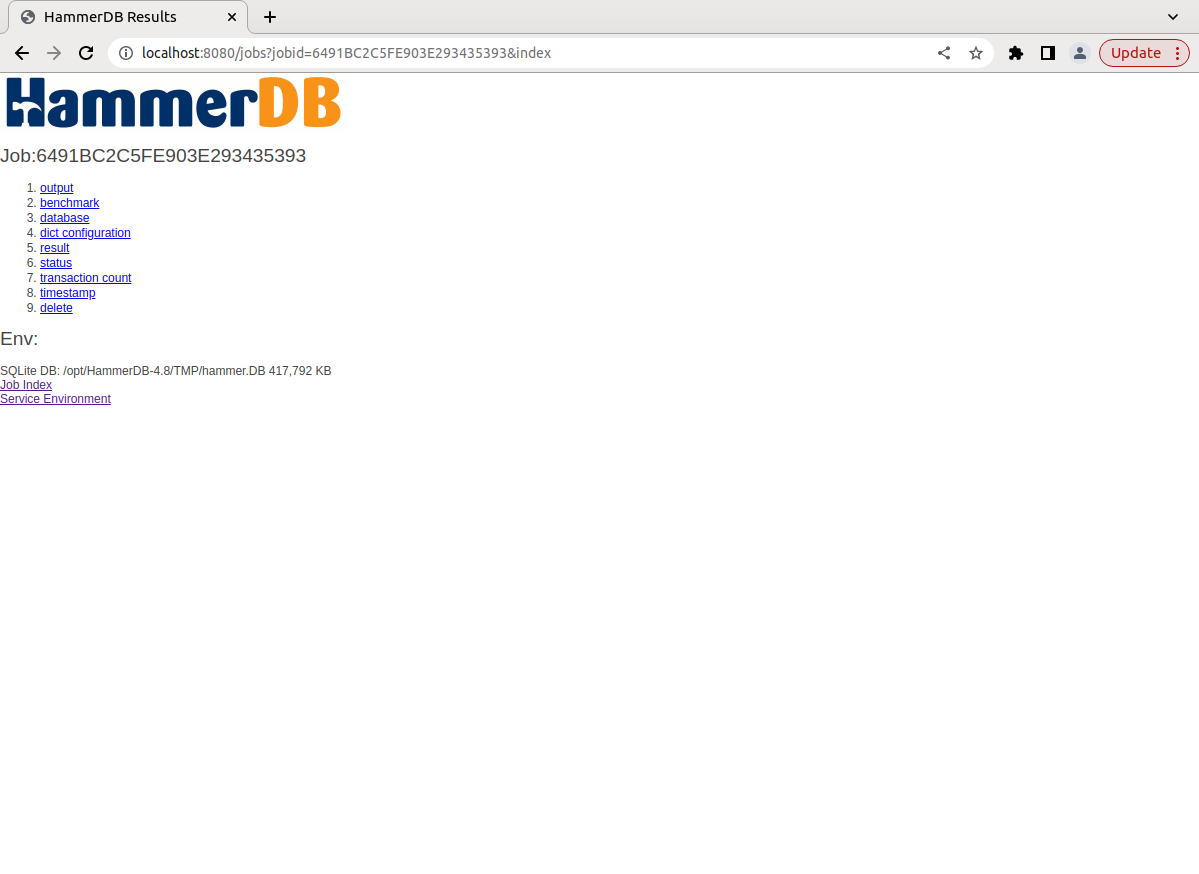
We can now drill down on an individual job to view its configuration and output.
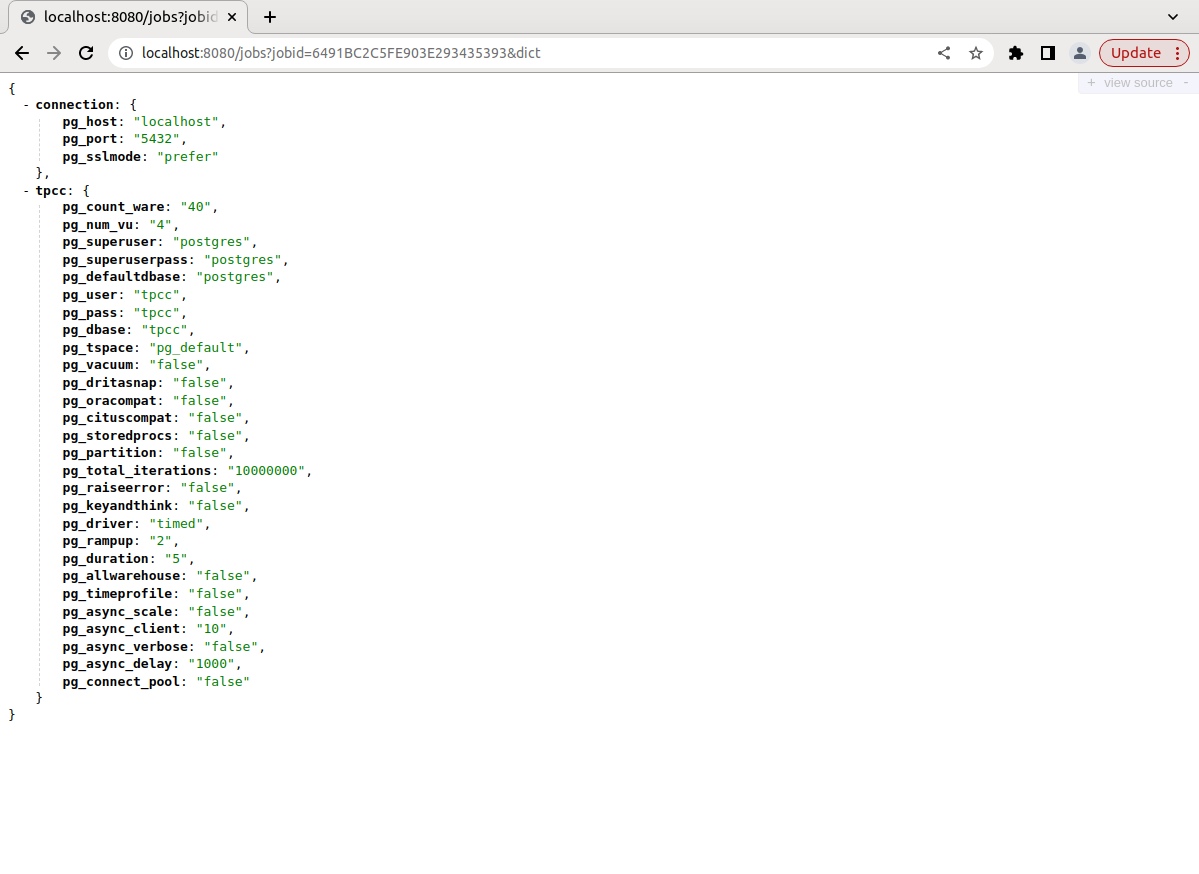
Text based data will be shown in JSON format, with the example showing the full workload configuration at the time it was run.
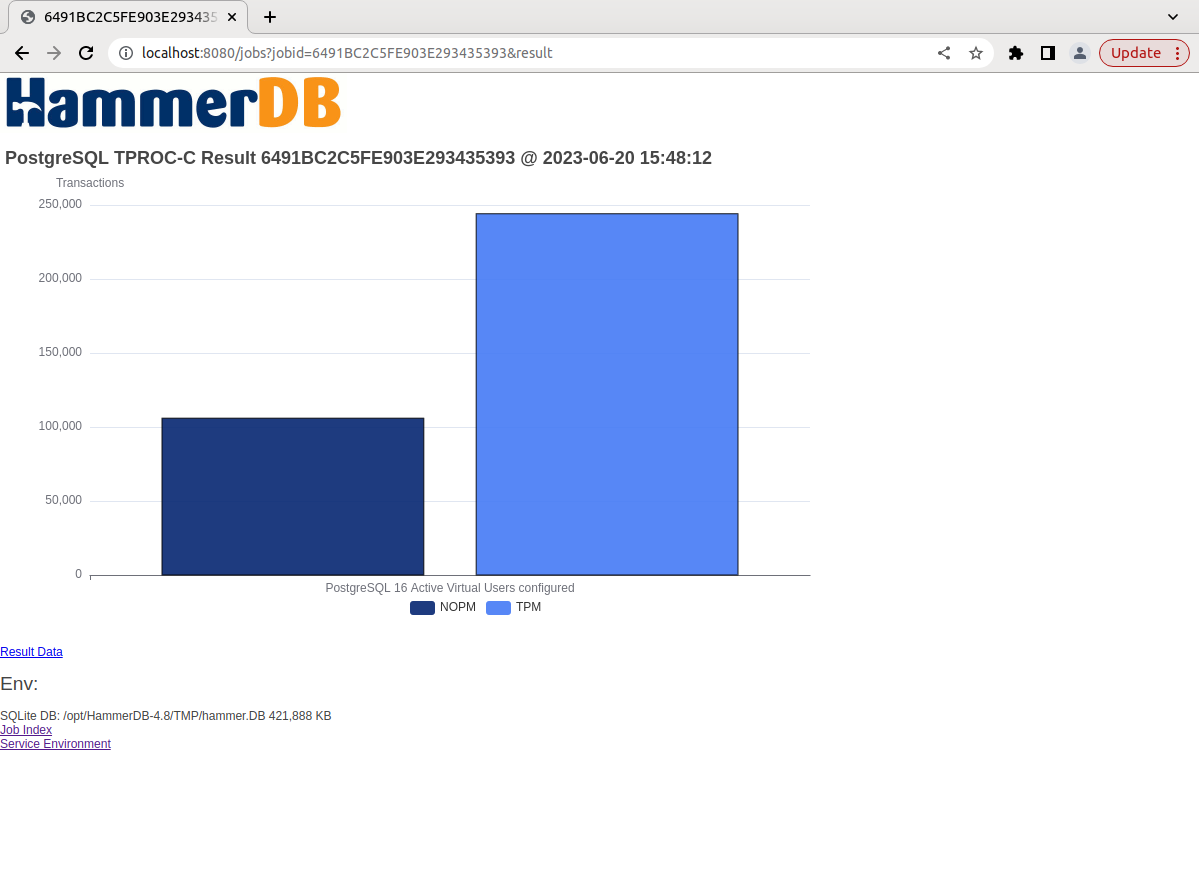
The result option will show a chart of the NOPM and TPM data with a link to the data it is generated from.
Charts are generated with Apache echarts and therefore the browser must be able to access the URL.
https://cdn.jsdelivr.net/npm/echarts@5.4.1/dist/echarts.min.js
If Apache echarts cannot be downloaded then the chart screens will be left blank.
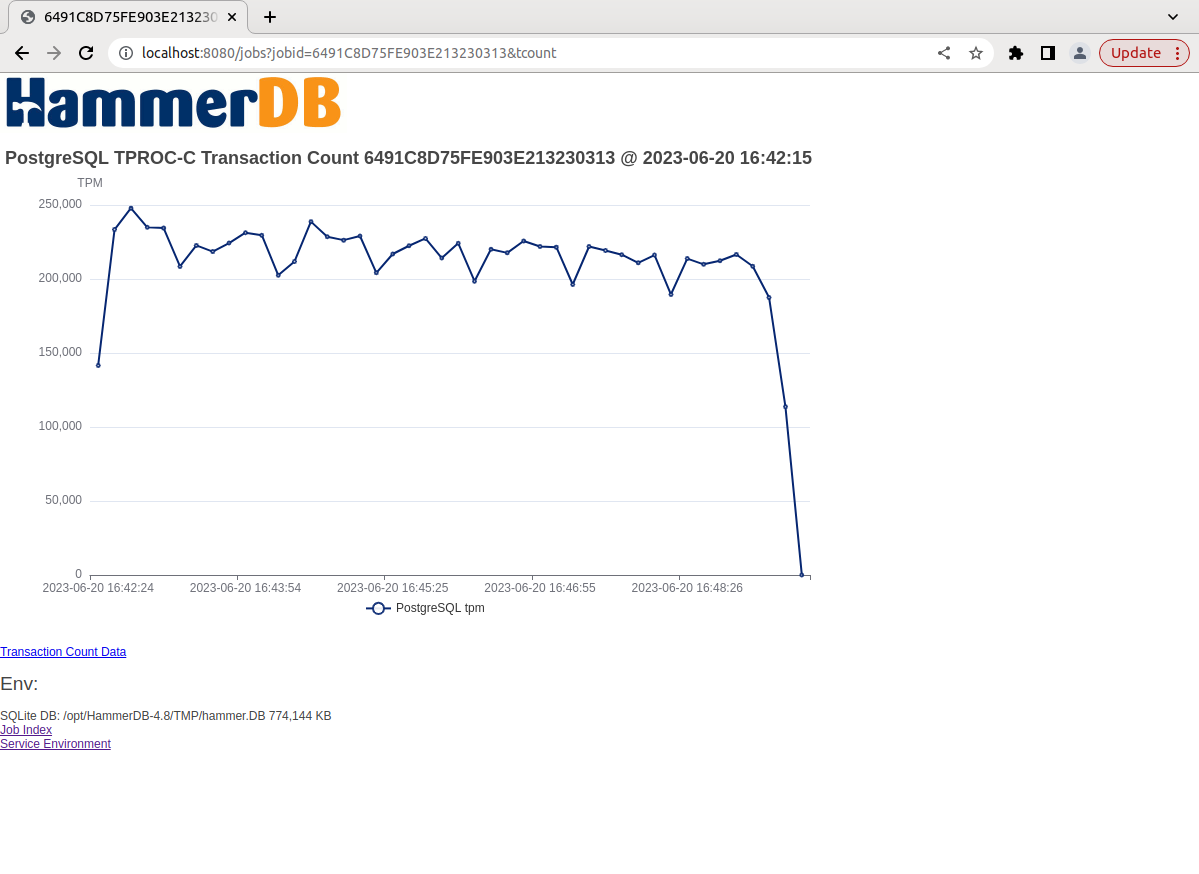
The transaction counter link will be shown if the transaction counter was running during the workload (for both GUI and CLI). If the transaction counter was not running, then the link is omitted.
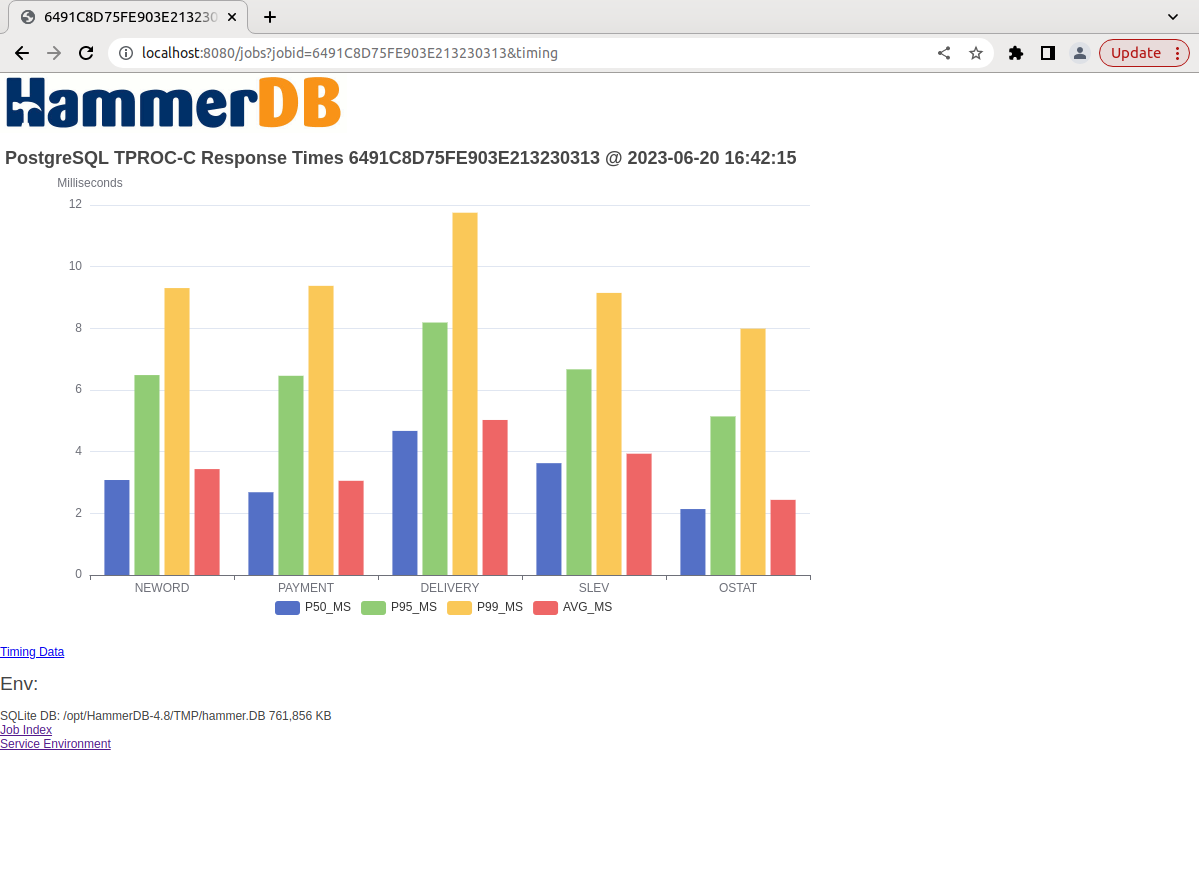
If the timing option was enabled, then a chart for response times is also generated.
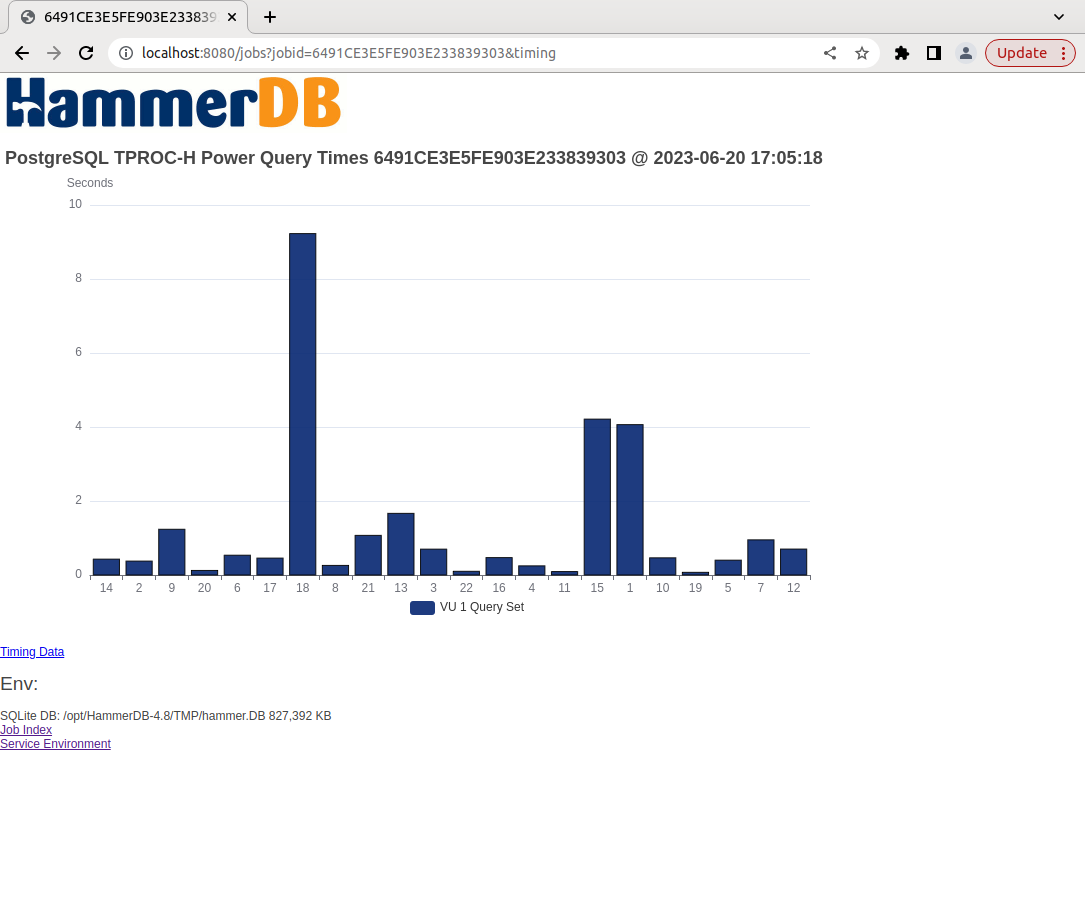
Charts are also generated for TPROC-H results and timings.
Failed and Unknown Jobs
If a Job errors or is left in an unknown state, then that will be reported in the Job Index. Note the top result is shown for both TPROC-C and TPROC-H.
Job CLI Interface
Jobs can also continue to be queried directly from the CLI with additional functionality at this interface such as querying the timings of individual Virtual Users.
hammerdb>job 6487506D5FDF03E263338333 result
[
  "6487506D5FDF03E263338333",
  "2023-06-12 18:05:49",
  "12 Active Virtual Users configured",
  "TEST RESULT : System achieved 46050 NOPM from 202715 Db2 TPM"
]


hammerdb>job 6487506D5FDF03E263338333 timing 2
{
  "NEWORD": {
    "elapsed_ms": "420335.0",
    "calls": "26129",
    "min_ms": "2.274",
    "avg_ms": "8.121",
    "max_ms": "194.175",
    "total_ms": "212183.912",
    "p99_ms": "24.189",
    "p95_ms": "14.837",
    "p50_ms": "7.21",
    "sd": "4729.629",
    "ratio_pct": "50.48"
  },
  "PAYMENT": {
    "elapsed_ms": "420335.0",
    "calls": "26219",
    "min_ms": "1.742",
    "avg_ms": "6.192",
    "max_ms": "154.997",
    "total_ms": "162349.531",
    "p99_ms": "18.641",
    "p95_ms": "11.624",
    "p50_ms": "5.47",
    "sd": "3479.359",
    "ratio_pct": "38.624"
  },
  "DELIVERY": {
    "elapsed_ms": "420335.0",
    "calls": "2691",
    "min_ms": "3.615",
    "avg_ms": "8.983",
    "max_ms": "66.023",
    "total_ms": "24172.593",
    "p99_ms": "27.364",
    "p95_ms": "15.336",
    "p50_ms": "8.032",
    "sd": "4385.244",
    "ratio_pct": "5.751"
  },
  "SLEV": {
    "elapsed_ms": "420335.0",
    "calls": "2714",
    "min_ms": "0.795",
    "avg_ms": "3.243",
    "max_ms": "78.237",
    "total_ms": "8800.962",
    "p99_ms": "11.414",
    "p95_ms": "7.068",
    "p50_ms": "2.586",
    "sd": "2776.821",
    "ratio_pct": "2.094"
  },
  "OSTAT": {
    "elapsed_ms": "420335.0",
    "calls": "2663",
    "min_ms": "0.705",
    "avg_ms": "3.072",
    "max_ms": "55.527",
    "total_ms": "8180.22",
    "p99_ms": "10.176",
    "p95_ms": "6.495",
    "p50_ms": "2.57",
    "sd": "2302.054",
    "ratio_pct": "1.946"
  }
}
Additional CLI functionality is also provided with the getchart command to return the HTML for a generated chart.
hammerdb>job 6487506D5FDF03E263338333 getchart result
<!DOCTYPE html>
<html>
  <head>
    <meta charset="UTF-8">
    <title>6487506D5FDF03E263338333 Result</title>
    <script type="text/javascript" src="https://cdn.jsdelivr.net/npm/echarts@5.4.1/dist/echarts.min.js"></script>
  </head>
  <body>
    <div id="id_a3a1672ce6814324bd80d8b84cff1557" class="chart-container" style="width:900px; height:500px;"></div>
    <script>
        var chart_a3a1672ce6814324bd80d8b84cff1557 = echarts.init(document.getElementById('id_a3a1672ce6814324bd80d8b84cff1557'), null, {renderer: 'canvas'});
        var option_a3a1672ce6814324bd80d8b84cff1557 = {
  "backgroundColor": "rgba(0,0,0,0)",
  "color": [
    "#5470c6",
    "#91cc75",
    "#fac858",
    "#ee6666",
    "#73c0de",
    "#3ba272",
    "#fc8452",
    "#9a60b4",
    "#ea7ccc"
  ],
  "animation": true,
  "animationDuration": 1000,
  "animationDurationUpdate": 500,
  "animationEasing": "cubicInOut",
  "animationEasingUpdate": "cubicInOut",
  "animationThreshold": 2000,
  "progressiveThreshold": 3000,
  "title": [{
      "show": true,
      "text": "Db2 TPROC-C Result 6487506D5FDF03E263338333 @ 2023-06-12 18:05:49",
      "target": "blank",
      "subtarget": "blank",
      "textAlign": null,
      "textVerticalAlign": "auto",
      "padding": 5,
      "itemGap": 10,
      "z": 2,
      "left": "auto",
      "top": "auto",
      "right": "auto",
      "bottom": "auto",
      "backgroundColor": "transparent",
      "borderColor": "transparent",
      "borderWidth": 1,
      "borderRadius": 0
    }],
  "legend": [{
      "type": "plain",
      "show": true,
      "z": 2,
      "left": "45%",
      "top": "auto",
      "right": "auto",
      "bottom": "5%",
      "width": "auto",
      "height": "auto",
      "orient": "horizontal",
      "align": "auto",
      "padding": 5,
      "itemGap": 10,
      "itemWidth": 25,
      "itemHeight": 14,
      "symbolRotate": "inherit",
      "selectedMode": true,
      "inactiveColor": "rgb(204, 204, 204)",
      "inactiveBorderColor": "rgb(204, 204, 204)",
      "inactiveBorderWidth": "auto",
      "backgroundColor": "transparent",
      "borderWidth": 0,
      "borderRadius": 0,
      "pageButtonItemGap": 5,
      "pageIconColor": "rgb(47, 69, 84)",
      "pageIconInactiveColor": "rgb(170, 170, 170)",
      "pageIconSize": 15
    }],
  "tooltip": [{
      "show": true,
      "trigger": "item",
      "showContent": true,
      "alwaysShowContent": false,
      "triggerOn": "mousemove|click",
      "transitionDuration": 0.4,
      "padding": 5,
      "order": "seriesAsc"
    }],
  "xAxis": [{
      "show": true,
      "type": "category",
      "data": ["Db2 12 Active Virtual Users configured"],
      "gridIndex": 0,
      "position": "bottom",
      "offset": 0,
      "nameLocation": "end",
      "nameGap": 15,
      "nameRotate": 0,
      "inverse": false,
      "boundaryGap": true,
      "scale": false,
      "splitNumber": 5,
      "minInterval": 0,
      "silent": false,
      "triggerEvent": false,
      "axisLabel": {
        "show": true,
        "interval": "auto",
        "inside": false,
        "rotate": 0,
        "margin": 8,
        "showMinLabel": null,
        "showMaxLabel": null,
        "hideOverlap": false,
        "fontStyle": "normal",
        "fontWeight": "normal",
        "fontFamily": "sans-serif",
        "fontSize": 12,
        "lineHeight": 12,
        "backgroundColor": "transparent",
        "borderWidth": 0,
        "borderType": "solid",
        "borderDashOffset": 0,
        "borderRadius": 0,
        "padding": 0,
        "shadowColor": "transparent",
        "shadowBlur": 0,
        "shadowOffsetX": 0,
        "shadowOffsetY": 0,
        "textBorderColor": null,
        "textBorderWidth": 0,
        "textBorderType": "solid",
        "textBorderDashOffset": 0,
        "textShadowColor": "transparent",
        "textShadowBlur": 0,
        "textShadowOffsetX": 0,
        "textShadowOffsetY": 0,
        "overflow": "truncate",
        "ellipsis": "..."
      },
      "zlevel": 0,
      "z": 0
    }],
  "yAxis": [{
      "show": true,
      "gridIndex": 0,
      "position": "left",
      "offset": 0,
      "realtimeSort": true,
      "sortSeriesIndex": 0,
      "type": "value",
      "name": "Transactions",
      "nameLocation": "end",
      "nameGap": 15,
      "nameRotate": 0,
      "inverse": false,
      "boundaryGap": false,
      "scale": false,
      "splitNumber": 5,
      "minInterval": 0,
      "silent": false,
      "triggerEvent": false,
      "axisLabel": {
        "show": true,
        "interval": "auto",
        "inside": false,
        "rotate": 0,
        "margin": 8,
        "formatter": "{value}",
        "showMinLabel": null,
        "showMaxLabel": null,
        "hideOverlap": false,
        "fontStyle": "normal",
        "fontWeight": "normal",
        "fontFamily": "sans-serif",
        "fontSize": 12,
        "lineHeight": 12,
        "backgroundColor": "transparent",
        "borderWidth": 0,
        "borderType": "solid",
        "borderDashOffset": 0,
        "borderRadius": 0,
        "padding": 0,
        "shadowColor": "transparent",
        "shadowBlur": 0,
        "shadowOffsetX": 0,
        "shadowOffsetY": 0,
        "textBorderColor": null,
        "textBorderWidth": 0,
        "textBorderType": "solid",
        "textBorderDashOffset": 0,
        "textShadowColor": "transparent",
        "textShadowBlur": 0,
        "textShadowOffsetX": 0,
        "textShadowOffsetY": 0,
        "overflow": "truncate",
        "ellipsis": "..."
      },
      "zlevel": 0,
      "z": 0
    }],
  "series": [
    {
      "type": "bar",
      "name": "NOPM",
      "colorBy": "series",
      "legendHoverLink": true,
      "coordinateSystem": "cartesian2d",
      "roundCap": false,
      "showBackground": false,
      "itemStyle": {
        "color": "#00CC00",
        "borderColor": "rgb(0, 0, 0)",
        "borderType": "solid",
        "borderDashOffset": 0,
        "borderCap": "butt",
        "borderJoin": "bevel",
        "borderMiterLimit": 10,
        "opacity": 0.90
      },
      "sampling": "max",
      "cursor": "pointer",
      "barMinWidth": null,
      "barCategoryGap": "20%",
      "large": false,
      "largeThreshold": 400,
      "data": [46050],
      "zlevel": 0,
      "z": 2,
      "silent": false
    },
    {
      "type": "bar",
      "name": "TPM",
      "colorBy": "series",
      "legendHoverLink": true,
      "coordinateSystem": "cartesian2d",
      "roundCap": false,
      "showBackground": false,
      "itemStyle": {
        "color": "#66ff66",
        "borderColor": "rgb(0, 0, 0)",
        "borderType": "solid",
        "borderDashOffset": 0,
        "borderCap": "butt",
        "borderJoin": "bevel",
        "borderMiterLimit": 10,
        "opacity": 0.90
      },
      "sampling": "max",
      "cursor": "pointer",
      "barMinWidth": null,
      "barCategoryGap": "20%",
      "large": false,
      "largeThreshold": 400,
      "data": [202715],
      "zlevel": 0,
      "z": 2,
      "silent": false
    }
  ]
}
chart_a3a1672ce6814324bd80d8b84cff1557.setOption(option_a3a1672ce6814324bd80d8b84cff1557);
    </script>
  </body>
</html>
Summary
In this post we have introduced new HammerDB v4.8 functionality for viewing workload related results and configuration from a central location.