
Python is a popular programming language, especially for beginners, and consequently we see it occurring in places where it just shouldn’t be used, such as database benchmarking. In contrast, a frequent question when it comes to HammerDB is why is it written in Tcl? Surely any language will do?
This post addresses both questions to illustrate exactly why HammerDB is written in Tcl and why using Python to benchmark a database can result in poor performance and misleading results. To do this, we are going to rewrite HammerDB in Python and run a series of tests on a 2 socket Intel(R) Xeon(R) Platinum 8280L server to see how and why Tcl is 700% faster than Python for database benchmarking*
Background and Concepts
To begin with, you should be familiar with the concepts of parallelism vs concurrency and why it is vital that your benchmark should run in parallel so that you are testing the concurrency of the database. An introduction to these concepts is given in the following post.
What programming languages does HammerDB use and why does it matter?
You should also be familiar with the concepts of ACID compliance and locking versus multiversioning as well as database transaction isolation levels, as it is essential to ensure that the database benchmark itself is not serialized.
Rewriting HammerDB in Python
So we are not actually going to rewrite HammerDB in Python, however it is trivial to write a command line driver script in Python as all the hard work in creating the schema and writing the stored procedures has already been done. (We use stored procedures because, as the introductory post shows, using single SQL statements turns our database benchmark into a network test). So instead we are going to take a cut down version of the HammerDB TPROC-C driver script and do the same in Python and use the HammerDB infrastructure to measure performance. For this example, we are going to use PostgreSQL stored procedures in PostgreSQL 14.1.
So firstly we have the Tcl based driver script called pgtest_thread.tcl
#!/usr/local/bin/tclsh8.6
package require Thread
set maxvuser 64
for { set vuser 0 } {$vuser < $maxvuser } {incr vuser} {
        set threadID [thread::create {
#EDITABLE OPTIONS##################################################
set library Pgtcl ;# PostgreSQL Library
set total_iterations 10000000 ;# Number of transactions before logging off
set host "localhost" ;# Address of the server hosting PostgreSQL
set port "5432" ;# Port of the PostgreSQL Server
set sslmode "disable" ;# SSLMode of the PostgreSQL Server
set user "tpcc" ;# PostgreSQL user
set password "tpcc" ;# Password for the PostgreSQL user
set db "tpcc" ;# Database containing the TPC Schema
#EDITABLE OPTIONS##################################################
#RANDOM NUMBER
  proc RandomNumber {m M} {return [expr {int($m+rand()*($M+1-$m))}]}
  proc NURand { iConst x y C } {return [ expr {((([RandomNumber 0 $iConst] | [RandomNumber $x $y]) + $C) % ($y - $x + 1)) + $x }]}
   #RANDOM NAME
  proc randname { num } {
    array set namearr { 0 BAR 1 OUGHT 2 ABLE 3 PRI 4 PRES 5 ESE 6 ANTI 7 CALLY 8 ATION 9 EING }
    set name [ concat $namearr([ expr {( $num / 100 ) % 10 }])$namearr([ expr {( $num / 10 ) % 10 }])$namearr([ expr {( $num / 1 ) % 10 }]) ]
    return $name
  }

#LOAD LIBRARIES AND MODULES
if [catch {package require $library} message] { error "Failed to load $library - $message" }

#TIMESTAMP
proc gettimestamp { } {
    set tstamp [ clock format [ clock seconds ] -format %Y%m%d%H%M%S ]
    return $tstamp
}
#POSTGRES CONNECTION
proc ConnectToPostgres { host port sslmode user password dbname } {
    global tcl_platform
    if {[catch {set lda [pg_connect -conninfo [list host = $host port = $port sslmode = $sslmode user = $user password = $password dbname = $dbname ]]} message]} {
        set lda "Failed" ; puts $message
        error $message
    } else {
        if {$tcl_platform(platform) == "windows"} {
            #Workaround for Bug #95 where first connection fails on Windows
            catch {pg_disconnect $lda}
            set lda [pg_connect -conninfo [list host = $host port = $port sslmode = $sslmode user = $user password = $password dbname = $dbname ]]
        }
        pg_notice_handler $lda puts
        set result [ pg_exec $lda "set CLIENT_MIN_MESSAGES TO 'ERROR'" ]
        pg_result $result -clear
    }
    return $lda
}
#NEW ORDER
proc neword { lda no_w_id w_id_input } {
    #2.4.1.2 select district id randomly from home warehouse where d_w_id = d_id
    set no_d_id [ RandomNumber 1 10 ]
    #2.4.1.2 Customer id randomly selected where c_d_id = d_id and c_w_id = w_id
    set no_c_id [ RandomNumber 1 3000 ]
    #2.4.1.3 Items in the order randomly selected from 5 to 15
    set ol_cnt [ RandomNumber 5 15 ]
    #2.4.1.6 order entry date O_ENTRY_D generated by SUT
    set date [ gettimestamp ]
    set result [pg_exec $lda "call neword($no_w_id,$w_id_input,$no_d_id,$no_c_id,$ol_cnt,0.0,'','',0.0,0.0,0,TO_TIMESTAMP('$date','YYYYMMDDHH24MISS')::timestamp without time zone)" ]
    if {[pg_result $result -status] != "PGRES_TUPLES_OK"} {
            error "[pg_result $result -error]"
        pg_result $result -clear
    } else {
        #puts "New Order: $no_w_id $w_id_input $no_d_id $no_c_id $ol_cnt 0 [ pg_result $result -list ]"
        pg_result $result -clear
    }
}
#PAYMENT
proc payment { lda p_w_id w_id_input } {
    #2.5.1.1 The home warehouse id remains the same for each terminal
    #2.5.1.1 select district id randomly from home warehouse where d_w_id = d_id
    set p_d_id [ RandomNumber 1 10 ]
    #2.5.1.2 customer selected 60% of time by name and 40% of time by number
    set x [ RandomNumber 1 100 ]
    set y [ RandomNumber 1 100 ]
    if { $x <= 85 } {
        set p_c_d_id $p_d_id
        set p_c_w_id $p_w_id
    } else {
        #use a remote warehouse
        set p_c_d_id [ RandomNumber 1 10 ]
        set p_c_w_id [ RandomNumber 1 $w_id_input ]
        while { ($p_c_w_id == $p_w_id) && ($w_id_input != 1) } {
            set p_c_w_id [ RandomNumber 1  $w_id_input ]
        }
    }
    set nrnd [ NURand 255 0 999 123 ]
    set name [ randname $nrnd ]
    set p_c_id [ RandomNumber 1 3000 ]
    if { $y <= 60 } {
        #use customer name
        #C_LAST is generated
        set byname 1
    } else {
        #use customer number
        set byname 0
        set name {}
    }
    #2.5.1.3 random amount from 1 to 5000
    set p_h_amount [ RandomNumber 1 5000 ]
    #2.5.1.4 date selected from SUT
    set h_date [ gettimestamp ]
    #2.5.2.1 Payment Transaction
    #change following to correct values
    set result [pg_exec $lda "call payment($p_w_id,$p_d_id,$p_c_w_id,$p_c_d_id,$byname,$p_h_amount,'0','$name',$p_c_id,'','','','','','','','','','','','','','','','','','',TO_TIMESTAMP('$h_date','YYYYMMDDHH24MISS')::timestamp without time zone,0.0,0.0,0.0,'',TO_TIMESTAMP('$h_date','YYYYMMDDHH24MISS')::timestamp without time zone)" ]
    if {[pg_result $result -status] != "PGRES_TUPLES_OK"} {
            error "[pg_result $result -error]"
        pg_result $result -clear
    } else {
        #puts "Payment: $p_w_id $p_d_id $p_c_w_id $p_c_d_id $p_c_id $byname $p_h_amount $name 0 0 [ pg_result $result -list ]"
        pg_result $result -clear
    }
}
#ORDER_STATUS
proc ostat { lda w_id } {
    #2.5.1.1 select district id randomly from home warehouse where d_w_id = d_id
    set d_id [ RandomNumber 1 10 ]
    set nrnd [ NURand 255 0 999 123 ]
    set name [ randname $nrnd ]
    set c_id [ RandomNumber 1 3000 ]
    set y [ RandomNumber 1 100 ]
    if { $y <= 60 } {
        set byname 1
    } else {
        set byname 0
        set name {}
    }
            set date [ gettimestamp ]
            set result [pg_exec $lda "call ostat($w_id,$d_id,$c_id,$byname,'$name','','',0.0,0,TO_TIMESTAMP('$date','YYYYMMDDHH24MISS')::timestamp without time zone,0,'')" ]
    if {[pg_result $result -status] != "PGRES_TUPLES_OK"} {
            error "[pg_result $result -error]"
        pg_result $result -clear
    } else {
        #puts "Order Status: $w_id $d_id $c_id $byname $name [ pg_result $result -list ]"
        pg_result $result -clear
    }
}
#DELIVERY
proc delivery { lda w_id } {
    set carrier_id [ RandomNumber 1 10 ]
    set date [ gettimestamp ]
            set result [pg_exec $lda "call delivery($w_id,$carrier_id,TO_TIMESTAMP('$date','YYYYMMDDHH24MISS')::timestamp without time zone)" ]
    if {[pg_result $result -status] ni {"PGRES_TUPLES_OK" "PGRES_COMMAND_OK"}} {
            error "[pg_result $result -error]"
        pg_result $result -clear
    } else {
        #puts "Delivery: $w_id $carrier_id [ pg_result $result -list ]"
        pg_result $result -clear
    }
}
#STOCK LEVEL
proc slev { lda w_id stock_level_d_id } {
    set threshold [ RandomNumber 10 20 ]
            set result [pg_exec $lda "call slev($w_id,$stock_level_d_id,$threshold,0)"]
    if {[pg_result $result -status] ni {"PGRES_TUPLES_OK" "PGRES_COMMAND_OK"}} {
            error "[pg_result $result -error]"
        pg_result $result -clear
    } else {
        #puts "Stock Level: $w_id $stock_level_d_id $threshold [ pg_result $result -list ]"
        pg_result $result -clear
    }
}

#RUN TPC-C
set lda [ ConnectToPostgres $host $port $sslmode $user $password $db ]
if { $lda eq "Failed" } {
    error "error, the database connection to $host could not be established"
}
pg_select $lda "select max(w_id) from warehouse" w_id_input_arr {
    set w_id_input $w_id_input_arr(max)
}
#2.4.1.1 set warehouse_id stays constant for a given terminal
set w_id  [ RandomNumber 1 $w_id_input ]
pg_select $lda "select max(d_id) from district" d_id_input_arr {
    set d_id_input $d_id_input_arr(max)
}
set stock_level_d_id  [ RandomNumber 1 $d_id_input ]
puts "Processing $total_iterations transactions without output suppressed..."
for {set it 0} {$it < $total_iterations} {incr it} {
    set choice [ RandomNumber 1 23 ]
    if {$choice <= 10} {
        neword $lda $w_id $w_id_input
    } elseif {$choice <= 20} {
        payment $lda $w_id $w_id_input
    } elseif {$choice <= 21} {
        delivery $lda $w_id
    } elseif {$choice <= 22} {
        slev $lda $w_id $stock_level_d_id
    } elseif {$choice <= 23} {
        ostat $lda $w_id
    }
}
pg_disconnect $lda
thread::wait }]
}
vwait forever
and the same in Python called pgtest_thread.py
#!/usr/bin/python
import psycopg2
import sys
import random
import math
from datetime import datetime
import threading

def gettimestamp():
    tstamp = datetime.now().strftime("%Y%m%d%H%M%S")
    return tstamp

def nurand(iConst,x,y,C):
    nrnd = ((((random.randint(0,iConst) | random.randint(x,y)) + C) % (y - x + 1 )) + x)
    return nrnd

def randname(num):
    namearr = [ "BAR", "OUGHT", "ABLE", "PRI", "PRES", "ESE", "ANTI", "CALLY", "ATION", "EING" ]
    pt1 = namearr[math.floor((num / 100) % 10)]
    pt2 = namearr[math.floor((num / 10) % 10)]
    pt3 = namearr[math.floor((num / 1) % 10)]
    name = pt1 + pt2 + pt3
    return name

def neword(cur, no_w_id, w_id_input):
    #print("neword")
    no_d_id = random.randint(1,10)
    no_c_id = random.randint(1,3000)
    ol_cnt = random.randint(5,15)
    date = gettimestamp()
    cur.execute('call neword(%s,%s,%s,%s,%s,0.0,\'\',\'\',0.0,0.0,0,TO_TIMESTAMP(%s,\'YYYYMMDDHH24MISS\')::timestamp without time zone)',(no_w_id,w_id_input,no_d_id,no_c_id,ol_cnt,date))
    rows = cur.fetchall()
    #print(rows)

def payment(cur, p_w_id, w_id_input):
    #print("payment")
    p_d_id = random.randint(1,10)
    x = random.randint(1,100)
    y = random.randint(1,100)
    if (x <= 85):
            p_c_d_id = p_d_id
            p_c_w_id = p_w_id
    else:
            p_c_d_id = random.randint(1,10)
            p_c_w_id = random.randint(1,w_id_input)
            while (p_c_w_id == p_w_id) and (w_id_input != 1):
                p_c_w_id = random.randint(1,w_id_input)

    nrnd = nurand(255,0,999,123)
    name = randname(nrnd)
    p_c_id = random.randint(1,3000)
    if (y <= 85):
            byname = 1
    else:
            byname = 0
            name = ""

    p_h_amount = random.randint(1,5000)
    h_date = gettimestamp()
    p_c_since = gettimestamp()
    cur.execute('call payment(%s,%s,%s,%s,%s,%s,\'0\',%s,%s,\'\',\'\',\'\',\'\',\'\',\'\',\'\',\'\',\'\',\'\',\'\',\'\',\'\',\'\',\'\',\'\',\'\',\'\',TO_TIMESTAMP(%s,\'YYYYMMDDHH24MISS\')::timestamp without time zone,0.0,0.0,0.0,\'\',TO_TIMESTAMP(%s,\'YYYYMMDDHH24MISS\')::timestamp without time zone)',(p_w_id,p_d_id,p_c_w_id,p_c_d_id,byname,p_h_amount,name,p_c_id,p_c_since,h_date))
    rows = cur.fetchall()
    #print(rows)

def delivery(cur, w_id):
    #print("delivery")
    carrier_id = random.randint(1,10)
    date = gettimestamp()
    cur.execute('call delivery(%s,%s,TO_TIMESTAMP(%s,\'YYYYMMDDHH24MISS\')::timestamp without time zone)',(w_id,carrier_id,date))
    #rows = cur.fetchall()
    #print(rows)

def slev(cur, w_id, stock_level_d_id):
    #print("slev" )
    threshold = random.randint(10, 20)
    cur.execute('call slev(%s,%s,%s,0)',(w_id,stock_level_d_id,threshold))
    rows = cur.fetchall()
    #print(rows)

def ostat(cur, w_id):
    #print("ostat")
    d_id = random.randint(1, 10)
    nrnd = nurand(255,0,999,123)
    name = randname(nrnd)
    c_id = random.randint(1, 3000)
    y = random.randint(1, 100)
    if (y <= 60):
        byname = 1
    else:
        byname = 0
        name = ""

    date = gettimestamp()
    cur.execute('call ostat(%s,%s,%s,%s,%s,\'\',\'\',0.0,0,TO_TIMESTAMP(%s,\'YYYYMMDDHH24MISS\')::timestamp without time zone,0,\'\')',(w_id,d_id,c_id,byname,name,date))
    rows = cur.fetchall()
    #print(rows)

def runtpcc():
    total_iterations = 1000000
    conn = psycopg2.connect(host="localhost",port="5432",database="tpcc",user="tpcc",password="tpcc")
    conn.set_session(autocommit=True)
    cur = conn.cursor()
    cur.execute("select max(w_id) from warehouse")
    w_id_input = cur.fetchone()[0]
    w_id = random.randint(1, w_id_input)
    cur.execute("select max(d_id) from district")
    d_id_input = cur.fetchone()[0]
    stock_level_d_id = random.randint(1, d_id_input)
    print ("Processing", total_iterations, "transactions without output suppressed...")
    for x in range(total_iterations):
        choice = random.randint(1, 23)
        if (choice <= 10):
            neword (cur, w_id, w_id_input)
        elif (choice <= 20):
            payment (cur,w_id, w_id_input)
        elif (choice <= 21):
            delivery (cur, w_id)
        elif (choice <= 22):
            slev (cur, w_id, stock_level_d_id)
        elif (choice <= 23):
            ostat (cur, w_id)

        if (x == total_iterations):
            conn.close()

def main():
    threads = []
    for n in range(64):
        t = threading.Thread(target=runtpcc)
        threads.append(t)
        t.start()

    for t in threads:
        t.join()

if __name__ == '__main__':
    main()
It should be clear that these driver scripts do exactly the same thing, they create multiple threads and loop calling the 5 TPROC-C stored procedures meaning that on the PostgreSQL database the workload itself is identical only the language calling the stored procedures is different.
Building the Test Schema and Timing Script
Next we are going to build a PostgreSQL test schema using the HammerDB CLI as follows:
dbset db pg
dbset bm TPC-C
vuset logtotemp 0
diset tpcc pg_superuser postgres
diset tpcc pg_superuserpass postgres
diset tpcc pg_storedprocs true
diset tpcc pg_count_ware 1000
diset tpcc pg_num_vu 64
buildschema
waittocomplete
quit
Finally we are going to build a HammerDB timing script. The key thing to note is that we are going to set pg_total_iterations to 1, this means that we have a special form of driver script that will time the transactions on the database but will not run any transactions itself to impact the load. This way we can run our external Tcl and Python test scripts and capture the results.
dbset db pg
dbset bm TPC-C
diset tpcc pg_superuser steve
diset tpcc pg_defaultdbase postgres
diset tpcc pg_storedprocs true
diset tpcc pg_total_iterations 1
diset tpcc pg_driver timed
diset tpcc pg_rampup 0
diset tpcc pg_duration 2
vuset logtotemp 1
loadscript
vuset vu 1
tcstart
vucreate
vurun
runtimer 130
vudestroy
tcstop
If all is configured correctly when running either our Tcl or Python driver script we will see output such as follows, note that Vuser 2 shows FINISHED SUCCESS just after it starts so the only activity that this script is doing on the database is capturing the NOPM and TPM over a time period, in this example 2 minutes.
$ ./hammerdbcli auto pgtime.tcl
HammerDB CLI v4.4
Copyright (C) 2003-2022 Steve Shaw
Type "help" for a list of commands
The xml is well-formed, applying configuration
Database set to PostgreSQL
Benchmark set to TPC-C for PostgreSQL
Changed tpcc:pg_superuser from postgres to steve for PostgreSQL
Value postgres for tpcc:pg_defaultdbase is the same as existing value postgres, no change made
Changed tpcc:pg_storedprocs from false to true for PostgreSQL
Changed tpcc:pg_total_iterations from 10000000 to 1 for PostgreSQL
Clearing Script, reload script to activate new setting
Script cleared
Changed tpcc:pg_driver from test to timed for PostgreSQL
Changed tpcc:pg_rampup from 2 to 0 for PostgreSQL
Changed tpcc:pg_duration from 5 to 2 for PostgreSQL
Script loaded, Type "print script" to view
Transaction Counter Started
Vuser 1 created MONITOR - WAIT IDLE
Vuser 2 created - WAIT IDLE
Logging activated
to /tmp/hammerdb.log
2 Virtual Users Created with Monitor VU
Vuser 1:RUNNING
Vuser 1:Beginning rampup time of 0 minutes
Vuser 1:Rampup complete, Taking start Transaction Count.
0 PostgreSQL tpm
Vuser 1:Timing test period of 2 in minutes
Vuser 2:RUNNING
Vuser 2:Processing 1 transactions with output suppressed...
Vuser 2:FINISHED SUCCESS
3650220 PostgreSQL tpm
4245132 PostgreSQL tpm
4203948 PostgreSQL tpm
4211748 PostgreSQL tpm
4203648 PostgreSQL tpm
Timer: 1 minutes elapsed
Vuser 1:1 ...,
4367244 PostgreSQL tpm
4265898 PostgreSQL tpm
4320510 PostgreSQL tpm
4258518 PostgreSQL tpm
4426578 PostgreSQL tpm
4413780 PostgreSQL tpm
Timer: 2 minutes elapsed
Vuser 1:2 ...,
Vuser 1:Test complete, Taking end Transaction Count.
Vuser 1:1 Active Virtual Users configured
Vuser 1:TEST RESULT : System achieved 1844256 NOPM from 4232155 PostgreSQL TPM
Vuser 1:FINISHED SUCCESS
ALL VIRTUAL USERS COMPLETE
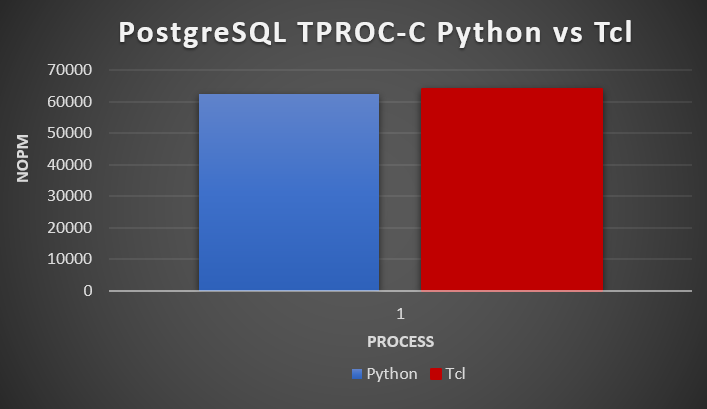
Running a single process pre-test
Before we test the multithreading capabilities it is important to callibrate how our respective scripts. For this we will use a slightly modified version for both that removes the threading. We start these running as follows for Python
python3 pgtest_proc.py
and as follows from the HammerDB directory (export the HammerDB ./lib directory into the LD_LIBRARY_PATH first)
./bin/tclsh8.6 pgtest_proc.tcl
Once the workload is started we then run the timing script in another command window and once we get the result we Ctrl-C the driver script to stop the test.
In our single process test we see 62257 NOPM for Python and 64142 NOPM for Tcl giving confidence that the test scripts and methodology are correct (remember that the workload is running in PostgreSQL stored procedures and the test is calling those stored procedures, so we expect the single process result to be very close).
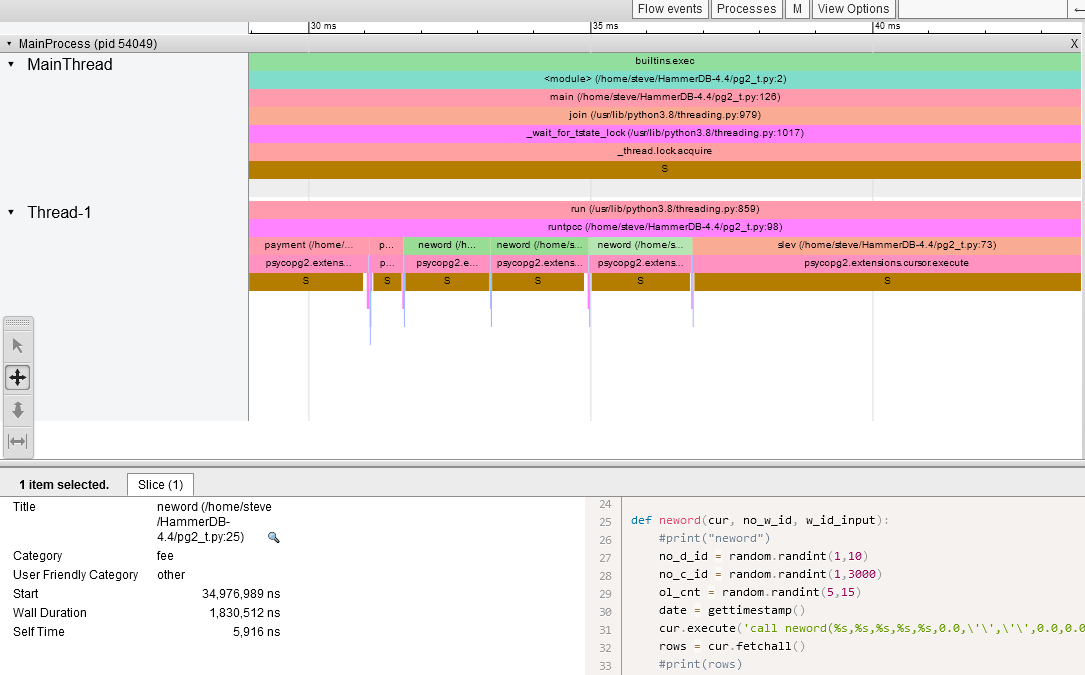
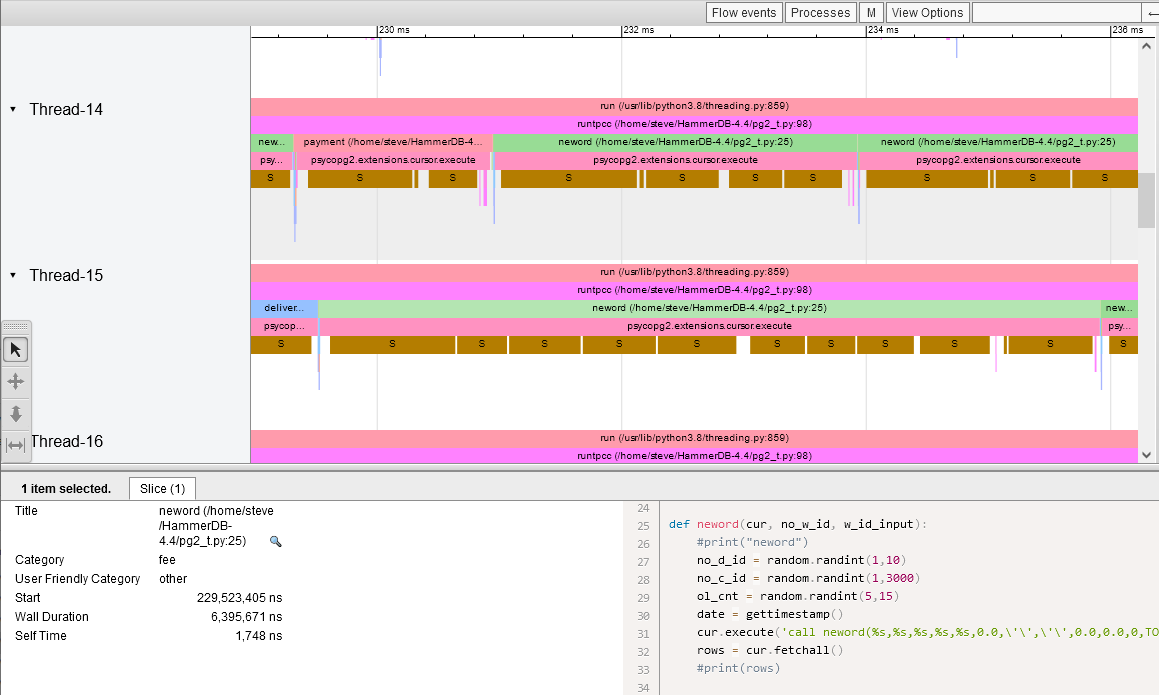
We can also use VizTracer to run the same workload under Python this time in a single thread to understand a little about what the workload should look like. For each stored procedure we calculate the parameters with a number of random operations and then call psycopg2.extensions.cursor.execute, during this we sleep while we wait for the PostgreSQL database to execute the stored procedure and then we run psycopg2.extensions.cursor.fetchall to fetch the results. In total the Wall duration to run the neword stored procedure was 1.8ms.
Running the Mulithreaded Test
Now lets run a the multithreaded tests shown above. For each test we are going to edit the script to change the number of threads testing at 1,2,4,8,16,32 and 64 threads with the following results.
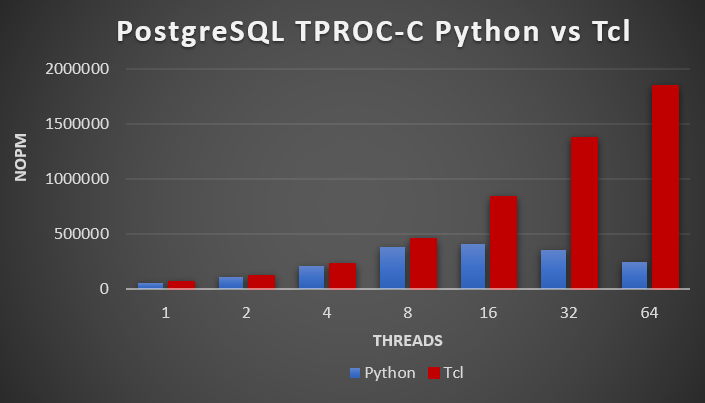
At 1, 2 or 4 threads we barely notice a difference, however at 64 threads Python gives us 247976 NOPM and Tcl 1844256 NOPM meaning Tcl is more than 700% faster for an identical workload once we start running multiple threads.
So why is there such a marked contrast between an identical workload in Python and Tcl? As an early indication we can take a look at the output from top when running 64 threads. Firstly with Python observe that we have 9 running tasks, 5.8% user CPU utilisation and all of the top postgres processes show as idle.
Tasks: 1144 total, 9 running, 1135 sleeping, 0 stopped, 0 zombie
%Cpu(s): 5.8 us, 1.0 sy, 0.0 ni, 93.0 id, 0.0 wa, 0.0 hi, 0.2 si, 0.0 st
MiB Mem : 772719.8 total, 581155.8 free, 6252.7 used, 185311.2 buff/cache
MiB Swap: 2048.0 total, 2048.0 free, 0.0 used. 711977.4 avail Mem

PID USER PR NI VIRT RES SHR S %CPU %MEM TIME+ COMMAND
52656 postgres 20 0 5347252 25784 13644 S 178.8 0.0 0:44.94 python3 pgtest_thread.py
52794 postgres 20 0 49.3g 2.4g 2.4g S 10.9 0.3 0:02.83 postgres: tpcc tpcc ::1(45366) idle
52663 postgres 20 0 49.3g 2.2g 2.2g S 10.3 0.3 0:02.88 postgres: tpcc tpcc ::1(45234) idle
52721 postgres 20 0 49.3g 2.3g 2.3g S 10.3 0.3 0:02.75 postgres: tpcc tpcc ::1(45292) idle
52778 postgres 20 0 49.3g 2.4g 2.4g S 10.3 0.3 0:02.82 postgres: tpcc tpcc ::1(45350) idle
52784 postgres 20 0 49.3g 2.3g 2.3g S 10.3 0.3 0:02.81 postgres: tpcc tpcc ::1(45356) idle
in contrast the same workload in Tcl shows that we have 64 running tasks (for 64 threads) 53.1% CPU and the postgres processes are all busy running stored procedures.
Tasks: 1143 total, 64 running, 1079 sleeping, 0 stopped, 0 zombie
%Cpu(s): 53.1 us, 6.0 sy, 0.0 ni, 40.0 id, 0.1 wa, 0.0 hi, 0.8 si, 0.0 st
MiB Mem : 772719.8 total, 578477.9 free, 9582.1 used, 184659.7 buff/cache
MiB Swap: 2048.0 total, 2048.0 free, 0.0 used. 708649.4 avail Mem

PID USER PR NI VIRT RES SHR S %CPU %MEM TIME+ COMMAND
52329 postgres 20 0 5351472 222896 10216 S 441.3 0.0 1:33.25 ./bin/tclsh8.6 pgtest_thread.tcl
52362 postgres 20 0 49.3g 5.5g 5.5g R 87.1 0.7 0:17.59 postgres: tpcc tpcc ::1(45114) CALL
52408 postgres 20 0 49.3g 6.0g 6.0g R 87.1 0.8 0:17.49 postgres: tpcc tpcc ::1(45160) CALL
52338 postgres 20 0 49.3g 6.0g 6.0g R 86.8 0.8 0:17.63 postgres: tpcc tpcc ::1(45086) CALL
52344 postgres 20 0 49.3g 6.2g 6.2g R 86.8 0.8 0:17.63 postgres: tpcc tpcc ::1(45096) CALL
52348 postgres 20 0 49.3g 4.5g 4.5g S 86.8 0.6 0:17.42 postgres: tpcc tpcc ::1(45100) CALL
Analyzing the Python GIL
So, if you have read this far you won’t be surprised that we suspect that the roadblock we have encountered with Python is a major one called the Global Interpreter Lock or GIL that means only one thread can run at any one time. But lets confirm this using the GIL load tool to time the amount of time that the GIL is held for our 64 thread workload. The tool is installed and run as follows:
pip install gil_load
python3 -m gil_load pgtest_thread_gil.py
and we add gil_load.start and gil_load.stop to the Python script and run a smaller number of transactions without timing the test. The following is the result. The GIL is held for 77% of the time and the threads wait for the GIL 99.9% of the time. For Tcl this is 0% and 0% respectively because there is no GIL meaning Tcl threads execute in parallel and the workload continues to scale.
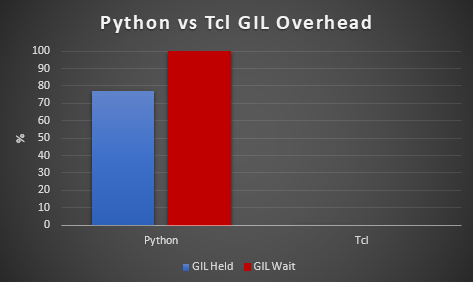
The difference between the two also shows that there is time when we are synchronizing between the threads and not running any workload at all. As our results show the more threads we add the worse the performance gets due to this GIL synchronization.
held: 0.771 (0.774, 0.771, 0.771)
wait: 0.999 (0.998, 0.999, 0.999)
<140263890196288>
held: 0.0 (0.0, 0.0, 0.0)
wait: 0.0 (0.0, 0.0, 0.0)
<140263853995776>
held: 0.008 (0.008, 0.008, 0.008)
wait: 0.903 (0.887, 0.902, 0.903)
<140263845603072>
held: 0.01 (0.01, 0.01, 0.01)
wait: 0.904 (0.888, 0.903, 0.904)
...
<140257727084288>
held: 0.01 (0.01, 0.01, 0.01)
wait: 0.904 (0.892, 0.904, 0.904)
If we now return to VizTracer and perf using the method described here to trace Python with 16 threads we can now see that the Wall Duration time for the neword stored procedure has increased by 300% and we are spending a lot longer sleeping with only one thread allowed to execute at any one time. PostgreSQL can sustain higher throughput but our Python client cannot.
Python GIL PostgreSQL wait events
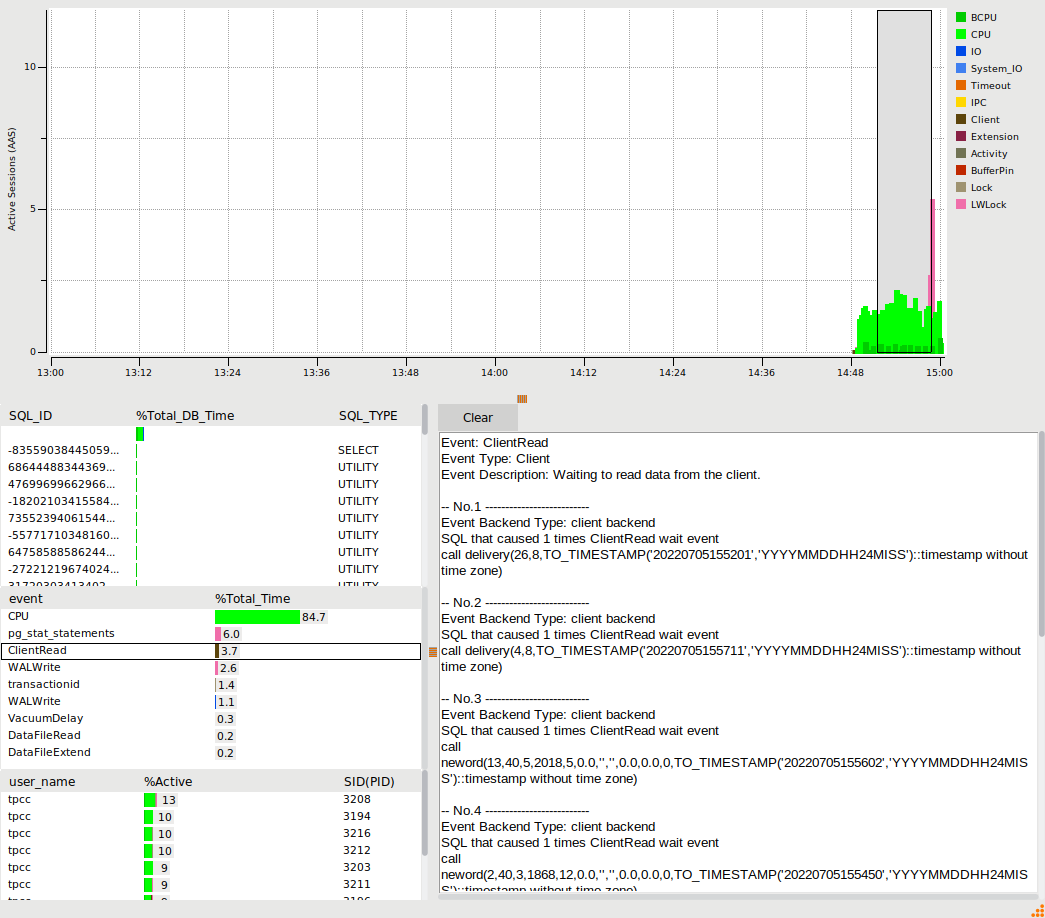
So if the bottleneck is in the client what wait event would we expect to see on our PostgreSQL database? To do this we can use the pg_stat_statements and pg_sentinel packages to query the active session history with the SQL as follows:
with ash as (
	 select *,ceil(extract(epoch from max(ash_time)over()-min(ash_time)over()))::numeric samples
	 from pg_active_session_history where ash_time>=current_timestamp - interval '10 minutes'
) select  round(100 * count(*)/sum(count(*)) over(),0) as "%", round(count(*)/samples,2) as "AAS",
   datname,wait_event_type,wait_event
 from ash
 group by samples,
  datname,wait_event_type,wait_event
 order by 1 desc
;
with the results as follows on Python:
 % | AAS | datname | wait_event_type | wait_event
----+------+---------+-----------------+--------------------
62 | 4.10 | tpcc | Client | ClientRead
33 | 2.19 | tpcc | CPU | CPU
3 | 0.18 | tpcc | LWLock | pg_stat_statements
1 | 0.06 | tpcc | IO | DataFileRead
1 | 0.03 | tpcc | LWLock | WALInsert
0 | 0.01 | tpcc | IO | SLRURead
0 | 0.01 | tpcc | IO | DataFileExtend
0 | 0.01 | tpcc | Timeout | VacuumDelay
0 | 0.00 | tpcc | IO | DataFileWrite
(9 rows)
and as follows on Tcl.
% | AAS | datname | wait_event_type | wait_event
----+-------+---------+-----------------+----------------------
60 | 34.76 | tpcc | CPU | CPU
26 | 15.12 | tpcc | LWLock | pg_stat_statements
7 | 3.88 | tpcc | LWLock | WALInsert
4 | 2.48 | tpcc | Client | ClientRead
1 | 0.52 | tpcc | IO | DataFileRead
1 | 0.32 | tpcc | Lock | extend
0 | 0.02 | tpcc | IO | SLRURead
0 | 0.03 | tpcc | LWLock | XidGen
0 | 0.26 | tpcc | Lock | transactionid
0 | 0.23 | tpcc | IPC | ProcArrayGroupUpdate
0 | 0.03 | tpcc | LWLock | LockManager
0 | 0.02 | tpcc | LWLock | BufferContent
0 | 0.12 | tpcc | LWLock | WALWrite
0 | 0.08 | tpcc | LWLock | XactSLRU
0 | 0.02 | tpcc | IO | DataFileExtend
0 | 0.26 | tpcc | LWLock | ProcArray
(16 rows)
So when using Python we are spending 62% of our time on a Client wait event called ClientRead or in other words PostgreSQL is telling us it is spending most of its time waiting for the Python client to respond, either the transaction has finished and it is waiting for Python to fetch the results or it has already fetched the results and is waiting for the next query to be sent. Either way high waits on ClientRead means we are waiting for the client and not the database. Also note that with the Tcl workload we now start to see some of the LWLock wait events that a database engineer working on scalability would focus on and we can use the HammerDB PostgreSQL statistics viewer to drill down on some of these wait events.
Summary
What we have observed is that the Python GIL makes it impossible to run anything but a single threaded benchmark against a database because the GIL means that only one thread can ever run at one time. For decades databases have been designed to scale to process millions of transactions a minute whilst maintaining database consistency, a serialized benchmark client compromises the ability to compare databases.
HammerDB and its predecessor Hammerora were written in the Tcl language because they were written by database engineers looking to write scalable database benchmarks rather than by application engineers looking to use a particular language. At the time Tcl was the only multi-threaded GIL free scripting language for database access and this still holds true today. (And although the Python test script could run in multiple processes HammerDB is an application simulating multiple virtual users in a GUI and CLI environment requiring the close interaction and control of using multiple threads).
*700% Faster
Although we have seen that Tcl is 700% faster than Python for our example PostgreSQL benchmark we observed that even with Tcl we were only at approximately 50% CPU Utilization. With commerical databases HammerDB can scale to full CPU utilization and 2-3X the transaction rate seen here meaning that in reality the gap between Tcl and Python running against a commericial database is more than 700%.