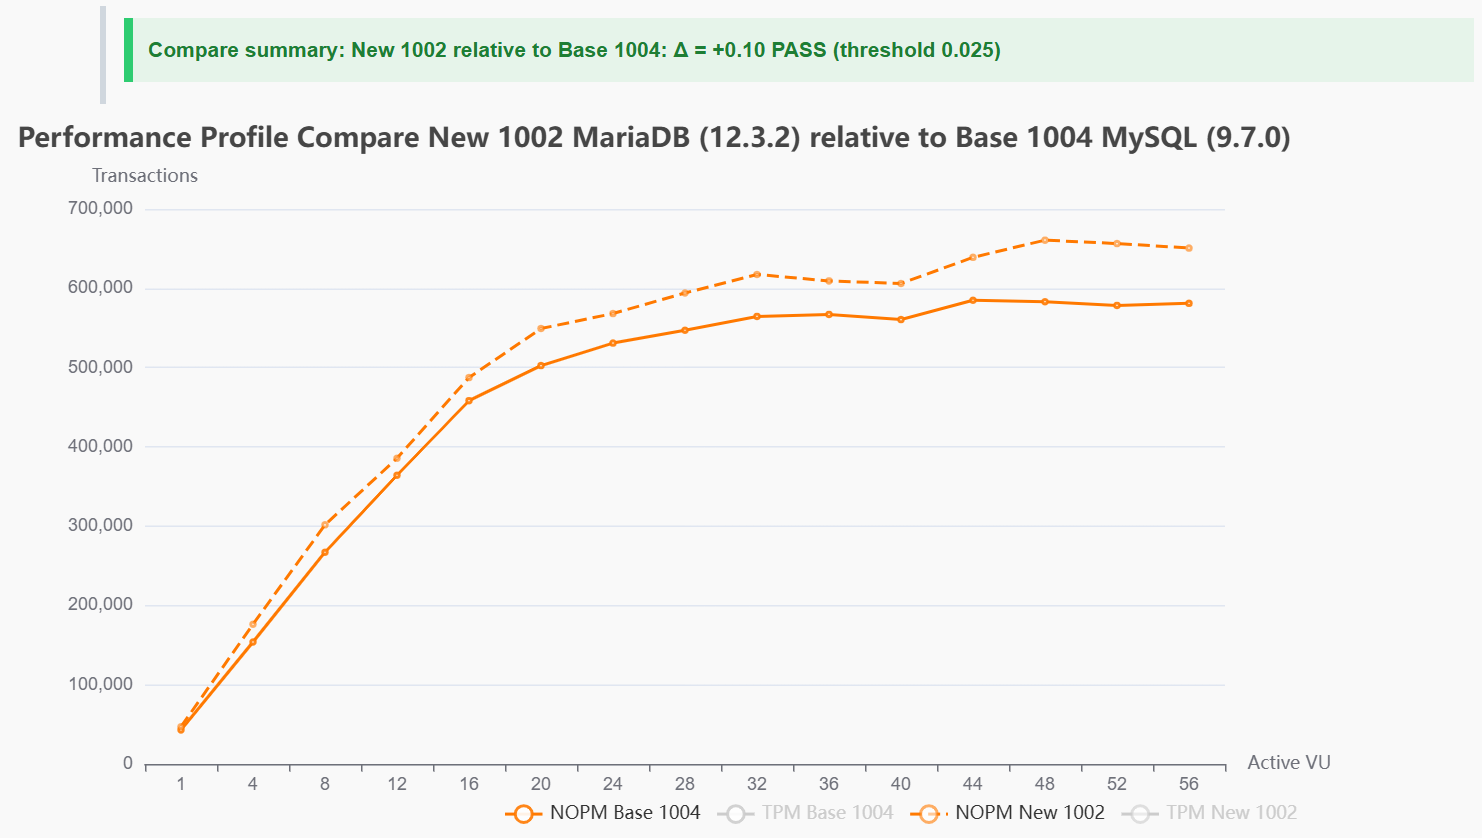
A HammerDB performance profile shows how a database scales on a system as virtual users increase.
That profile is important because database performance is not a single point. It is a curve. A system may scale cleanly at lower load, flatten at higher load, or reach a point where adding more users no longer increases throughput.
HammerDB has always supported performance profiles. What is new in HammerDB v6.0 is the ability to compare one performance profile against another.
A saved baseline profile can now be compared with a new run, showing the difference across the full workload curve. That makes changes easier to review when testing database versions, configuration changes, platform updates or new builds.
Instead of looking at two separate profile runs side by side, HammerDB v6.0 shows the comparison directly. The result makes it clear where the new run is ahead, where it is behind, and how the difference changes as load increases.
HammerDB v6.0 also adds a comparison summary with a threshold, so a profile comparison can be marked as pass or fail against an expected level of change.
With profile comparison, HammerDB v6.0 shows how the new run behaves against the baseline at each stage of the workload, not just whether the peak number changed.
That gives a practical way to use HammerDB profiles for repeatable regression checks, release validation and performance tracking.
HammerDB v6.0 makes performance profile comparison easier to review, explain and repeat.
One of the biggest mistakes in database benchmarking is oversizing the workload until response times are measured in hundreds of milliseconds, or even seconds.
A large throughput number is not enough if the workload is already spending too long waiting. The result may look impressive at the top level, but the response times tell a different story.
The databases supported by HammerDB are all mission-critical, enterprise-class databases. At high performance, response times should be in the sub-millisecond or low millisecond range for complex stored procedures combining multiple SQL statements.
HammerDB v6.0 makes the latency profile visible.
The new response time metrics show how long individual transactions take across the run, with full percentile reporting and box plots for the key transaction types.
That means the result can show the median, higher percentiles, spread and outliers, not just an average. Averages hide too much. Percentiles show whether the system is delivering consistent low latency or whether part of the workload is already queueing behind longer waits.
HammerDB v6.0 also adds reservoir sampling for long runs. This keeps response time analysis practical even when a workload generates a very large number of transaction timings.
For long-running tests, that is important. You want the latency distribution, percentiles and outliers without turning the response time data itself into a bottleneck.
As virtual users increase, throughput and response time should be reviewed together. If throughput rises but latency moves from milliseconds to hundreds of milliseconds, the workload has crossed into overload.
HammerDB v6.0 makes that easier to see.
Run the workload. Capture the throughput. Check the percentiles. Review the response time distribution.
HammerDB v6.0 makes database benchmarking show latency as well as throughput.
A faster database result means very little unless you know the system, CPU usage and I/O behind the run.
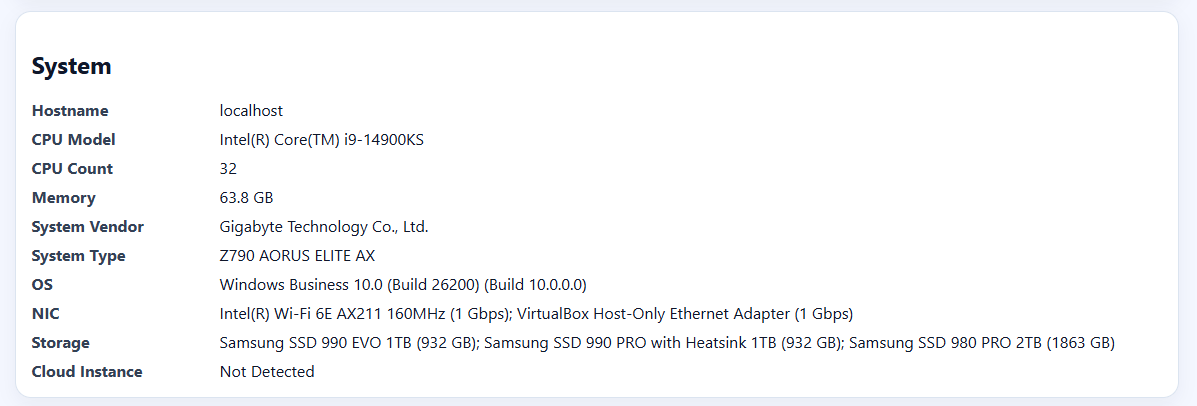
HammerDB v6.0 adds that detail to the result generated by the HammerDB Agent.
When the Agent runs a workload, it can now record system discovery information as part of the benchmark result. That includes CPU model, CPU count, memory, system vendor, system type, operating system, network interfaces, storage devices and detected cloud instance details.
The result is no longer just a database score. It shows the machine that produced it.
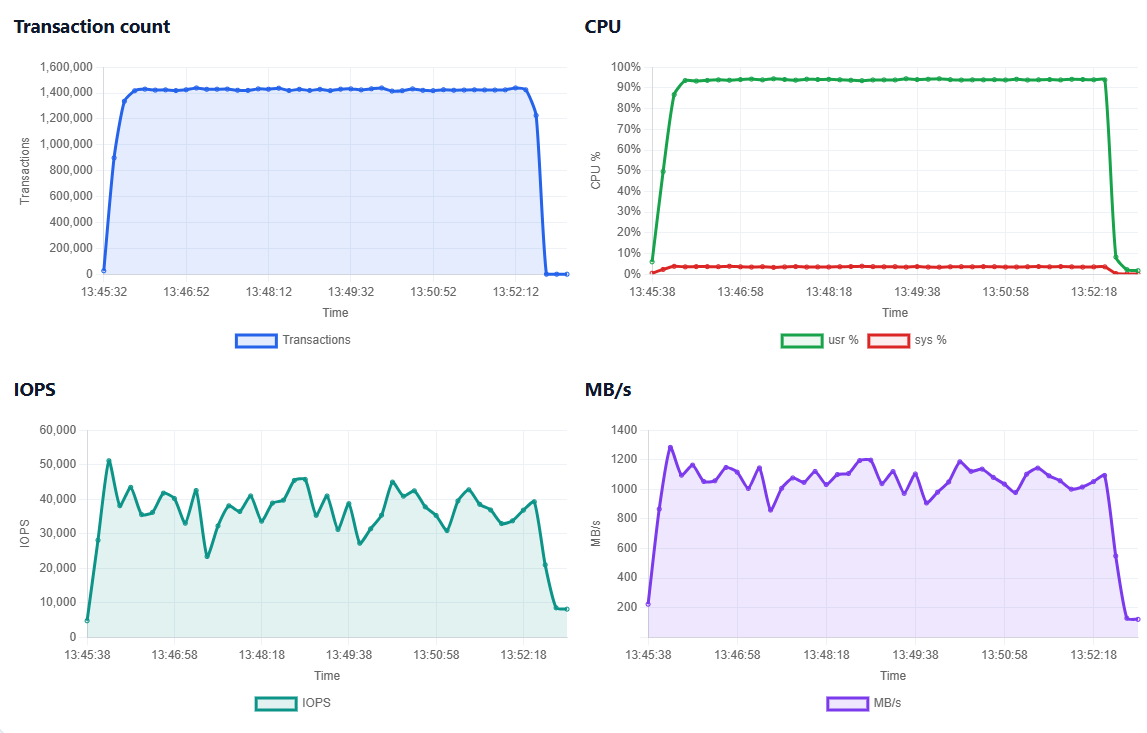
HammerDB v6.0 also adds I/O workload metrics from the run, so it now includes transaction count, CPU utilisation, IOPS and throughput in MB/s.
That gives a clearer view of what happened during the test: how much work was completed, how heavily the CPU was used and how much storage activity the workload generated.
For database version testing, platform comparisons, storage evaluation and cloud instance sizing, this gives each result the context needed to compare runs properly.
Two database results can look similar at the headline level but behave very differently underneath. One may be CPU-bound. Another may be pushing storage harder. Another may be running on a completely different class of system.
With HammerDB v6.0, the Agent captures more of that evidence in the result itself and experts can continue to drill down into per-core utilisation during the run.
HammerDB v6.0 makes the run explain the result, not just report the score.
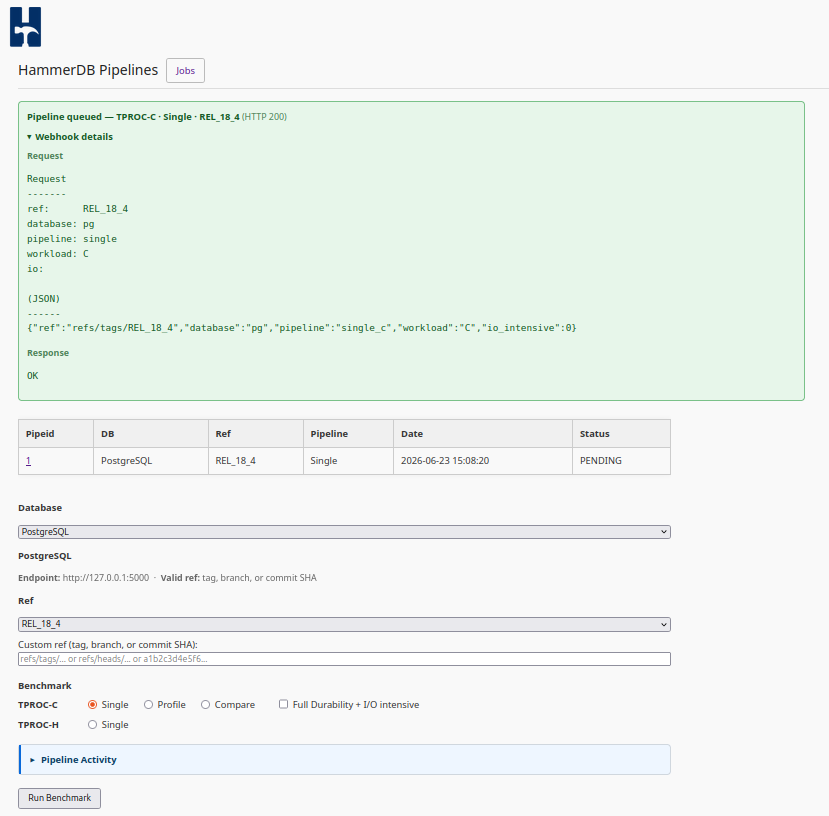
HammerDB v6.0 now fully automates database performance testing for MariaDB, MySQL and PostgreSQL.
Clone the database. Build it. Install it. Start it. Create the schema. Load the data. Run the workload. Capture the result.
HammerDB v6.0 does the whole pipeline without user intervention. Triggered by web service, manual command or GitHub webhook.
For anyone working with MariaDB, MySQL or PostgreSQL, this removes the need to build a private test harness before performance testing can begin. Any database branch, tag or commit, platform build or configuration change can be taken from source code to a running HammerDB workload and result artifact.
Track database development with repeatable performance evidence from every build, branch and release.
No performance engineer?, no problem. Start the pipeline. Let it run. Review the evidence.
If you use MariaDB, MySQL or PostgreSQL, this is for you. Developers can test new branches. DBAs can validate changes. Platform teams can compare builds and systems. Open-source communities can share performance evidence without relying on one-off scripts or private lab processes.
HammerDB already supports Oracle, SQL Server, Db2, PostgreSQL, MySQL and MariaDB. With v6.0 automation, the open-source engines now get a full pipeline for turning source code into trusted database performance results and informed decisions.
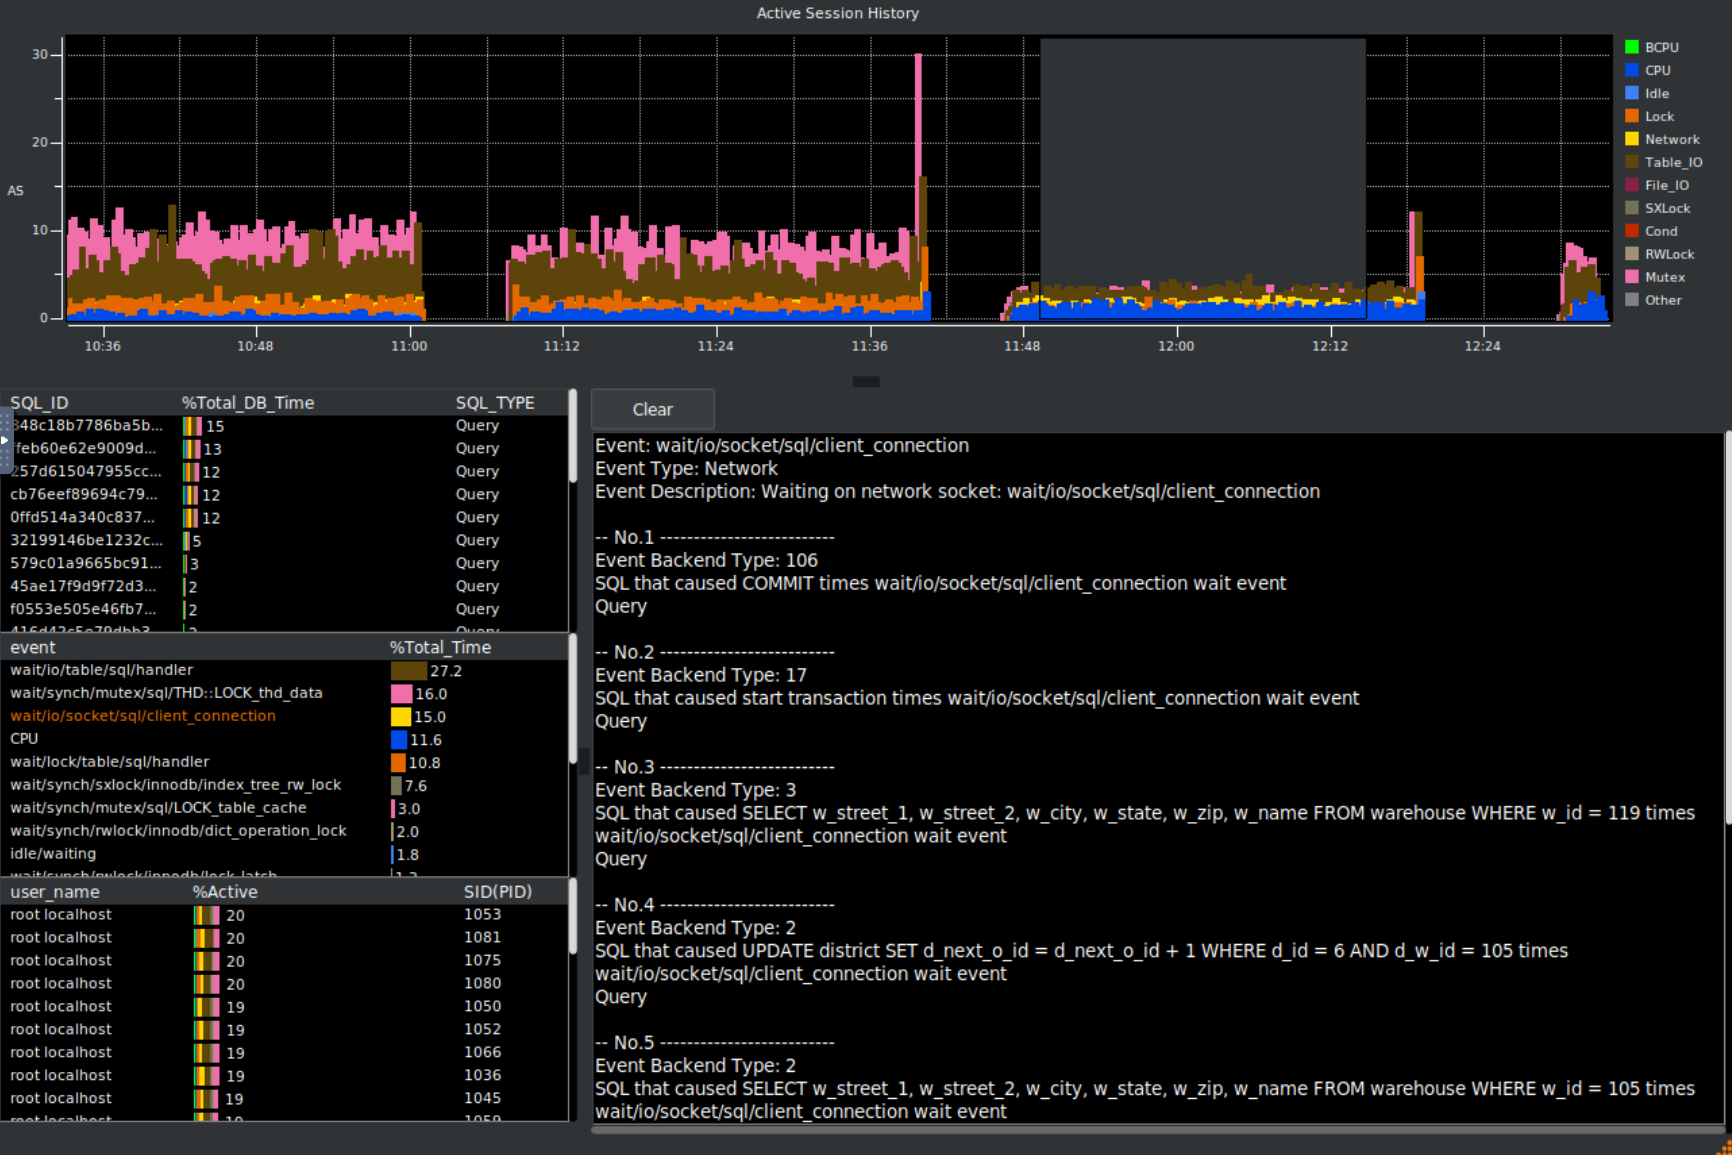
HammerDB already provides Active Session History style analysis for Oracle and PostgreSQL. With HammerDB v6.0, that capability is now available for MariaDB and MySQL as well.
This means a benchmark run can show more than the final throughput number. HammerDB can display active database sessions over time for MariaDB and MySQL, broken down by wait class, event, SQL, session and user.
During a workload, the ASH view helps show where database time is being spent: CPU, locks, table I/O, file I/O, network waits, mutexes, row locks and storage engine activity.
The example shown here captures a MariaDB/MySQL workload while HammerDB is driving load, with drill-down into the waits and SQL contributing most to database time.
For MariaDB and MySQL users, this brings the same workload visibility already available in HammerDB for Oracle and PostgreSQL into the open-source database testing workflow.
HammerDB v6.0 continues the focus on repeatable benchmark results backed by the evidence behind the run: workload, metrics, response times and now deeper active session analysis across more database engines.
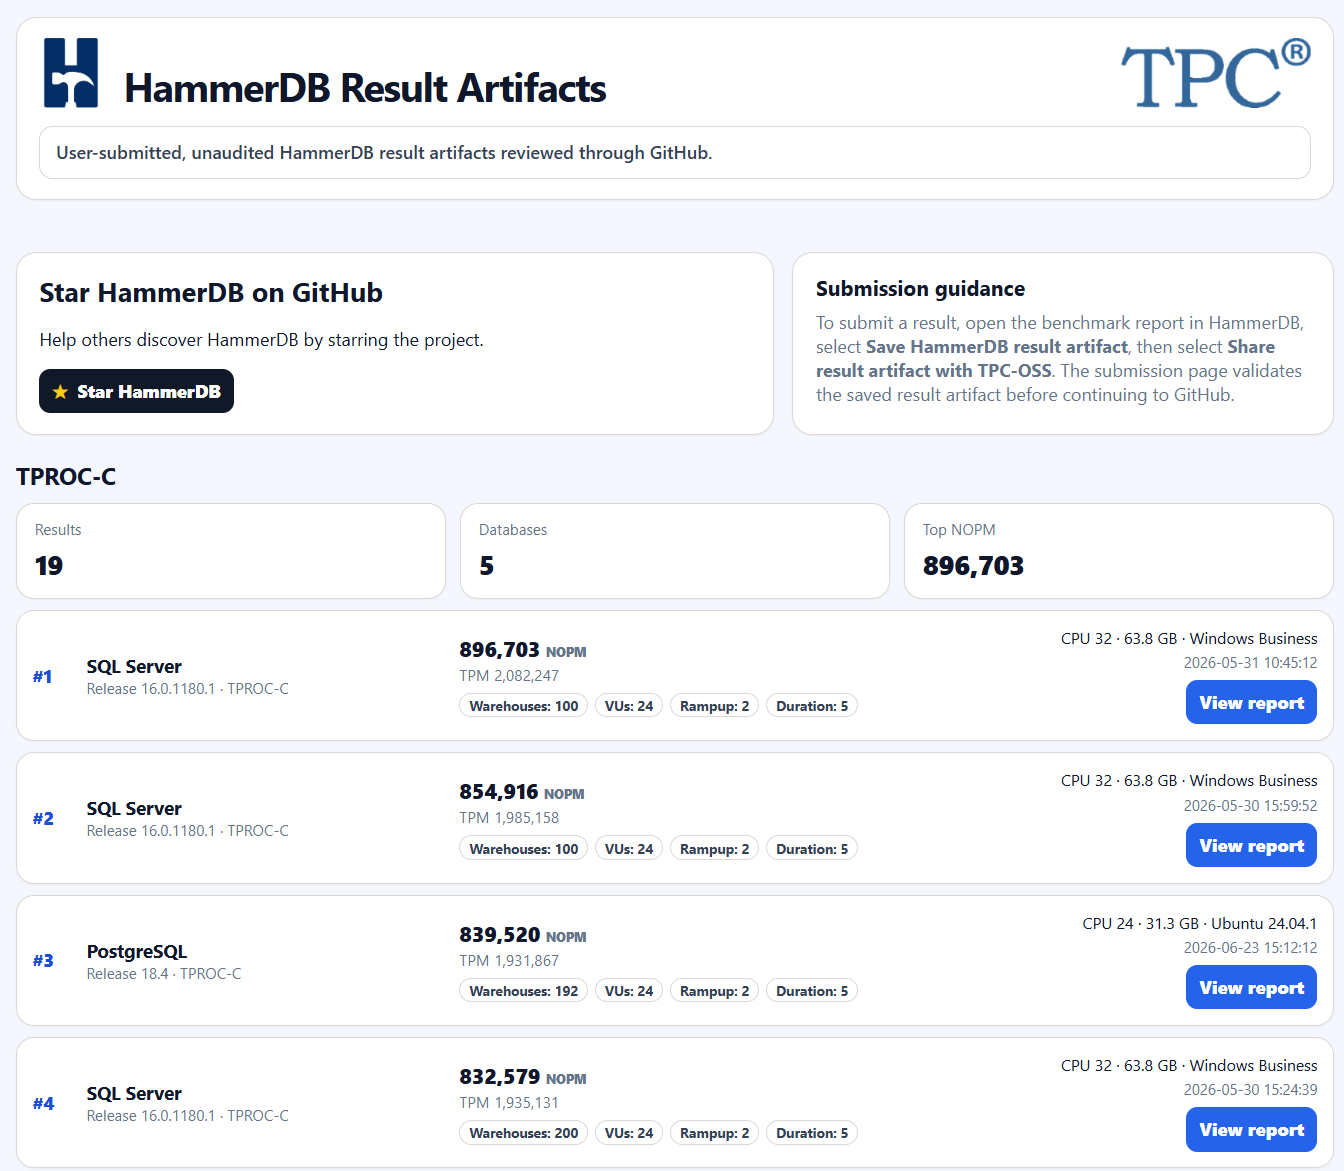
HammerDB v6.0 introduces result artifacts: saved benchmark result files that can be reviewed locally and shared through the TPC-Council community results repository on GitHub.
This was one of the main goals discussed at TPCTC 2025 in London. The TPC-Council wanted HammerDB users to have a clearer way to share community benchmark results with the details of the test preserved alongside the result.
A HammerDB result artifact keeps the benchmark output together with the information needed to understand how the test was run and a number of enhancements were made to HammerDB at the request of TPC-OSS members. In particular the agent was improved to do system discovery at the start of a run, to improve the capturing of response time metrics and to record I/O metrics in addition to the existing CPU metrics.
What a result artifact contains
A result artifact records the key information from a HammerDB benchmark run, including:
the benchmark workload
the database engine
the database version
the workload configuration
the system details
the benchmark result
runtime metrics
response-time profile data
This gives users a structured result file instead of relying only on screenshots, copied console output or a single performance number.
Community result sharing
HammerDB v6.0 uses result artifacts as the basis for community result sharing.
The workflow is:
Run a HammerDB benchmark.
Save the result artifact.
Review the generated benchmark report.
Submit the artifact through the TPC-Council community results workflow on GitHub.
The result can then be reviewed with the workload, system, configuration, metrics and profile data attached to it at the TPC-Council Github site https://tpc-council.github.io/hammerdb-results/index.html
The examples shown are prototype tests to validate the process for Windows and Linux not accepted artifact results.
Result Artifact Example
Firstly run a HammerDB benchmark against your chosen database. The more detail that you gather as part of a run, the more evidence you can provide for a reviewer to accept your artifact. Key examples are:
Enable time profiling
Run the transaction counter
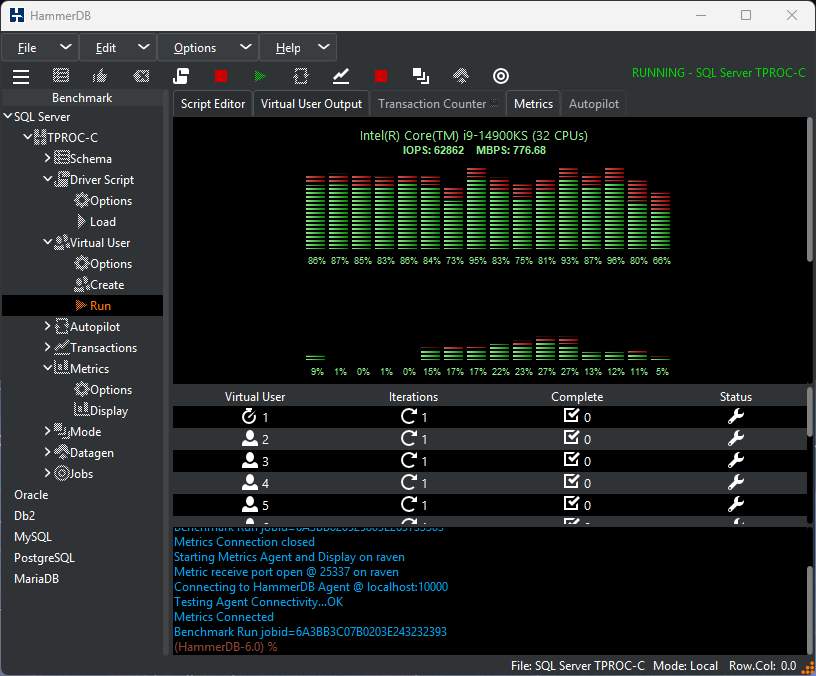
Run the hammerdb agent for system discovery and metrics capture
After the run in the HammerDB webservice click on the JobID and select option 1 Benchmark report.
Scroll to the bottom of the report and you will see the options to Save and Share the result artifact.
The artifact can be saved to your local PC.
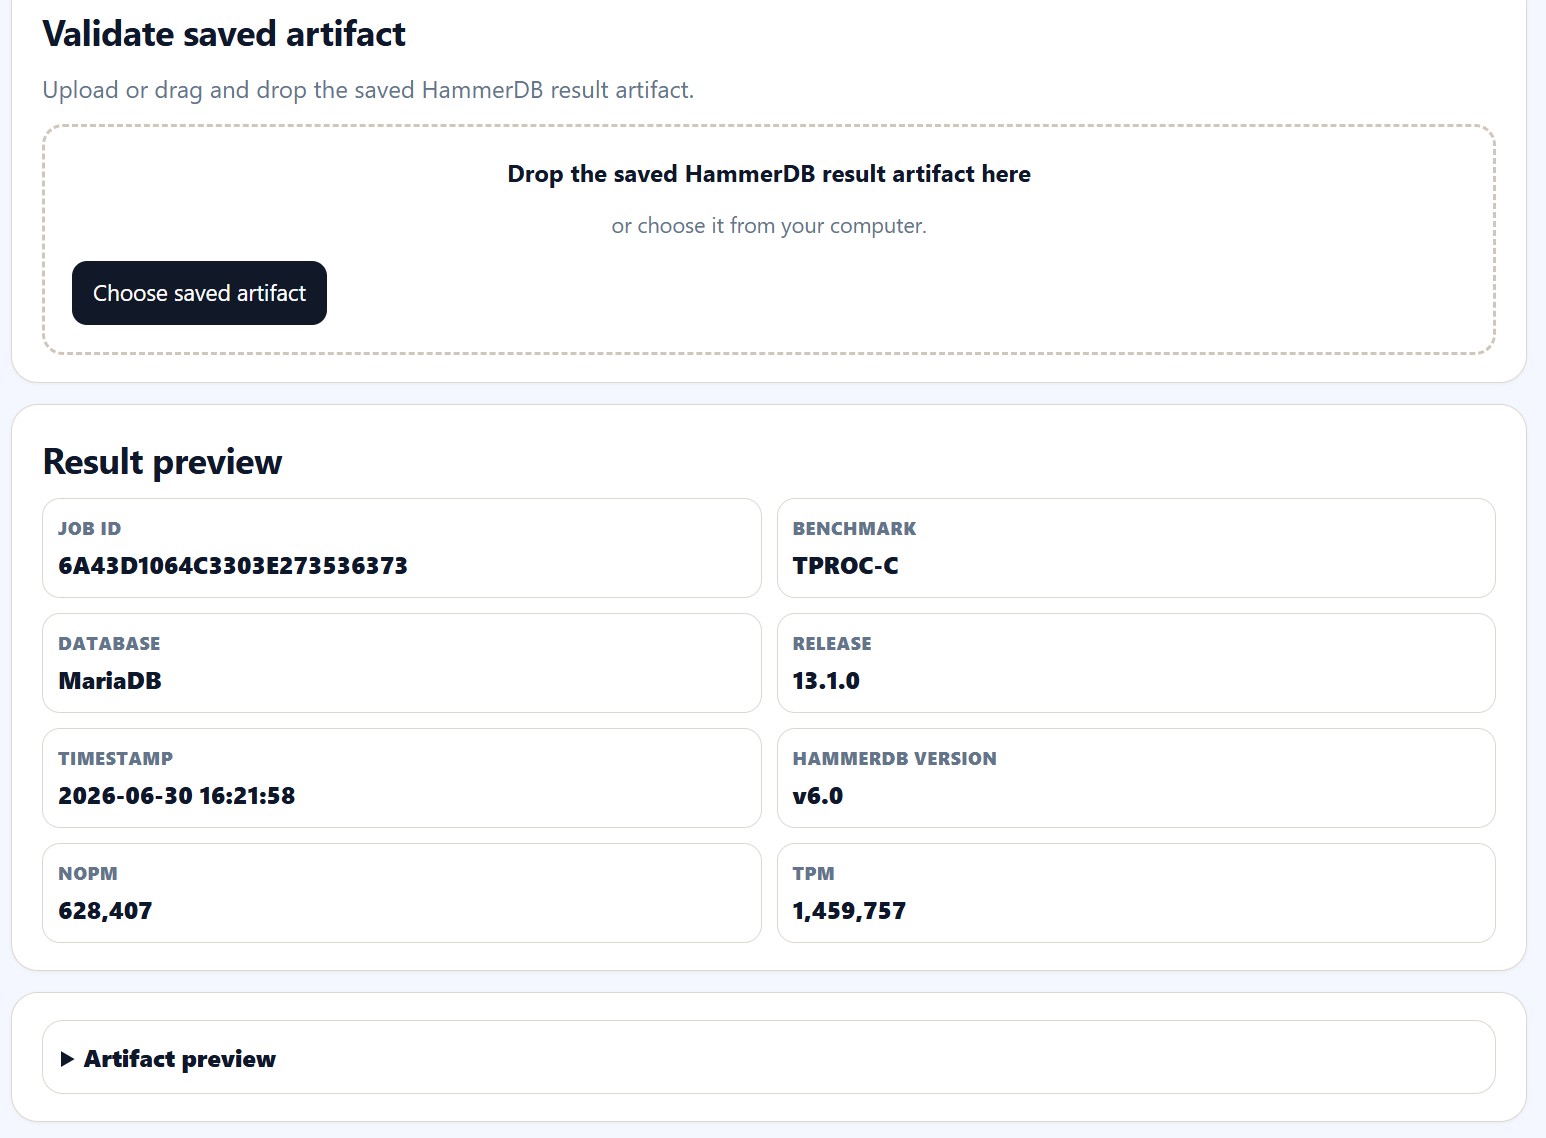
There is a preview page on the HammerDB website, which will validate the artifact and show the results and charts. HammerDB will not capture or retain any data from uploaded artifacts.
The artifact is machine readable and AI compatible for analysis.
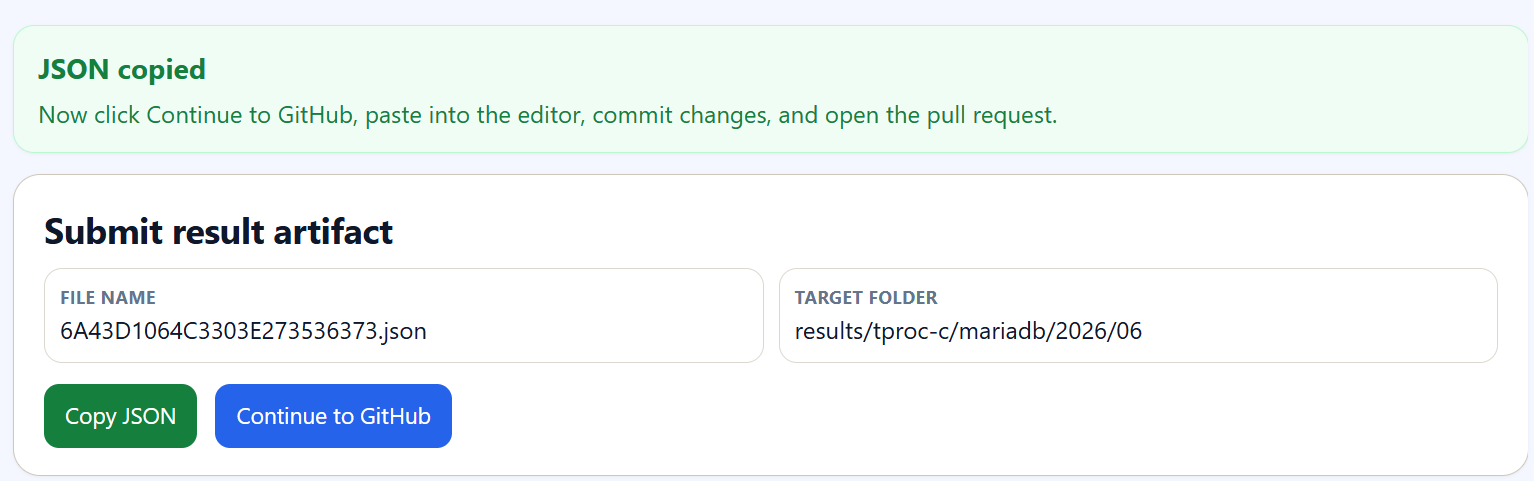
When ready navigate to the Submit page from either the benchmark report page or the HammerDB results page and upload the artifact. The submit page will check the artifact structure and also whether it is a duplicate. When the page shows Ready to submit, click Copy JSON to load the artifact into your clipboard.
When the artifact is loaded, Continue to GitHub.
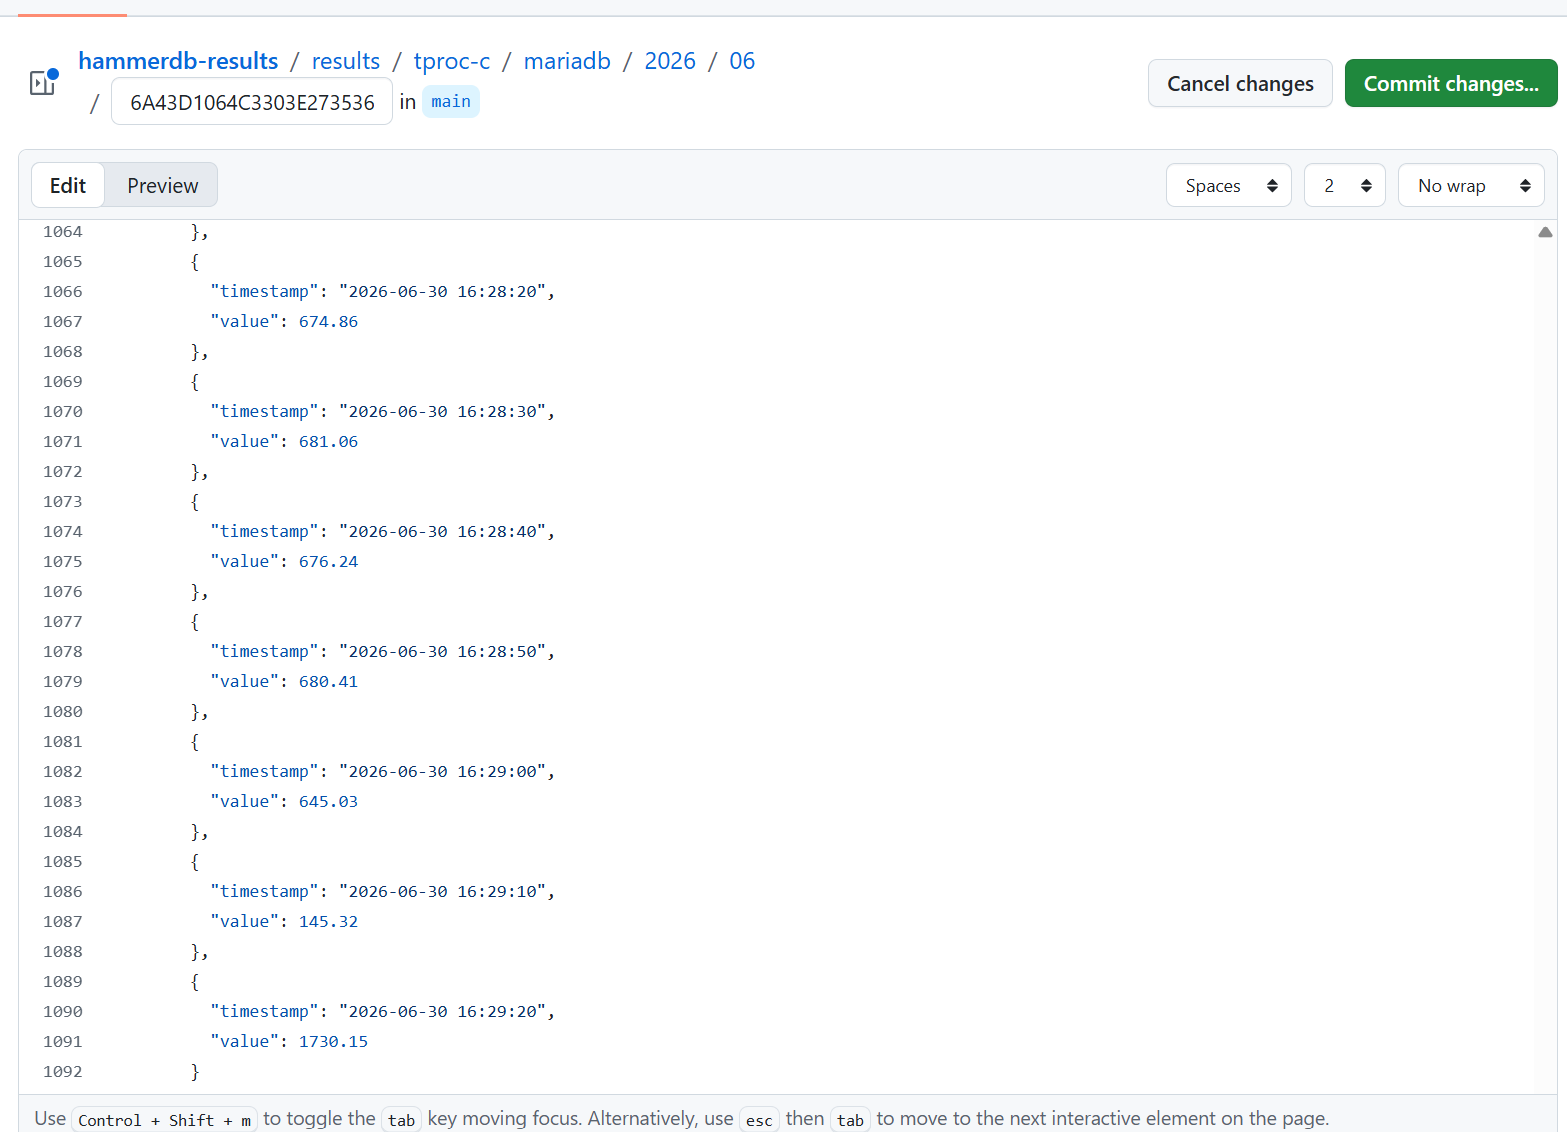
Paste the results into the GitHub HammerDB page and commit the changes. Follow the path to propose new changes via a pull request. The TPC-OSS subcommittee team will review the changes, follow up with additional questions and approve valid results.
Community results and community process
HammerDB community results are not audited TPC benchmark results. They are open-source shared artifacts. The entire process is open and transparent and hosted on GitHub which was a key decision of TPC-OSS. Anyone can contribute to HammerDB and the HammerDB results process. Anyone can join the TPC and participate in the TPC-OSS subcommittee to shape the future of sharing trusted open source database benchmarks. Result artifacts are the first step on the journey.
They are open community results shared through the TPC-Council GitHub workflow. The purpose is to make HammerDB benchmark results easier to save, review and discuss while keeping the test context attached to the result.
Formal audited TPC benchmark results remain a separate process.
At TPCTC 2025 in London, we set out where HammerDB was heading next: not just repeatable database benchmarking, but making the evidence behind a benchmark easier to save, review and share.
HammerDB v6.0 is now live.
This release adds result artifacts that can be saved, reviewed and shared through the TPC-Council community results repository on GitHub.
A benchmark number on its own is not enough. The workload, system, configuration and metrics behind the result matter too.
HammerDB v6.0 provides a cleaner path from a test run to open, transparent database performance evidence.
New in HammerDB v6.0
The main new features in HammerDB v6.0 include:
Result artifacts for saving, reviewing and sharing benchmark results.
Automated benchmark pipelines for repeatable database performance testing.
Profile comparisons to compare benchmark runs and identify what changed.
ASH-style analysis for MySQL and MariaDB to show waits, contention and database activity during a workload.
System discovery to capture platform details as part of the benchmark result.
I/O metrics to record IOPS and throughput alongside the benchmark output.
Response Time percentiles and sampling for enhanced l
Community result sharing
The result artifact is the first step in making HammerDB benchmark results easier for the community to share and review.
It captures the key information behind a run, including the workload, database, system, configuration, metrics and result data. This gives users more context than a single performance number and makes it easier to understand how a result was produced.
These are HammerDB community results. They are not audited TPC benchmark results, but they provide an open way for users to share benchmark evidence through the TPC-Council GitHub workflow.
Database support
HammerDB continues to support Oracle, SQL Server, Db2, PostgreSQL, MySQL and MariaDB.
HammerDB v6.0 supports TPROC-C for transactional workloads and TPROC-H for analytical workloads.
Follow-up posts
This is the first in a short series of posts on HammerDB v6.0.
Follow-up posts will look in more detail at result artifacts, automated benchmark pipelines, profile comparisons, ASH for MySQL and MariaDB, system discovery and I/O metrics.
I’ll be presenting at MariaDB Day 2026 in Brussels on HammerDB performance tuning and benchmarking methodology that delivers real-world architectural impact, How MariaDB Achieved 2.5× OLTP Throughput in Enterprise Server 11.8. This blog post provides some of the insights and background that went into this work.
In 2025 HammerDB began working with MariaDB engineering to analyse OLTP scalability on modern hardware platforms and to identify architectural bottlenecks that limit throughput at scale. The goal was not to tune a benchmark, but to use accurate, comparable and repeatable workloads to identify fundamental serialization points in the database engine. You can read the blog post here on the results of that work: Performance Engineered: MariaDB Enterprise Server 11.8 Accelerates OLTP Workloads by 2.5x
To deliver improvements as quickly as possible, these changes were introduced in MariaDB Enterprise Server 11.8.3-1, with updates further progressing into the community version from MariaDB 12.2.X onwards.
Note: It has been highlighted that some recent public benchmarks of MariaDB evaluated earlier MariaDB 11.8 Community builds that did not yet include these scalability improvements. To observe the latest performance engineering benefits you should use the latest version of MariaDB Enterprise Server 11.8.3-1 or above or MariaDB Community Server 12.2.1 (latest version at the time of publishing of this blog).”
1. Why Modern Hardware Changes Database Scaling
You may notice that the subtitle explicitly says MariaDB 11.8 delivers up to 2.5x higher OLTP throughput on Dell PowerEdge R7715 servers powered by AMD EPYC™ processors. Database performance can never be viewed in isolation from the hardware. If you have a familiarity with Moore’s Law you will know that CPU transistor density historically doubled approximately every two years, leading to faster, cheaper, and more efficient computing power. However, in the chiplet era, performance scaling is no longer driven purely by transistor density—system architecture, topology, and interconnect design now dominate real-world database scalability.
Amdahl’s Law, USL, and CPU Topology
The classic underlying scaling model applied by performance engineering is Amdahl’s Law, which states that overall speedup is limited by the serial fraction of a workload. Even small serial sections cap scalability as core counts rise. The Universal Scalability Law extends this by modelling contention and coherency overheads, explaining why performance can plateau or even regress at high concurrency.
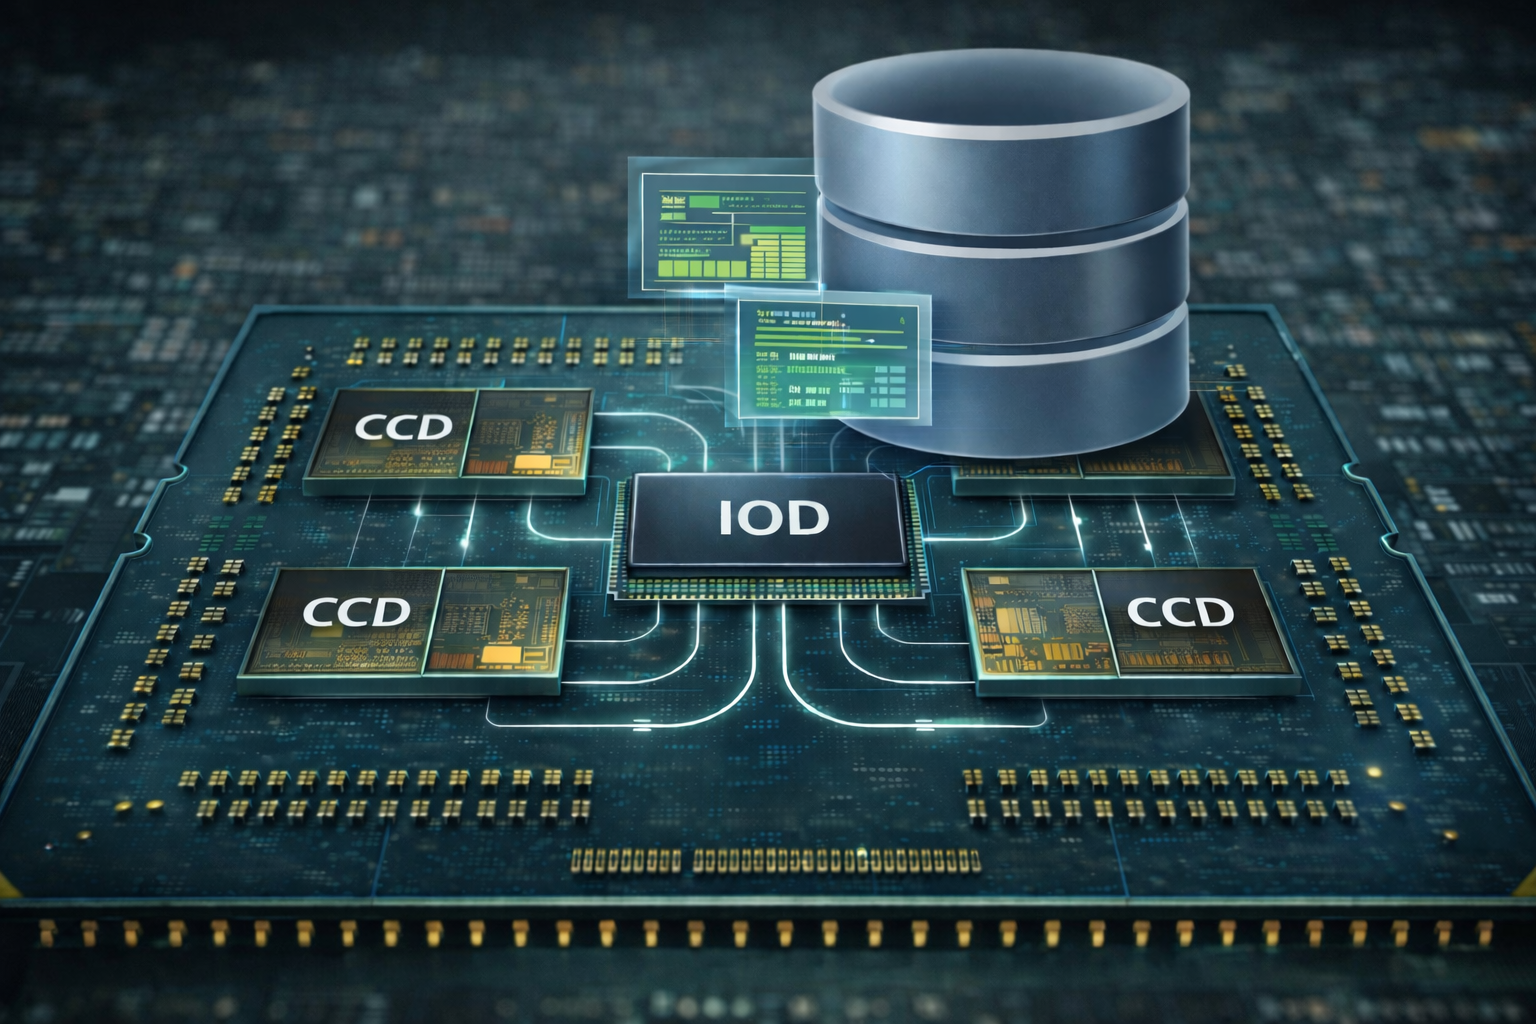
In the chiplet era, CPU topology adds another dimension: NUMA boundaries and interconnect latency now create intra-CPU scaling knees that classical models did not explicitly predict. Modern database performance engineering therefore requires topology-aware analysis, not just thread-level scaling curves. For this reason we partnered with StorageReview to access the very latest Dell system to evaluate MariaDB performance.
The server platform used was a Dell R7715 equipped with:
AMD EPYC 9655P 1 x 96 cores / 192 threads
768 GB RAM (12 x 64GB)
Dual PERC13 (Broadcom NVMe RAID)
Ubuntu 24.04
Given the topology focus it is vital to cross-reference performance research on multiple systems. The results were also verified and additional testing conducted on systems based on the following CPUs:
HammerDB implements the TPC-C workload model as an open-source, fair-use derivative called TPROC-C. It is designed from the ground up for parallel throughput and modern hardware scaling. In 2018 HammerDB was adopted by the TPC and is hosted by the TPC-Council with oversight via the TPC-OSS working group to ensure independence and fairness. HammerDB supports not only MariaDB, but Oracle, Microsoft SQL Server, IBM Db2, PostgreSQL and MySQL running natively on both Linux and Windows, enabling a wide range of workloads and insights. Anyone can contribute to HammerDB.
TPC-C trademark and naming
Although hosted by the TPC-Council, HammerDB does not use ‘TPC’ or ‘TPC-like’ terminology as defined by the TPC fair use policies. TPC-C is a trademarked benchmark requiring audit and configuration disclosure. Non-audited workloads should be labelled ‘TPC-C-derived’ and not use TPC-C or tpmC in its naming, hence the HammerDB TPROC-C workload. Using the trademark without audit and disclosure not only violates the TPC trademark but can mislead readers about comparability with published results.
Transaction metric: tpmC and NOPM
TPC-C defines performance in committed New-Order transactions per minute (tpmC). HammerDB defines its own TPROC-C metric called NOPM which means (New Orders Per Minute). HammerDB also provides a database engine metric measurement called TPM (transaction per minute), however TPM cannot be directly compared between database systems. A system may execute more database transactions while completing fewer workload transactions. This also extends to low level database operations such as SELECT, INSERT, UPDATE, and DELETE statements. NOPM is the meaningful metric to measure TPC-C derived workloads.
The TPC-C specification defines a single schema with N warehouses. Multiplying schema instances (for example, 10 schemas × 100 warehouses) removes contention and changes scaling behaviour, effectively benchmarking a sharded architecture rather than a single schema. HammerDB implements both cached and scaled derived versions of the TPC-C specification, both enable scaling to 1000’s of warehouses without the need for sharding.
Warehouse access patterns and I/O bias
The cached implementation of HammerDB follows the default implementation concept of virtual users having a home warehouse. HammerDB also has an option called “use all warehouses” where random warehouse access patterns are intended to drive physical I/O and bias benchmarks toward storage rather than database concurrency control and buffer pool management. Cached workloads are typically used to observe core engine scalability.
With HammerDB we have a proven methodology known from years of observation to align system comparison ratios with official audited TPC-C results.
3. MariaDB 10.6 Baseline and Analysis
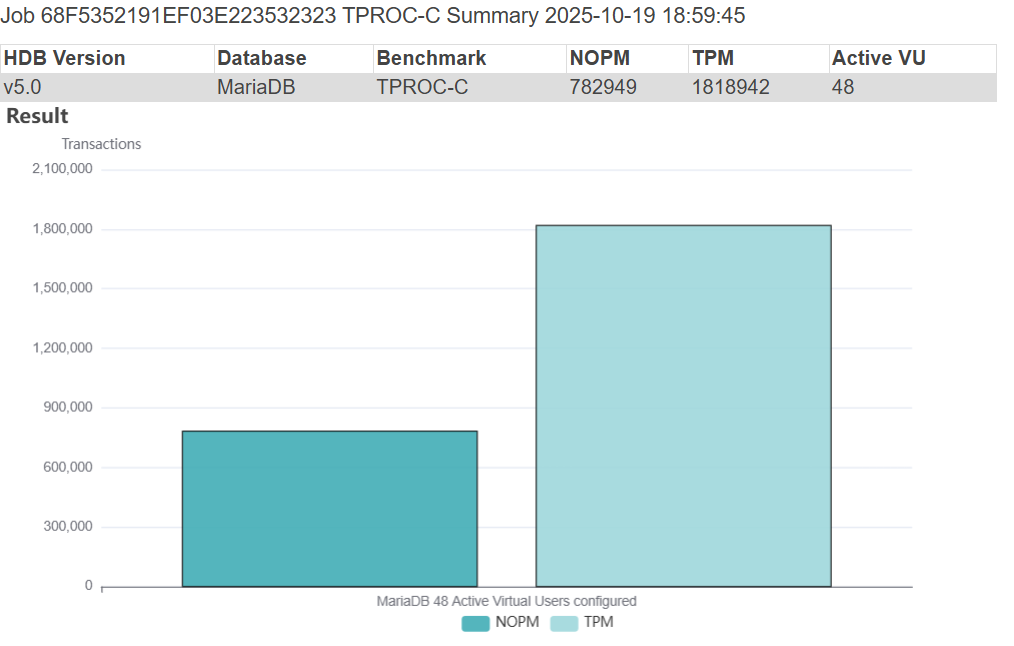
HammerDB generates graphical insight of workloads for you automatically, and the initial run of MariaDB 10.6.23-19 produced a highly respectable throughput of 782,949 NOPM which aligns with 1.8M database transactions per minute (i.e. stored procedure commits and rollbacks). As noted with topology aware scaling our peak performance was measured at 48 Active Virtual Users aligning with the CPU architecture but below the system physical core and thread count.
HammerDB MariaDB 10.6 Result
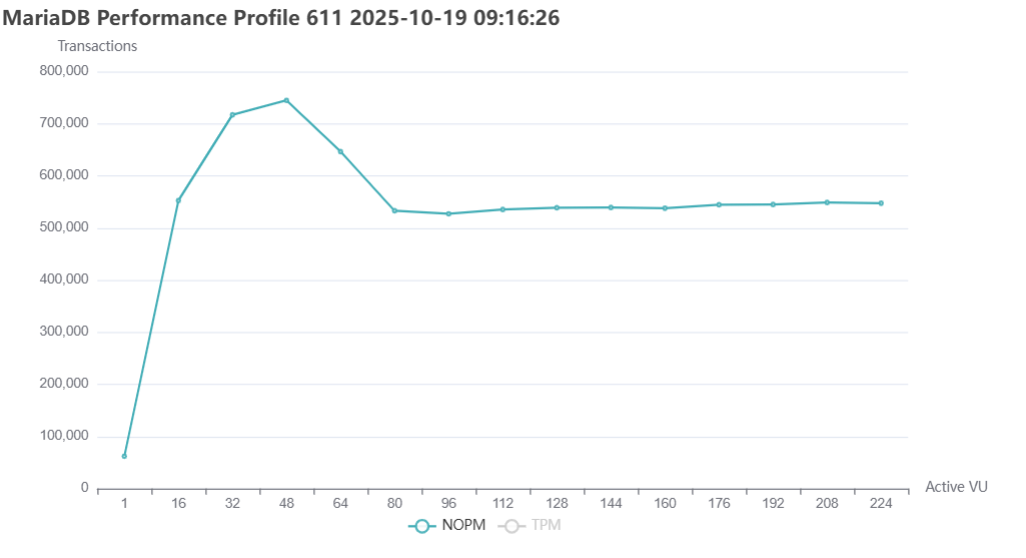
HammerDB can group related performance jobs into performance profiles. As shown in the graph this simply shows the results of repeated individual performance tests with the Virtual User count increased. It can be observed that although performance peaked at the hardware-defined 48 Virtual users it then decreased and levelled off when equalling the physical CPU count.
HammerDB MariaDB 10.6 Performance Profile
At high concurrency, the first clear symptom was time accumulating in native_queued_spin_lock_slowpath — a kernel sign that many threads are repeatedly contending on the same lock. Tracing that contention into the engine led directly to the transactional write path, and in particular mtr_commit, which appends redo records and advances the Log Sequence Number (LSN) on every commit.
Historically, LSN allocation and log buffer management were protected by a global lsn_lock, implemented as a futex (a fast userspace mutex). Futexes are efficient under light contention, but when many threads compete for the same lock they can become a scalability bottleneck, effectively serialising redo log throughput.
As a solution, MariaDB engineering redesigned this path to remove the global lock. Instead, threads use atomic fetch_add to reserve non-overlapping slices of the log buffer and advance the LSN. What was previously a single serialized critical section becomes a scalable atomic allocation path — a key contributor to the step-change in OLTP throughput seen in MariaDB 11.8 on modern multi-core and chiplet-based systems and you can see the implementation here.
Historically, FLUSH TABLES WITH READ LOCK (FTWRL)—which freezes all writes during backups—used two separate metadata lock namespaces: one for global read locks and one for commit locks. This meant normal workload traffic was split across two independent contention points. When the newer BACKUP STAGE framework was introduced, these namespaces were merged into a single BACKUP lock namespace to simplify the code. While functionally correct, this change unintentionally collapsed two queues into one, concentrating all metadata lock traffic on a single shared data structure and significantly reducing scalability under high concurrency.
MariaDB engineering addressed this by introducing MDL fast lanes, which shard lightweight metadata locks across multiple independent instances while retaining a global path for heavyweight backup locks. Under normal operation, this restores parallelism by spreading contention across multiple lock instances, while still preserving strict correctness when a backup is in progress. In effect, a global metadata serialization point was split back into multiple scalable paths, shrinking the engine’s serial fraction once again.
4. MariaDB 11.8.3-1 Enterprise
Although MDEV-21923 and MDEV-19749 were the key implementations to scale the MariaDB database engine across CPU architectural boundaries, additional performance related MDEVs can be viewed in the MariaDB blog post. MariaDB Enterprise Server 11.8.3-1 was the first release to include all of these changes to identify and remove single points of contention in the transactional subsystem.
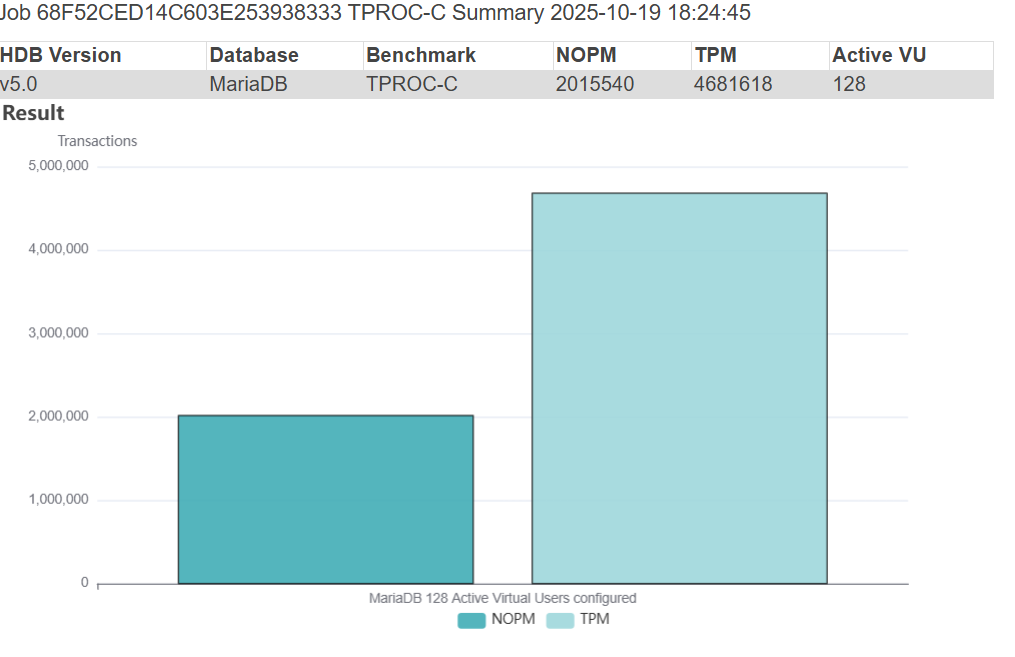
The result was 2,015,540 NOPM at 4.6M TPM for MariaDB Enterprise Server 11.8.3-1 more than 2.5X higher throughput than MariaDB 10.6.23-19 on the same server.
HammerDB MariaDB Enterprise 11.8.3-1 Result
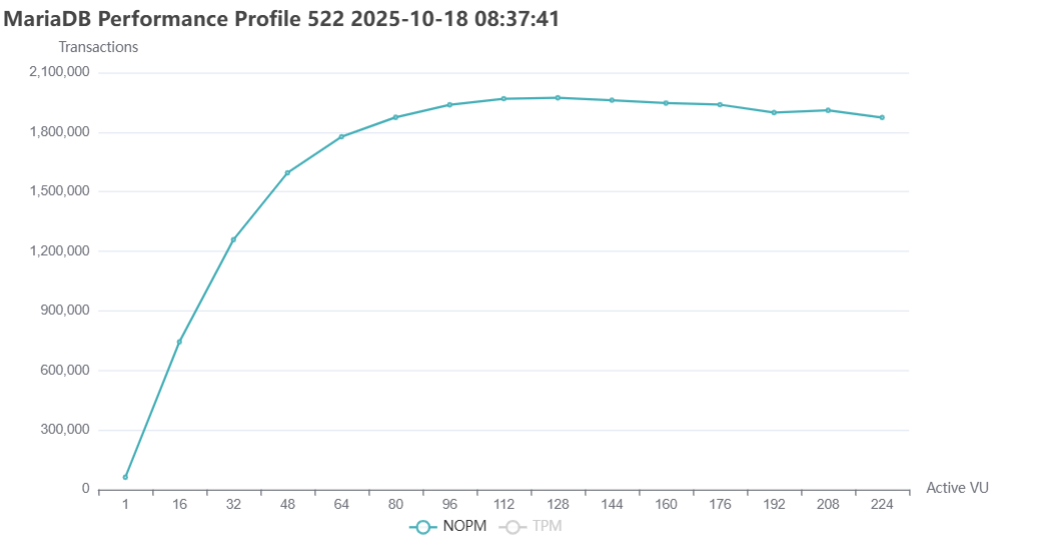
The resulting scalability curves closely follow extended USL predictions and align with hardware topology boundaries, indicating that core engine serialization has been substantially reduced.
As we have seen removing one point of serialization inevitably reveals the next. This is the nature of performance engineering at scale: each architectural fix shifts the scalability frontier.
Work is continuing to further improve concurrency and topology-aware scaling aligning MariaDB development with modern database hardware. HammerDB will continue to collaborate with MariaDB engineering to quantify these changes and provide reproducible, industry-standard benchmarks.
Conclusion
Modern database performance is shaped as much by hardware topology as by software design. Chiplet architectures have fundamentally altered scalability assumptions, and benchmarking methodologies must reflect this reality.
Failing to account for topology effects risks conflating software limitations with architectural boundaries. Database benchmarking in the chiplet era therefore requires explicit topology-aware analysis to remain a valid decision-making tool.
Most people don’t realise that benchmarks pre-date computers by decades.
The idea comes from land surveying. Long before software or databases existed, surveyors faced a simple problem: how do you measure something today and be confident you’re measuring the same thing months or years later?
The answer was the BENCH MARK — a fixed reference point, literally set into stone, that could be returned to again and again, knowing it hadn’t moved.
That original idea still matters.
The Core of a Benchmark: Repeatability
At its heart, a benchmark is about repeatability.
If you can’t repeat a measurement and get a comparable result, you don’t really have a benchmark — you just have a number.
That’s as true for database benchmarks as it was for surveying:
the same workload
the same schema
the same scalability
the same rules
the same measurement method
Change those, and you’ve changed what’s being measured.
Experimentation isn’t the problem — it’s the point. A good benchmark makes experimentation meaningful.
When the benchmark is repeatable, changing a single variable — hardware, configuration, software version, or scale — means any difference you observe can reasonably be attributed to that change. Cause and effect become visible.
But without a stable reference point, you’re guessing.
“Fine or Imprisonment for Disturbing This Mark”
Many historic survey benchmarks, particularly metal markers, include a warning stamped directly into them:
“Fine or imprisonment for disturbing this mark.”
But the mark itself wasn’t valuable. However, if it could be moved, every future measurement taken from it would be suspect. Accumulated knowledge depended on that reference point remaining exactly where it was. Instead, what was valuable was trust in the measurement.
“We Only Benchmark Our Production Systems”
The problem is that production is rarely a single system.
Over time, organisations accumulate many databases, platforms, and teams. People move on, systems evolve, and each measurement captures a moment that can’t easily be compared with the next.
Each result may be valid on its own, but without a common benchmark none of them relate to each other. You don’t end up with a strategy — you end up with isolated measurements tied to individual systems and people with different skill-sets, opinions and bias.
And once that happens, you don’t really have a database strategy at all.
You end up with a sprawl: different databases, different platforms, different operating systems, some on-prem, some in the cloud. Each measured differently, at a different time. The numbers don’t line up, and there’s no consistent view of performance — or of what any of it actually costs.
Why Repeatability Unlocks Understanding
Once a benchmark is accurate and repeatable, something important changes: you can start to understand why things behave the way they do.
You can:
compare hardware generations
evaluate configuration changes
understand scaling behaviour
measure cost versus performance
make decisions based on evidence rather than instinct
The goal isn’t to recreate every detail of production. It’s to create a stable reference point you can return to — today, next month, or next year — and trust that the comparison still holds.
In summary
The concept of benchmarks have lasted for centuries because they’re repeatable.
Long before databases or computers, someone looked at the problem of measurement and said: “If we want to measure something time and time again, we need a fixed reference point we can trust.”
That simple idea is still the foundation of benchmarking today.
In this post, we give a quick guide to getting HammerDB PostgreSQL metrics up and running with the pgsentinel extension from PostgreSQL build and install to running HammerDB.
Note that PostgreSQL metrics will also run on HammerDB for Windows, however this guide uses Linux as a more straightforward example for building and installing PostgreSQL extensions. Firstly download PostgreSQL from here http://www.postgresql.org.
Build PostgreSQL and Extensions
Extract the PostgreSQL source into a directory called /opt/postgresql-18.0, cd to this directory, build PostgreSQL and install it. in this case /opt/postgresql18.
/opt/postgresql18$ ./bin/pg_ctl start -D ./DATA
waiting for server to start.....2025-11-14 17:11:15.179 GMT [11871] LOG: starting PostgreSQL 18.0 on x86_64-pc-linux-gnu, compiled by gcc (Ubuntu 13.3.0-6ubuntu2~24.04) 13.3.0, 64-bit
2025-11-14 17:11:15.179 GMT [11871] LOG: listening on IPv4 address "127.0.0.1", port 5432
2025-11-14 17:11:15.190 GMT [11871] LOG: listening on Unix socket "/tmp/.s.PGSQL.5432"
2025-11-14 17:11:15.193 GMT [11877] LOG: database system was shut down at 2025-11-14 17:10:46 GMT
2025-11-14 17:11:15.196 GMT [11871] LOG: database system is ready to accept connections
2025-11-14 17:11:15.197 GMT [11880] LOG: starting bgworker pgsentinel
done
server started
Login to PostgreSQL and create the pg_stat_statements and pgsentinel extensions.
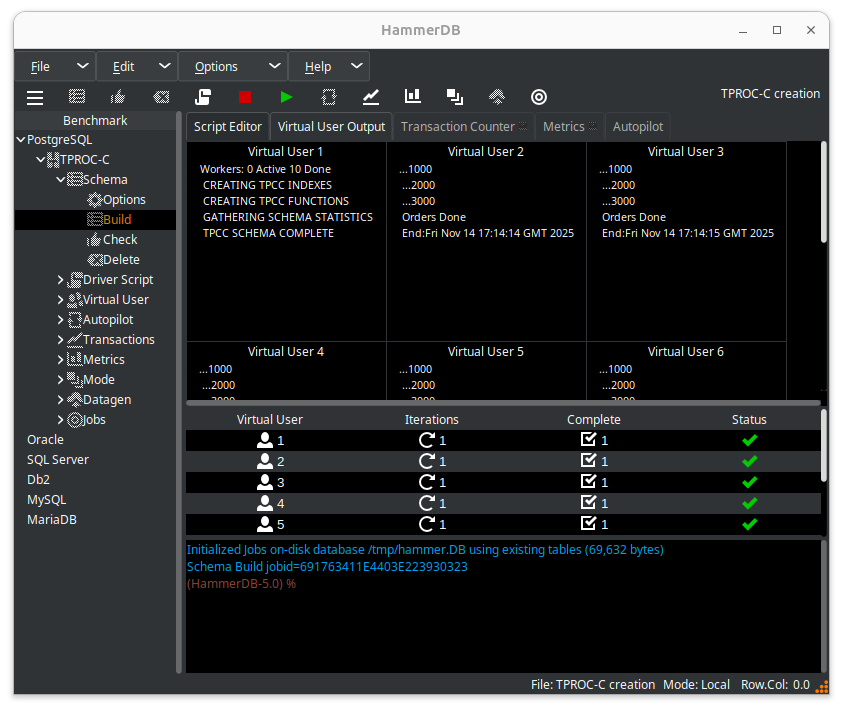
Run HammerDB and create a PostgreSQL schema, in this example we use TPROC-C.
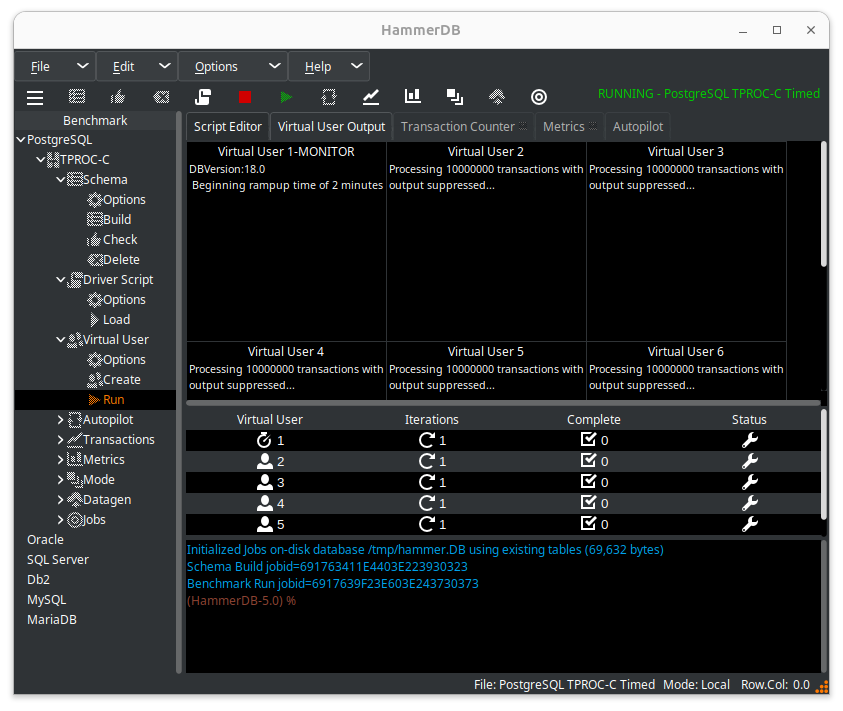
Once the schema is built, run the HammerDB workload.
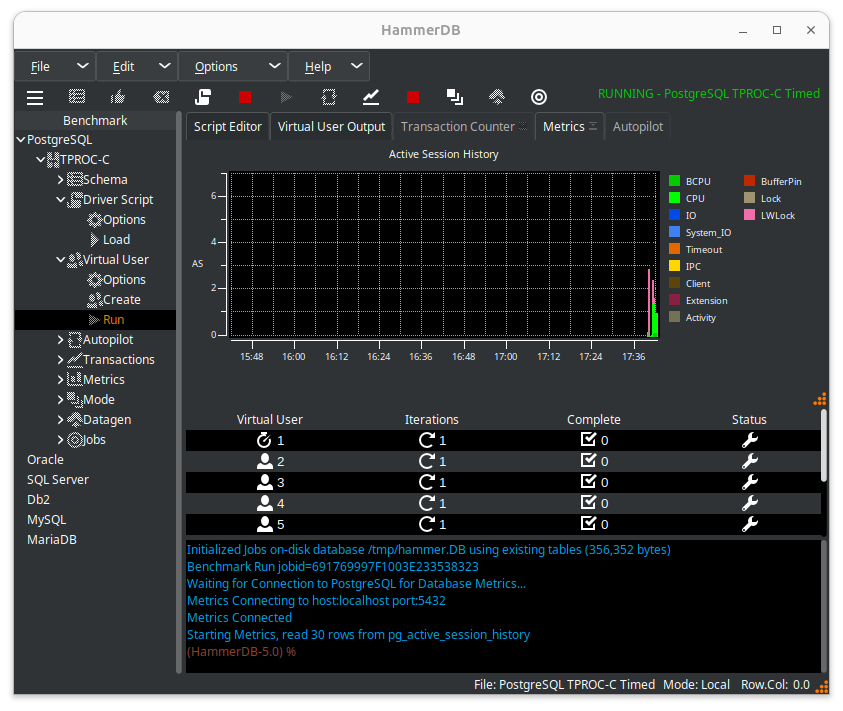
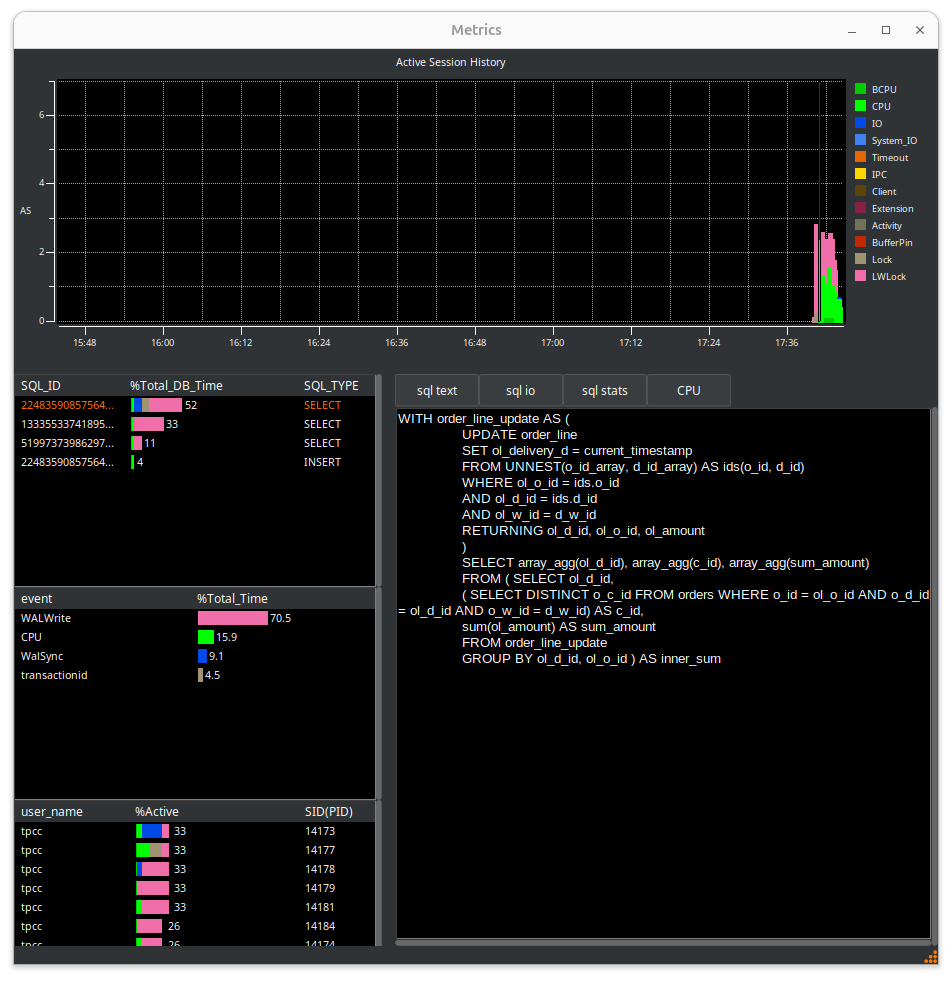
Hit the metrics button, you now see the HammerDB Active Session History overview.
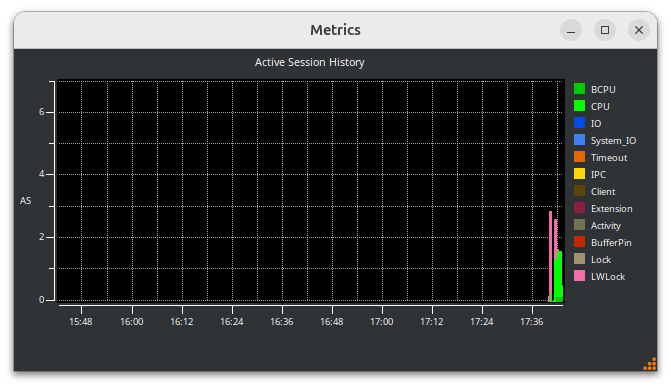
Grab the Metrics tab from the notebook and drag the window out. Grab the corner of the Window to expand it fully. Note, you can also shrink and expand the graph pane separately.
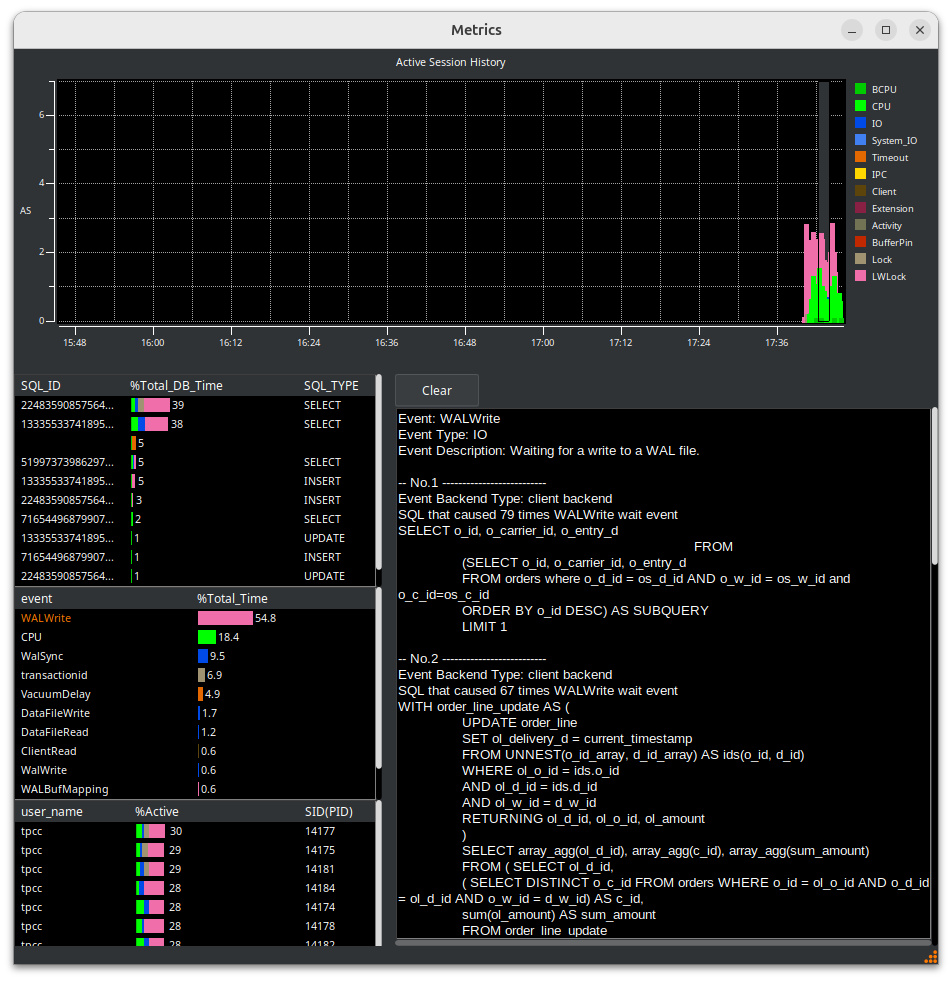
You now see the full details of the PostgreSQL workload. In this view, we can see WALWrite immediately as the main wait event.
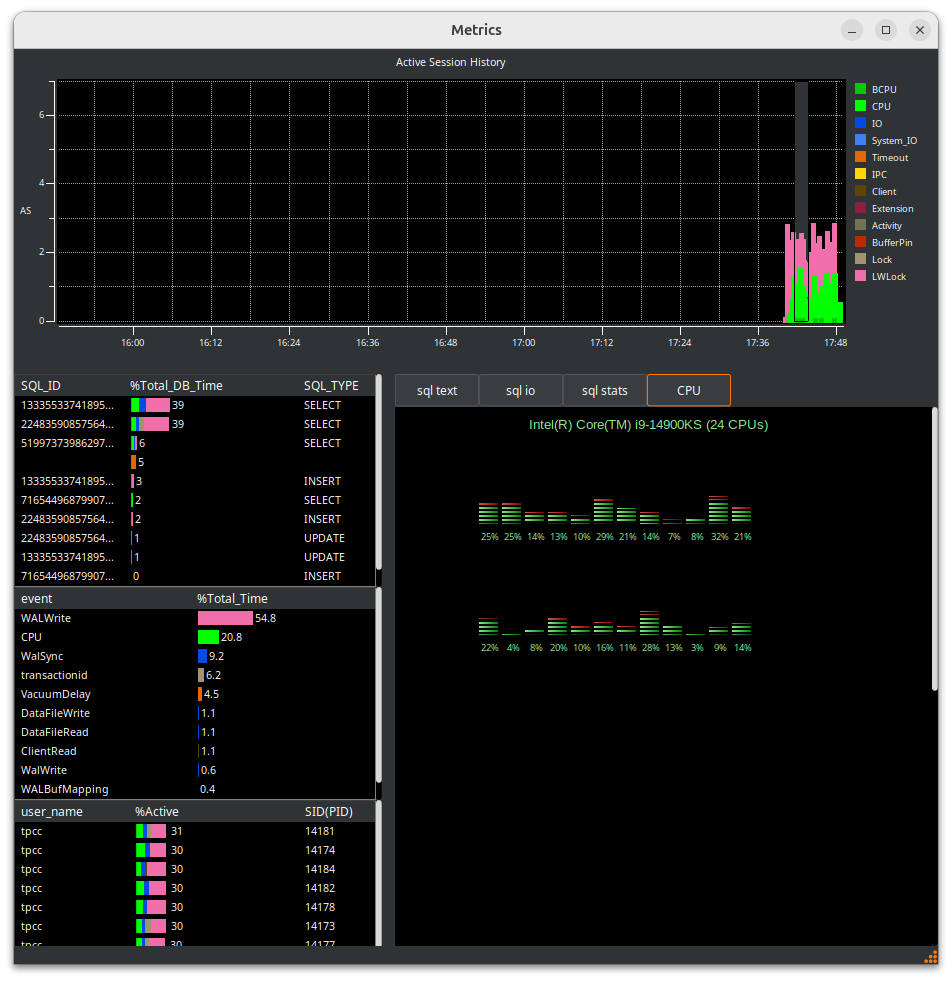
The important concept of an Active Session History is that you can select a time period in the main graph window by dragging the grey box between a start and end point and HammerDB will show the statistics for that time period. You can drill down on the SQL being run, the event and the user.
When you have started the CPU agent you can also view the CPU metrics in real-time.
Conclusion
HammerDB PostgreSQL metrics allows you to view historical PostgreSQL performance metrics for your HammerDB workloads.