
HammerDB v6.0 Performance Profile Comparison

A HammerDB performance profile shows how a database scales on a system as virtual users increase.

That profile is important because database performance is not a single point. It is a curve. A system may scale cleanly at lower load, flatten at higher load, or reach a point where adding more users no longer increases throughput.

HammerDB has always supported performance profiles. What is new in HammerDB v6.0 is the ability to compare one performance profile against another.
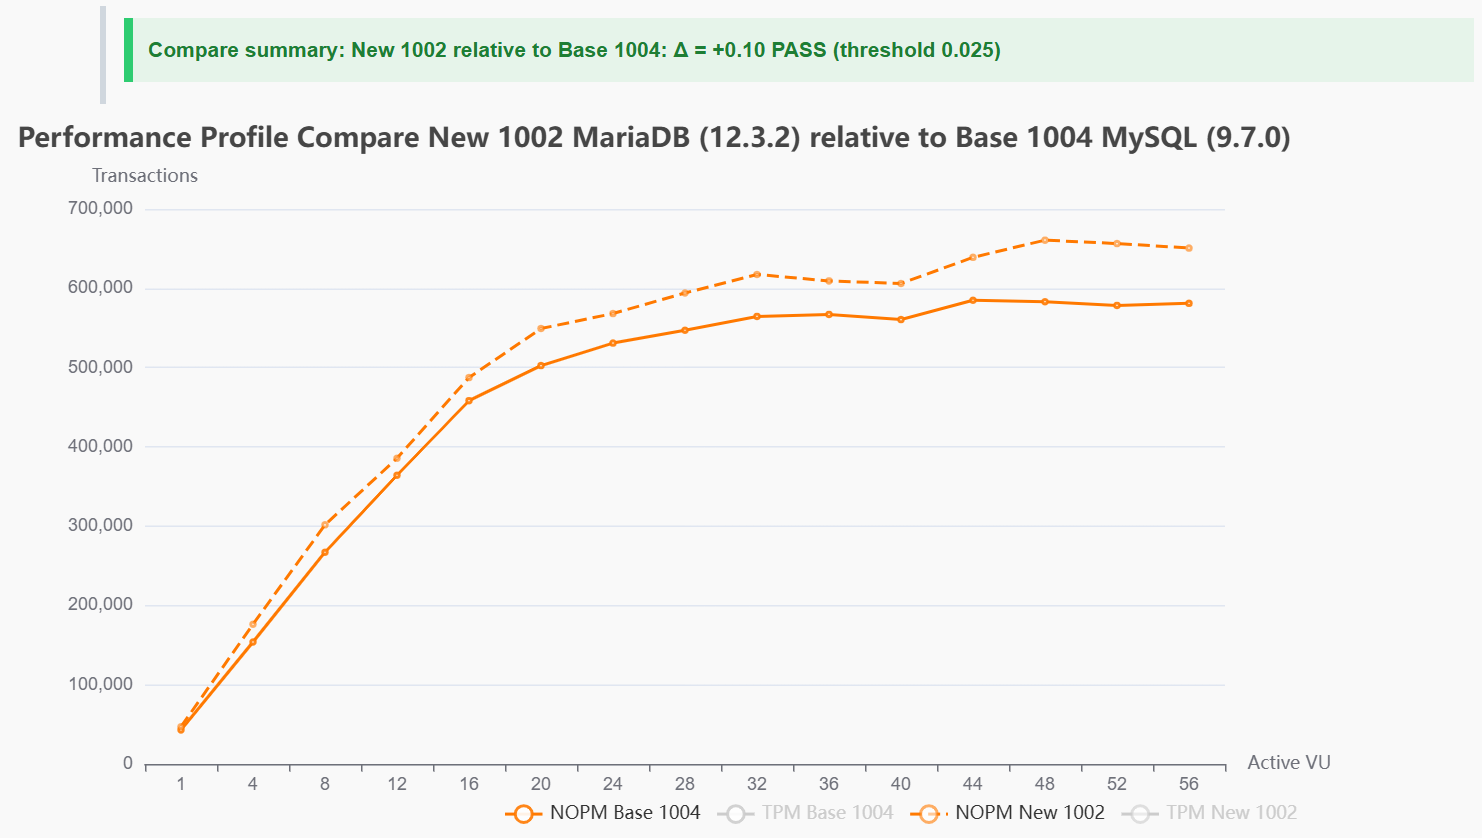
A saved baseline profile can now be compared with a new run, showing the difference across the full workload curve. That makes changes easier to review when testing database versions, configuration changes, platform updates or new builds.

Instead of looking at two separate profile runs side by side, HammerDB v6.0 shows the comparison directly. The result makes it clear where the new run is ahead, where it is behind, and how the difference changes as load increases.

HammerDB v6.0 also adds a comparison summary with a threshold, so a profile comparison can be marked as pass or fail against an expected level of change.

With profile comparison, HammerDB v6.0 shows how the new run behaves against the baseline at each stage of the workload, not just whether the peak number changed.

That gives a practical way to use HammerDB profiles for repeatable regression checks, release validation and performance tracking.

HammerDB v6.0 makes performance profile comparison easier to review, explain and repeat.

HammerDB v6.0 Response Times, Percentiles and Reservoir Sampling

One of the biggest mistakes in database benchmarking is oversizing the workload until response times are measured in hundreds of milliseconds, or even seconds.

A large throughput number is not enough if the workload is already spending too long waiting. The result may look impressive at the top level, but the response times tell a different story.

The databases supported by HammerDB are all mission-critical, enterprise-class databases. At high performance, response times should be in the sub-millisecond or low millisecond range for complex stored procedures combining multiple SQL statements.

HammerDB v6.0 makes the latency profile visible.

The new response time metrics show how long individual transactions take across the run, with full percentile reporting and box plots for the key transaction types.

That means the result can show the median, higher percentiles, spread and outliers, not just an average. Averages hide too much. Percentiles show whether the system is delivering consistent low latency or whether part of the workload is already queueing behind longer waits.

HammerDB v6.0 also adds reservoir sampling for long runs. This keeps response time analysis practical even when a workload generates a very large number of transaction timings.

For long-running tests, that is important. You want the latency distribution, percentiles and outliers without turning the response time data itself into a bottleneck.

As virtual users increase, throughput and response time should be reviewed together. If throughput rises but latency moves from milliseconds to hundreds of milliseconds, the workload has crossed into overload.

HammerDB v6.0 makes that easier to see.

Run the workload. Capture the throughput. Check the percentiles. Review the response time distribution.

HammerDB v6.0 makes database benchmarking show latency as well as throughput.

HammerDB v6.0 System Discovery and Metrics

A faster database result means very little unless you know the system, CPU usage and I/O behind the run.

HammerDB v6.0 adds that detail to the result generated by the HammerDB Agent.

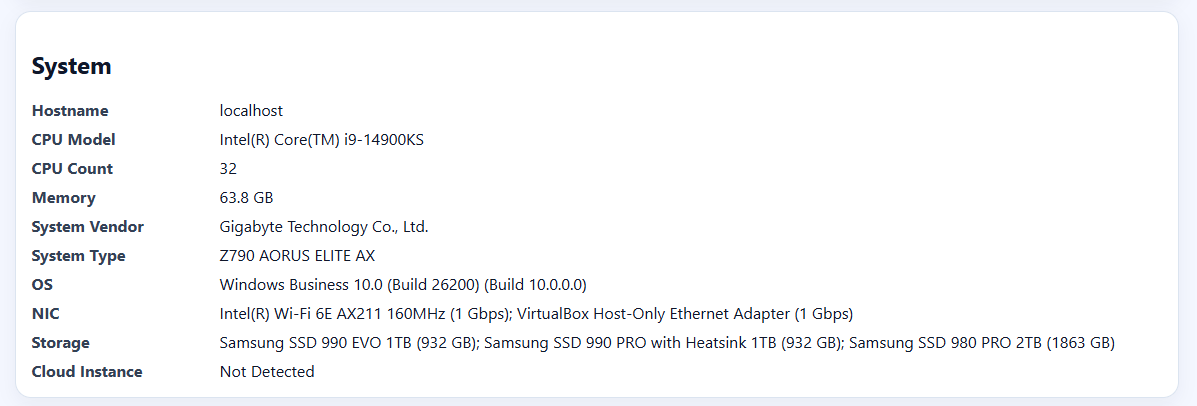
When the Agent runs a workload, it can now record system discovery information as part of the benchmark result. That includes CPU model, CPU count, memory, system vendor, system type, operating system, network interfaces, storage devices and detected cloud instance details.

The result is no longer just a database score. It shows the machine that produced it.

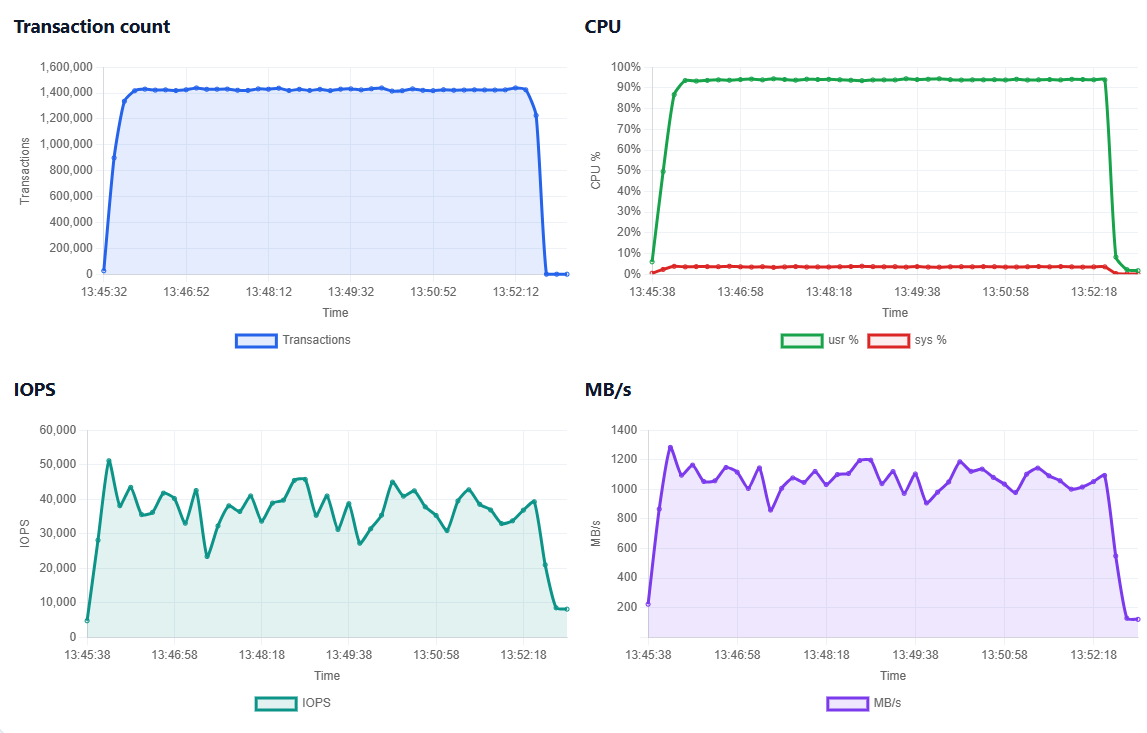
HammerDB v6.0 also adds I/O workload metrics from the run, so it now includes transaction count, CPU utilisation, IOPS and throughput in MB/s.

That gives a clearer view of what happened during the test: how much work was completed, how heavily the CPU was used and how much storage activity the workload generated.

For database version testing, platform comparisons, storage evaluation and cloud instance sizing, this gives each result the context needed to compare runs properly.

Two database results can look similar at the headline level but behave very differently underneath. One may be CPU-bound. Another may be pushing storage harder. Another may be running on a completely different class of system.

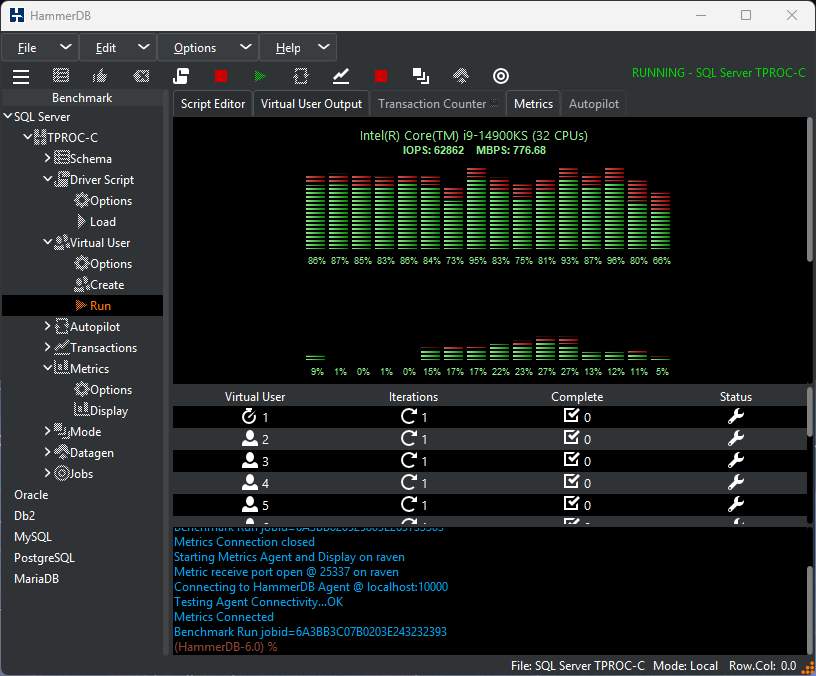
With HammerDB v6.0, the Agent captures more of that evidence in the result itself and experts can continue to drill down into per-core utilisation during the run.

HammerDB v6.0 makes the run explain the result, not just report the score.

HammerDB v6.0 Automation for MariaDB, MySQL and PostgreSQL

HammerDB v6.0 now fully automates database performance testing for MariaDB, MySQL and PostgreSQL.

Clone the database. Build it. Install it. Start it. Create the schema. Load the data. Run the workload. Capture the result.

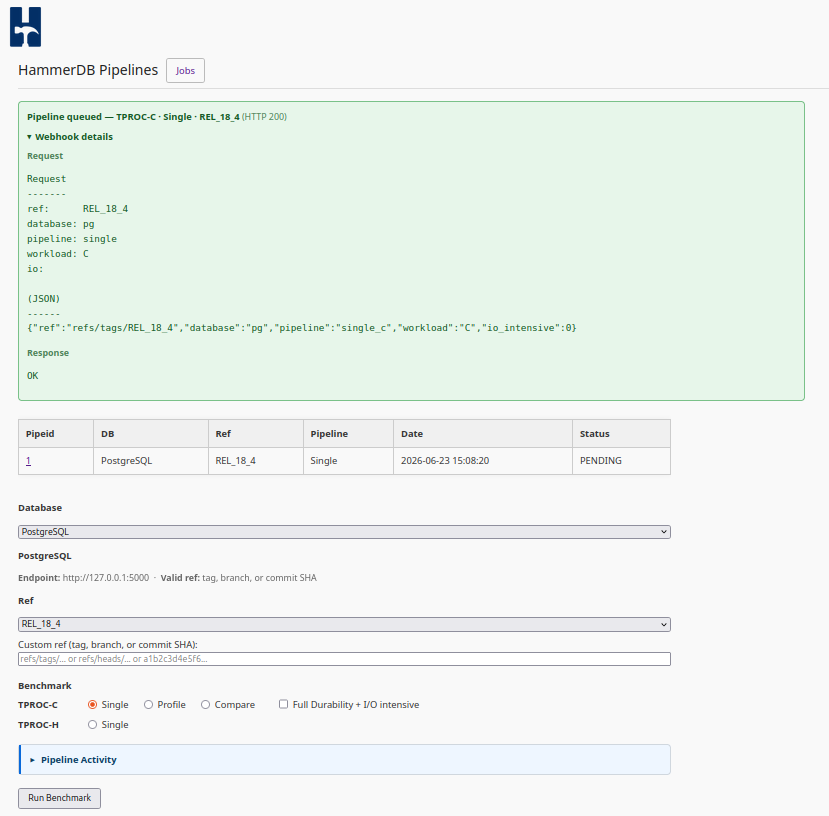
HammerDB v6.0 does the whole pipeline without user intervention. Triggered by web service, manual command or GitHub webhook.

For anyone working with MariaDB, MySQL or PostgreSQL, this removes the need to build a private test harness before performance testing can begin. Any database branch, tag or commit, platform build or configuration change can be taken from source code to a running HammerDB workload and result artifact.

Track database development with repeatable performance evidence from every build, branch and release.

No performance engineer?, no problem. Start the pipeline. Let it run. Review the evidence.

If you use MariaDB, MySQL or PostgreSQL, this is for you. Developers can test new branches. DBAs can validate changes. Platform teams can compare builds and systems. Open-source communities can share performance evidence without relying on one-off scripts or private lab processes.

HammerDB already supports Oracle, SQL Server, Db2, PostgreSQL, MySQL and MariaDB. With v6.0 automation, the open-source engines now get a full pipeline for turning source code into trusted database performance results and informed decisions.

Read the HammerDB v6.0 automation documentation here:
https://www.hammerdb.com/docs/ch01s13.html

This is another step in the HammerDB mission: making database performance open source.

HammerDB v6.0 Active Session History Adds MariaDB and MySQL

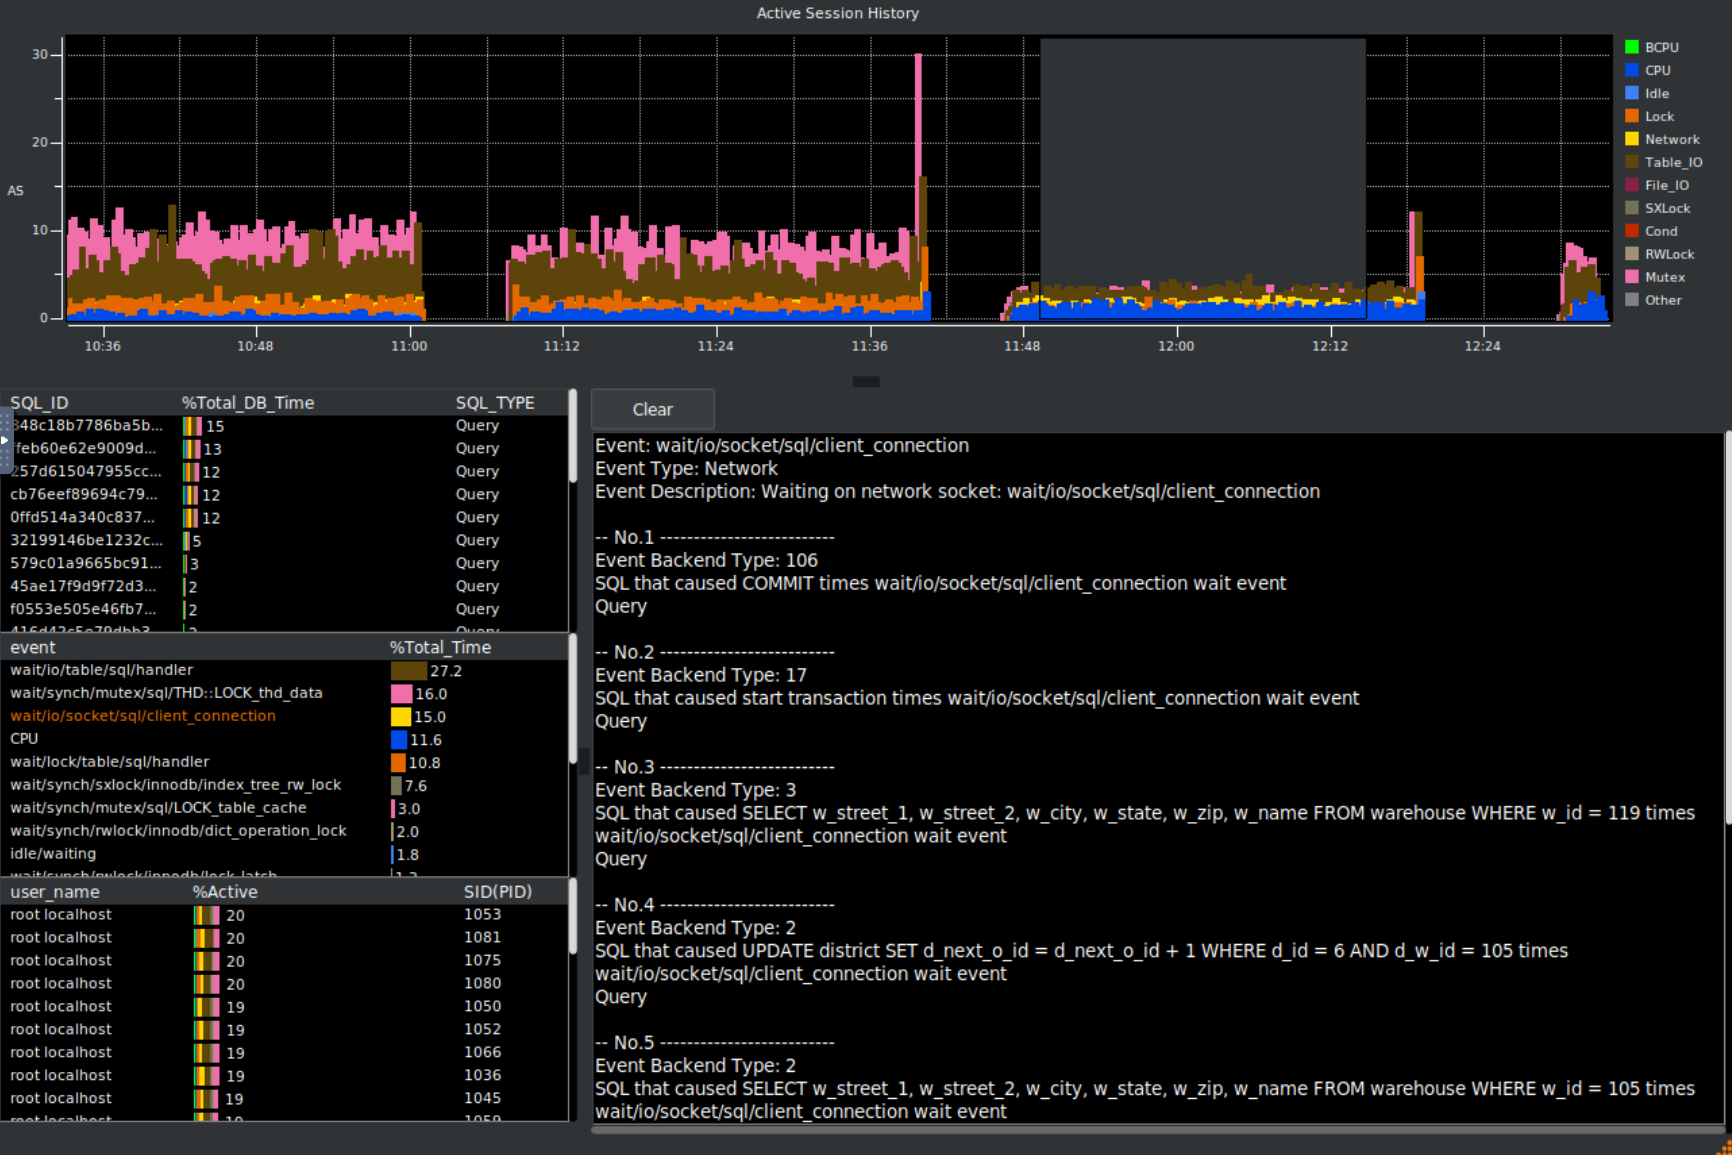
HammerDB already provides Active Session History style analysis for Oracle and PostgreSQL. With HammerDB v6.0, that capability is now available for MariaDB and MySQL as well.

This means a benchmark run can show more than the final throughput number. HammerDB can display active database sessions over time for MariaDB and MySQL, broken down by wait class, event, SQL, session and user.

During a workload, the ASH view helps show where database time is being spent: CPU, locks, table I/O, file I/O, network waits, mutexes, row locks and storage engine activity.

The example shown here captures a MariaDB/MySQL workload while HammerDB is driving load, with drill-down into the waits and SQL contributing most to database time.

For MariaDB and MySQL users, this brings the same workload visibility already available in HammerDB for Oracle and PostgreSQL into the open-source database testing workflow.

HammerDB v6.0 continues the focus on repeatable benchmark results backed by the evidence behind the run: workload, metrics, response times and now deeper active session analysis across more database engines.