

HammerDB already provides Active Session History style analysis for Oracle and PostgreSQL. With HammerDB v6.0, that capability is now available for MariaDB and MySQL as well.
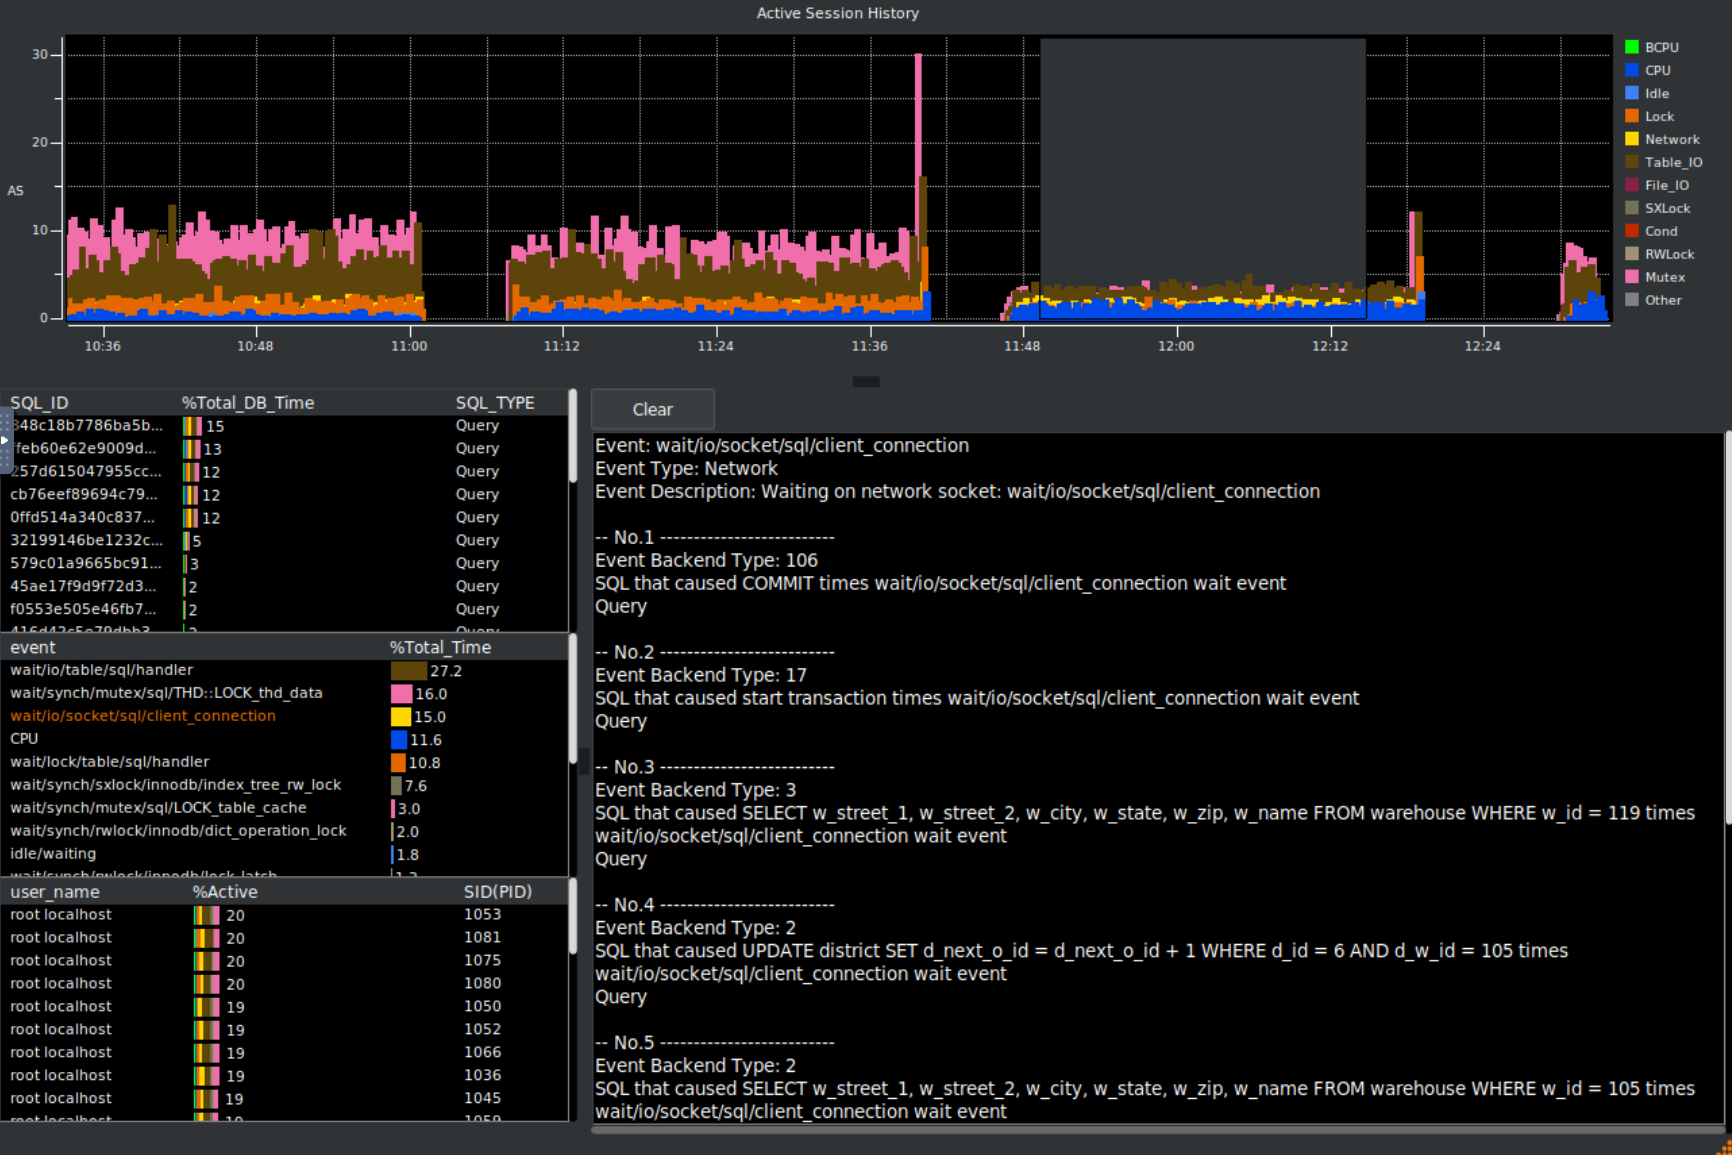
This means a benchmark run can show more than the final throughput number. HammerDB can display active database sessions over time for MariaDB and MySQL, broken down by wait class, event, SQL, session and user.
During a workload, the ASH view helps show where database time is being spent: CPU, locks, table I/O, file I/O, network waits, mutexes, row locks and storage engine activity.
The example shown here captures a MariaDB/MySQL workload while HammerDB is driving load, with drill-down into the waits and SQL contributing most to database time.
For MariaDB and MySQL users, this brings the same workload visibility already available in HammerDB for Oracle and PostgreSQL into the open-source database testing workflow.
HammerDB v6.0 continues the focus on repeatable benchmark results backed by the evidence behind the run: workload, metrics, response times and now deeper active session analysis across more database engines.