

A faster database result means very little unless you know the system, CPU usage and I/O behind the run.
HammerDB v6.0 adds that detail to the result generated by the HammerDB Agent.
When the Agent runs a workload, it can now record system discovery information as part of the benchmark result. That includes CPU model, CPU count, memory, system vendor, system type, operating system, network interfaces, storage devices and detected cloud instance details.
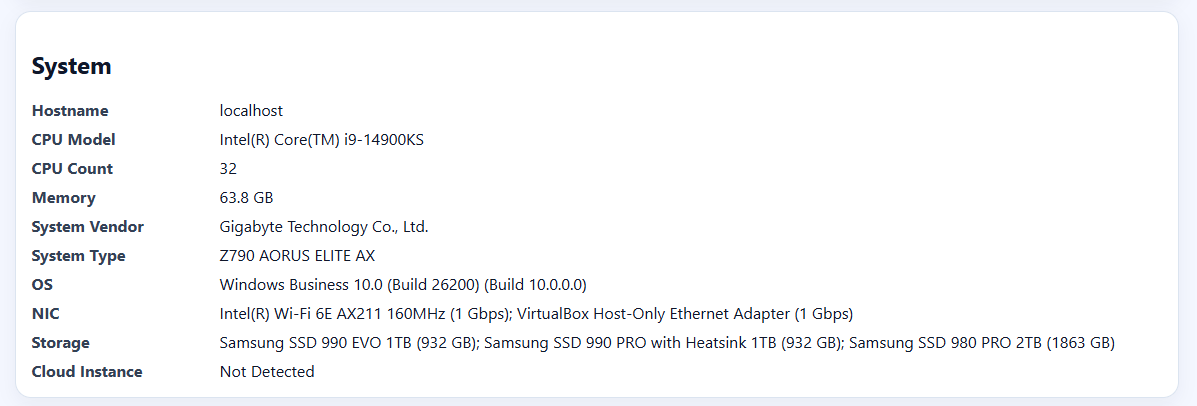
The result is no longer just a database score. It shows the machine that produced it.
HammerDB v6.0 also adds I/O workload metrics from the run, so it now includes transaction count, CPU utilisation, IOPS and throughput in MB/s.
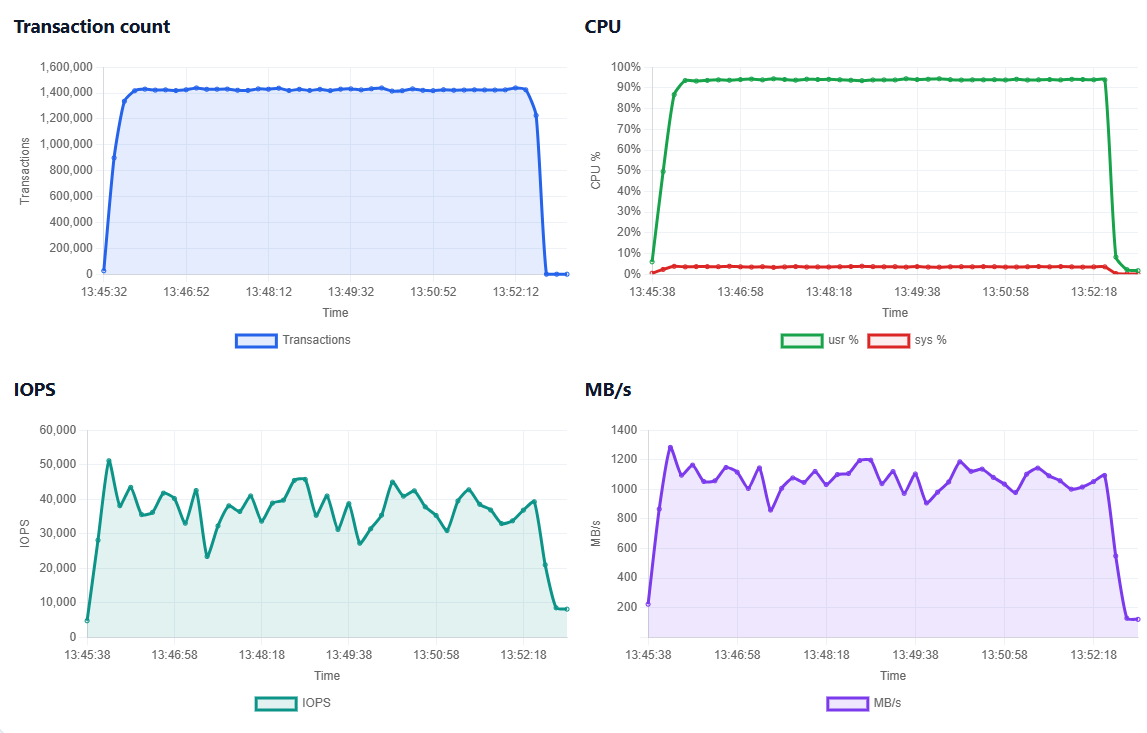
That gives a clearer view of what happened during the test: how much work was completed, how heavily the CPU was used and how much storage activity the workload generated.
For database version testing, platform comparisons, storage evaluation and cloud instance sizing, this gives each result the context needed to compare runs properly.
Two database results can look similar at the headline level but behave very differently underneath. One may be CPU-bound. Another may be pushing storage harder. Another may be running on a completely different class of system.
With HammerDB v6.0, the Agent captures more of that evidence in the result itself and experts can continue to drill down into per-core utilisation during the run.
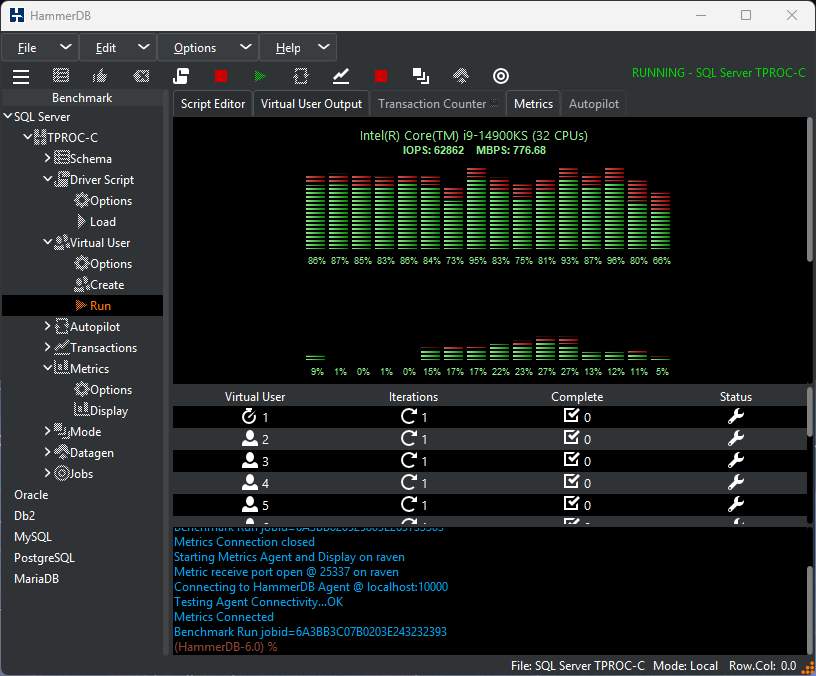
HammerDB v6.0 makes the run explain the result, not just report the score.