HammerDB uses stored procedures to achieve maximum throughput when benchmarking your database. HammerDB has always used stored procedures as a design decision because the original benchmark was implemented as close as possible to the example workload in the TPC-C specification that uses stored procedures. Additionally, reviewing official TPC-C full disclosure reports highlighted that all vendors also use stored procedures.
However, there can be a lack of understanding of the benefits that stored procedures bring or if you have a benchmarking tool or database that doesn’t support stored procedures, then you have nothing to compare against.
This blog post introduces the new “No stored procedures” option for MariaDB and MySQL introduced with HammerDB v4.9 and explains how to measure the difference between running with and without stored procedures.
What is a stored procedure?
A stored procedure as it sounds is a procedure stored inside your database that you call with parameters. The business logic is implemented inside the routine and it returns a result. As an example from the TPC-C specification, this is the Stock Level procedure.
int slev()
{
EXEC SQL WHEN EVER NOT FOUND GOTO sqlerr;
EXEC SQL WHEN EVER SQLERROR GOTO sqlerr;
EXEC SQL SELECT d _next_o_id IN TO :o_id FROM district WHERE d_w_id =:w _id AND d_id = :d_id;
EXEC SQL SELECT COUNT(DISTINCT(s_i_id )) INTO :stock_count
FROM order_line, stock
WHERE ol_w _id =:w _id AND
ol_d_id =:d_id AND ol_o_id <:o_id AND
ol_o_id >=:o_id -20 AND
s_w_id =:w_id AND
s_i_id =ol_i_id AND s_quantity < :threshold;
EXEC SQL COMMIT WORK;
return(0);
sqlerr:
error();
}
and in MySQL, MariaDB we can implement this procedure as follows. So we call the stored procedure and pass a warehouse id, district id and threshold and receive a stock_count as a result.
Also, note in passing that we include a COMMIT statement in this procedure because one is included in the example code in TPC-C specification.
CREATE PROCEDURE `SLEV` (
st_w_id INTEGER,
st_d_id INTEGER,
threshold INTEGER,
OUT stock_count INTEGER
)
BEGIN
DECLARE st_o_id INTEGER;
DECLARE `Constraint Violation` CONDITION FOR SQLSTATE '23000';
DECLARE EXIT HANDLER FOR `Constraint Violation` ROLLBACK;
DECLARE EXIT HANDLER FOR NOT FOUND ROLLBACK;
START TRANSACTION;
SELECT d_next_o_id INTO st_o_id
FROM district
WHERE d_w_id=st_w_id AND d_id=st_d_id;
SELECT COUNT(DISTINCT (s_i_id)) INTO stock_count
FROM order_line, stock
WHERE ol_w_id = st_w_id AND
ol_d_id = st_d_id AND (ol_o_id < st_o_id) AND
ol_o_id >= (st_o_id - 20) AND s_w_id = st_w_id AND
s_i_id = ol_i_id AND s_quantity < threshold;
COMMIT;
END
Next we can run the same SQL directly without a stored procedure.
proc slev { maria_handler w_id stock_level_d_id prepare RAISEERROR } {

global mariastatus
set threshold [ RandomNumber 10 20 ]
mariaexec $maria_handler "start transaction"
set d_next_o_id [ list [ maria::sel $maria_handler "SELECT d_next_o_id FROM district WHERE d_w_id=$w_id AND d_id=$stock_level_d_id" -list ]]
set stock_count [ list [ maria::sel $maria_handler "SELECT COUNT(DISTINCT (s_i_id)) FROM order_line, stock WHERE ol_w_id = $w_id AND ol_d_id = $stock_level_d_id AND (ol_o_id < $d_next_o_id) AND ol_o_id >= ($d_next_o_id - 20) AND s_w_id = $w_id AND s_i_id = ol_i_id AND s_quantity < $threshold" -list ]]
maria::commit $maria_handler
}
In this example, when we run the client SQL version d_next_o_id is 3001
stock count is 6
SELECT d_next_o_id FROM district WHERE d_w_id=1 AND d_id=10
SELECT COUNT(DISTINCT (s_i_id)) FROM order_line, stock WHERE ol_w_id = 1
AND ol_d_id = 10 AND (ol_o_id < 3001) AND ol_o_id >= (3001 - 20)
AND s_w_id = 1 AND s_i_id = ol_i_id AND s_quantity < 11
and when we call the stored procedure, we get the same result for the stock count.
call slev(1,10,11,@stock_count);
Query OK, 2 rows
select @stock_count;
> +--------------+
> | @stock_count |
> +--------------+
> | 6            |
> +--------------+
> 1 row in set (0.000 sec)
Although we get the same result and run exactly the same SQL, there are notable differences in how we get there. Firstly, the stored procedure is compiled on the database but also the slev procedure on the client is compiled into bytecode. Also using client SQL we do more parsing of SQL statements and are using literal values, although we could also use prepared statements in this scenario. However, the major difference is that whereas in the client SQL approach we make 4 round trips between the client and database to receive our stock count in the stored procedure we are making 2, one to call the stored procedure with the input parameters and one to select the variable where the output is stored. With a simple example such as this, it would not necessarily be expected for the additional network traffic to be significant between the 2 approaches. However, with more complex application logic this network round trip soon becomes a key focus area for improving performance.
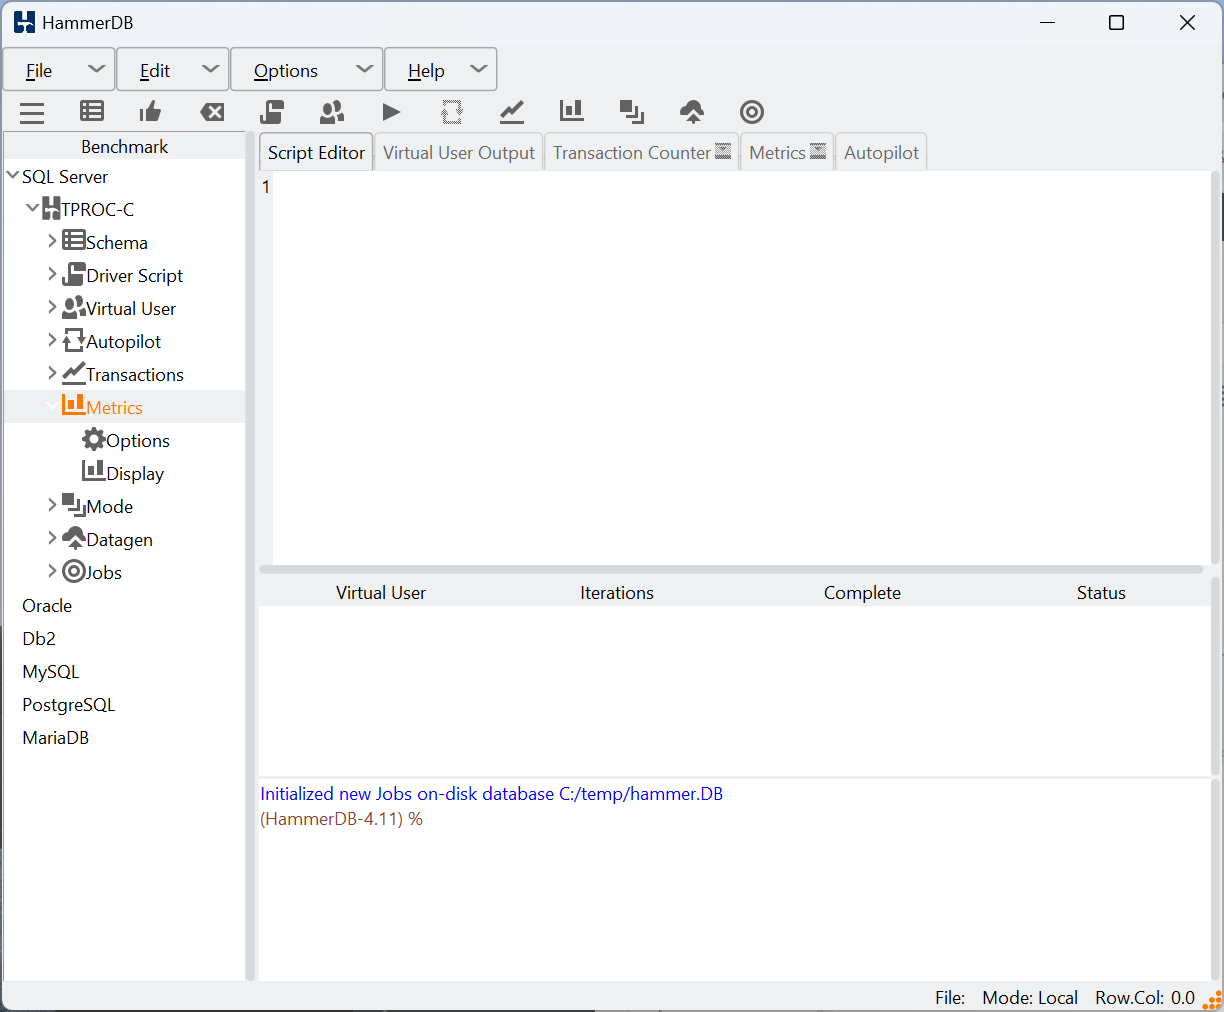
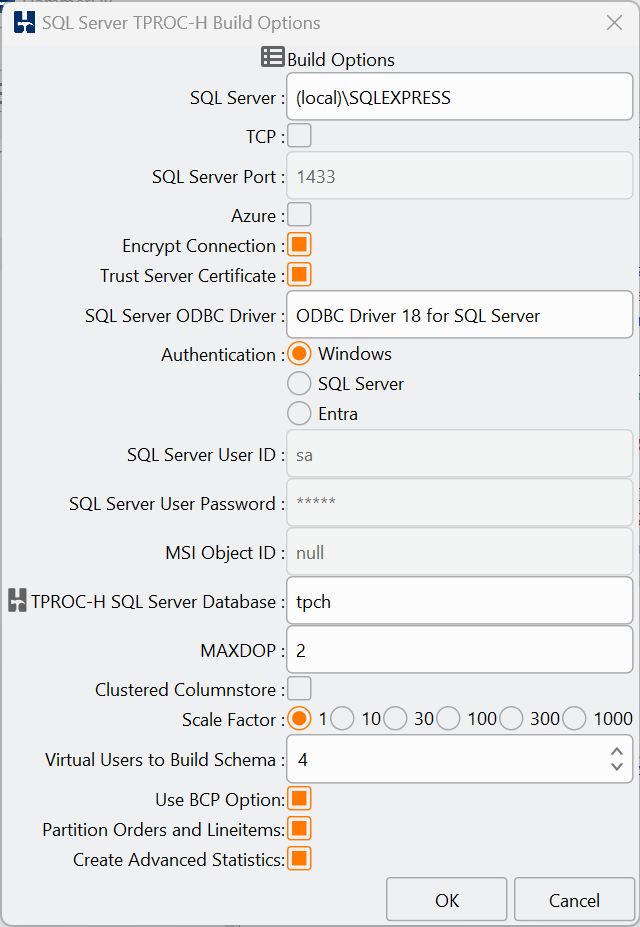
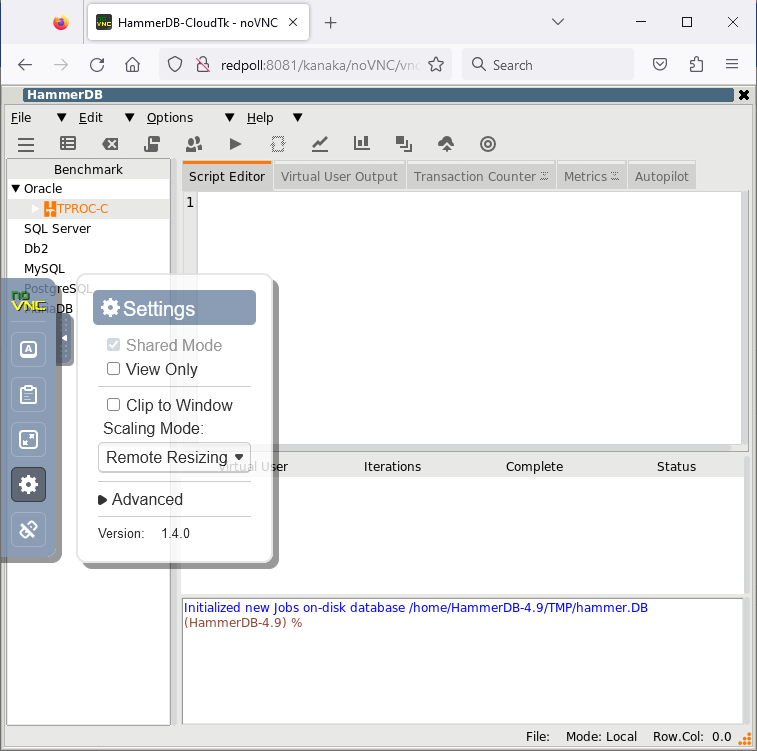
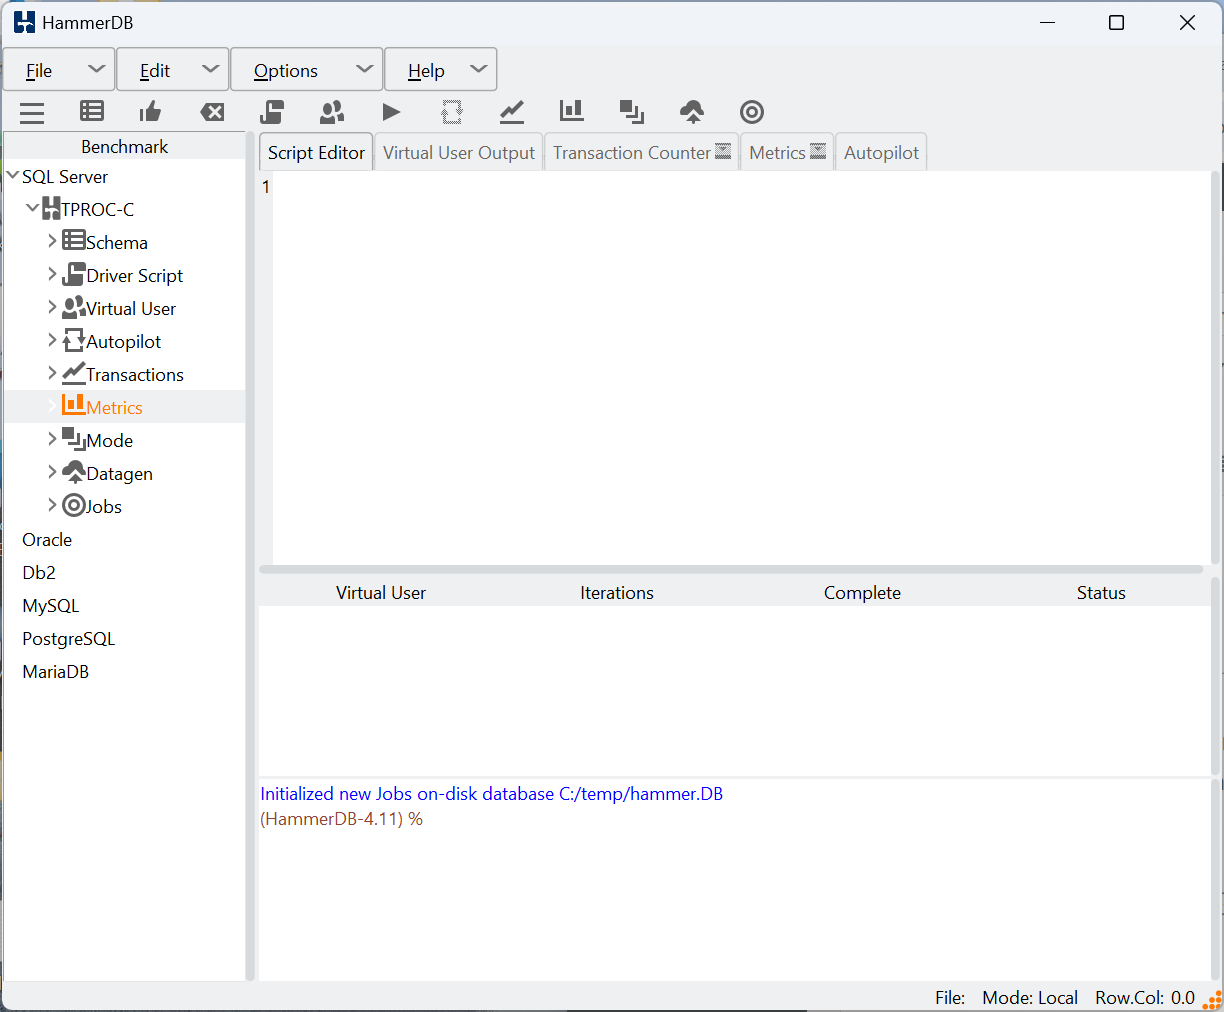
Setting the HammerDB No Stored Procedures Option
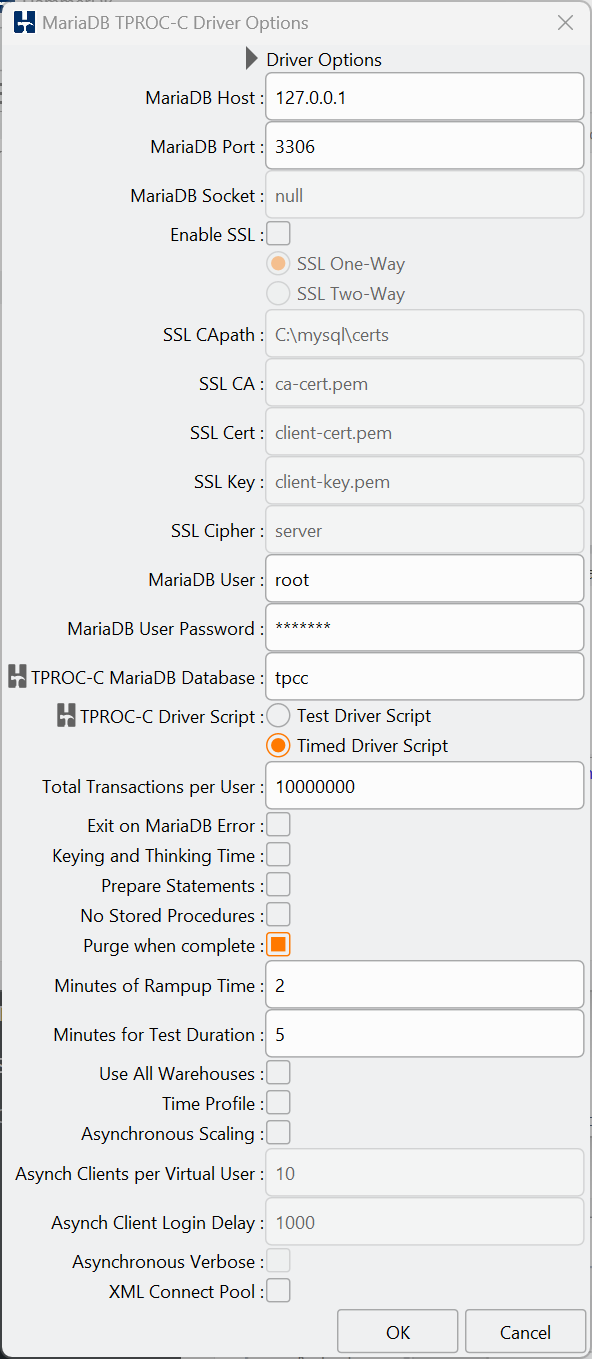
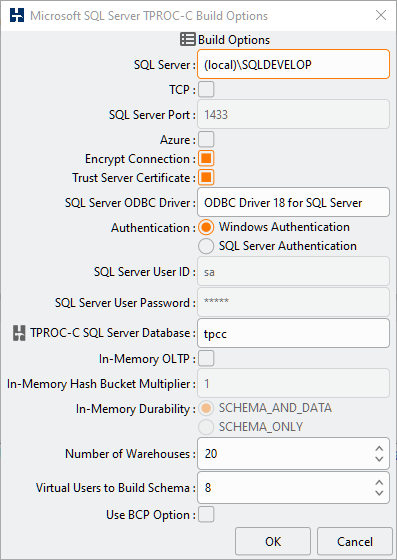
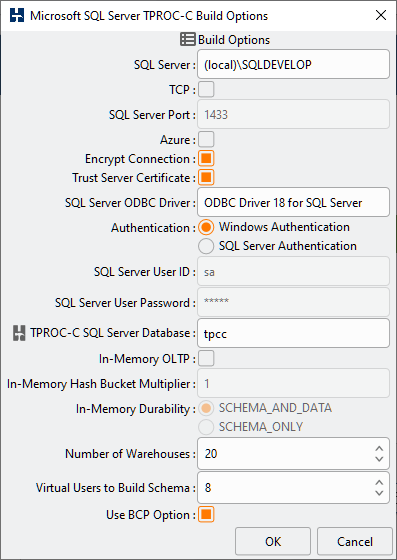
The no stored procedures option is a driver script option, and you should create the schema as normal with stored procedures. Then when selecting the driver options to use client SQL only, you select the No Stored Procedures checkbox.
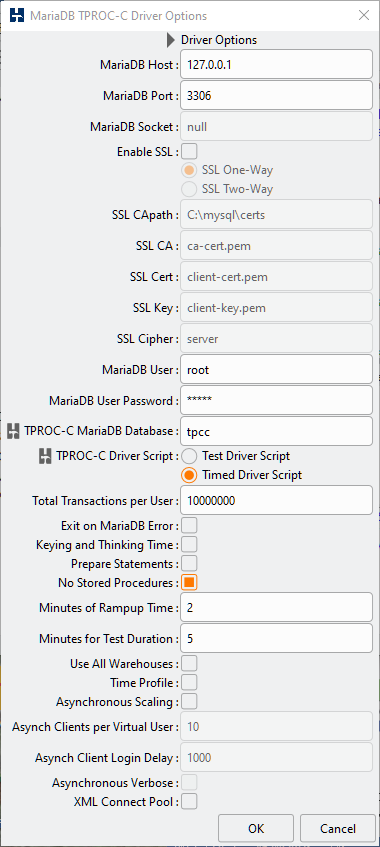
In the CLI you set maria_no_stored_procs or mysql_no_stored_procs to use a client SQL driver script.
Stored Procedures and Client SQL comparison
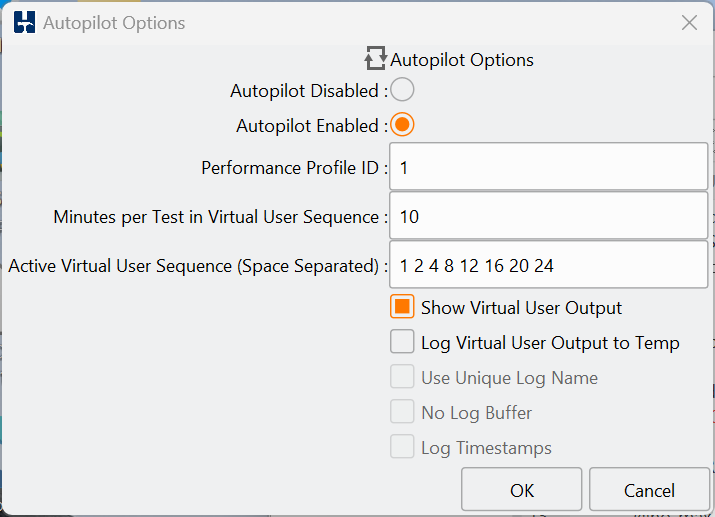
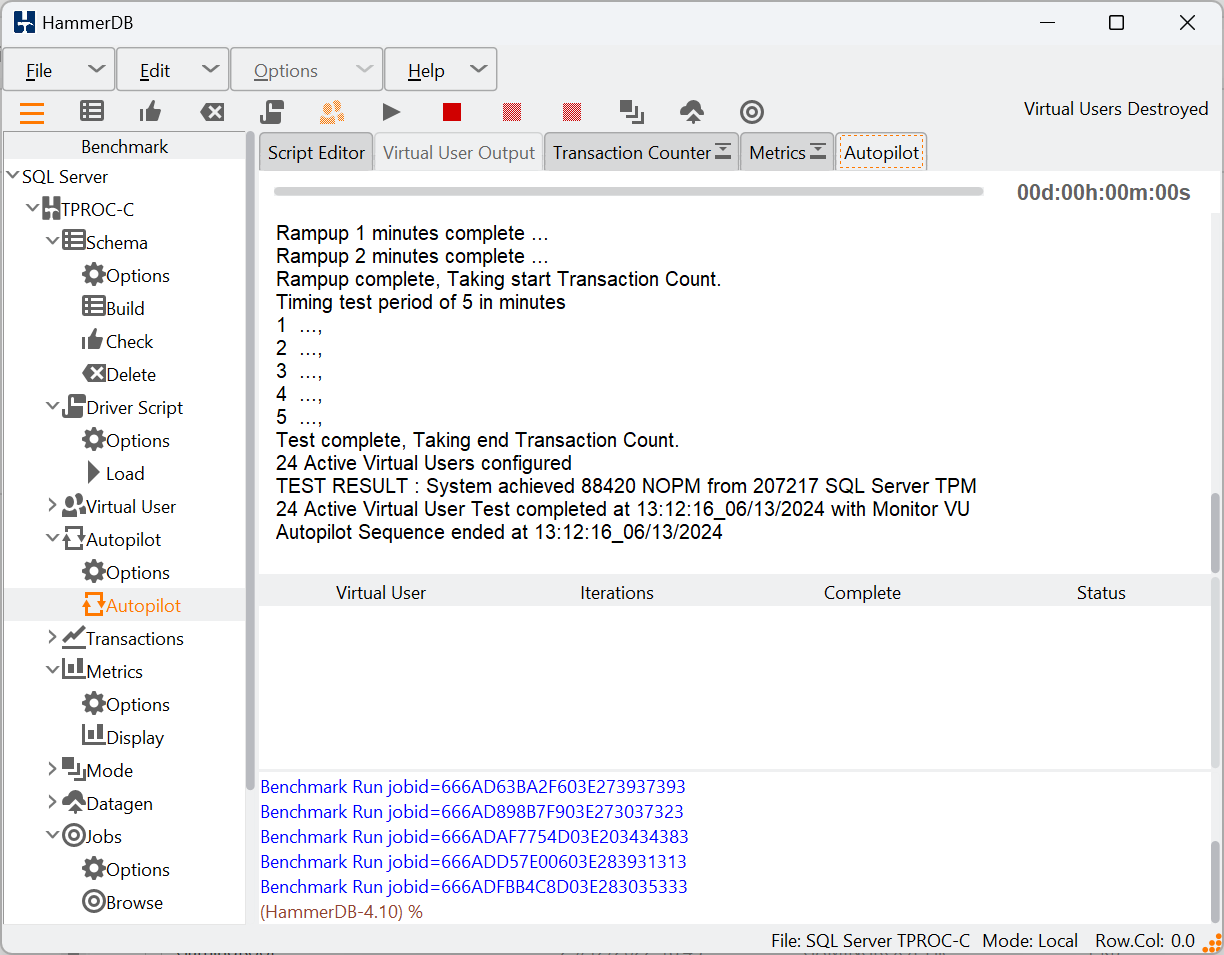
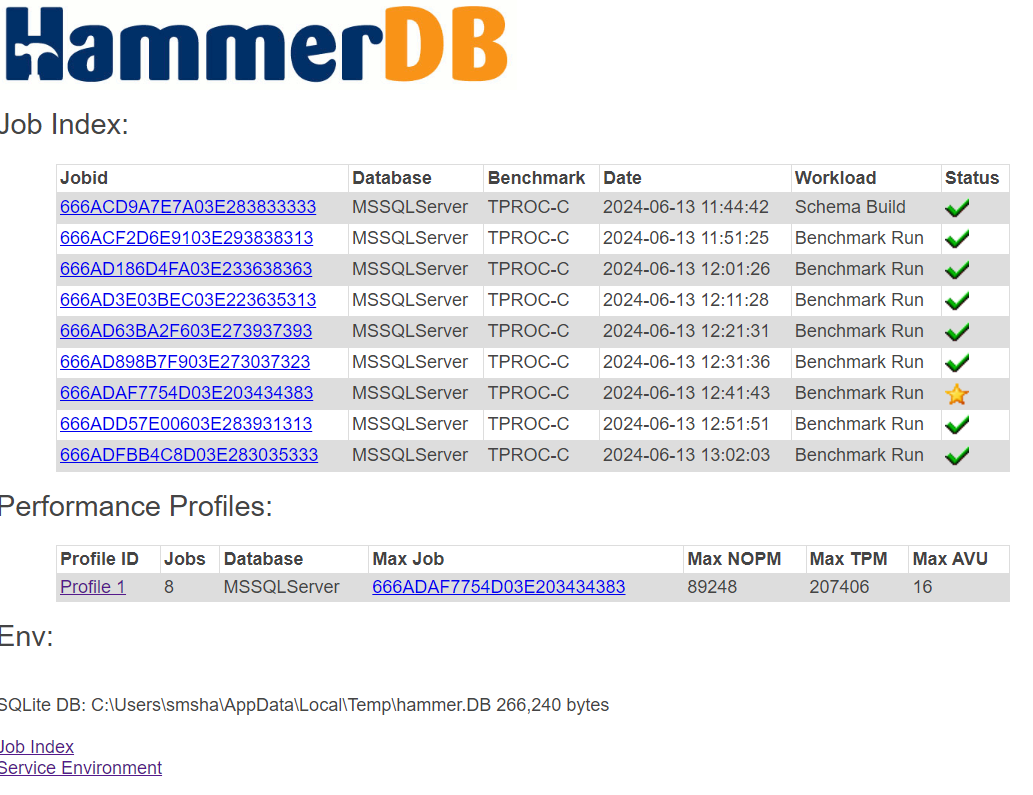
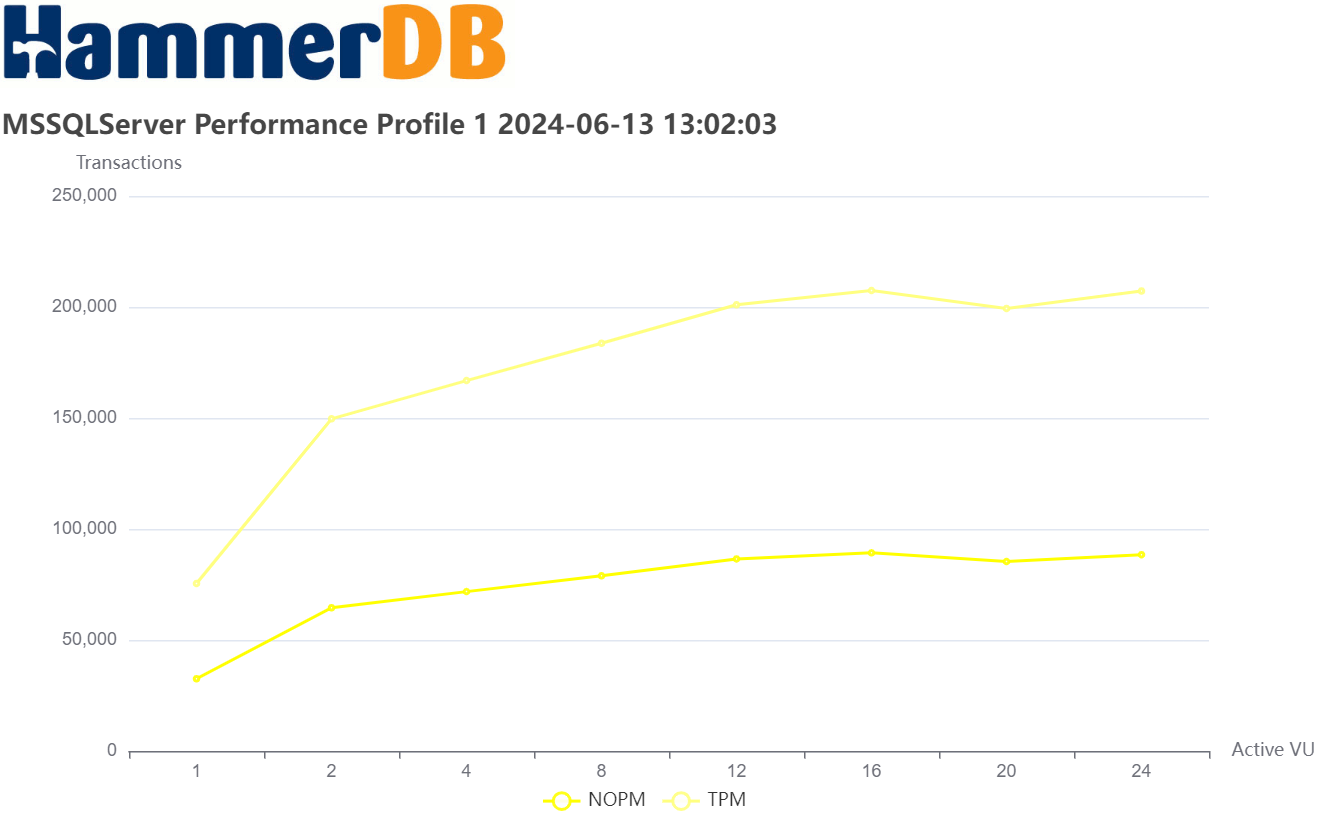
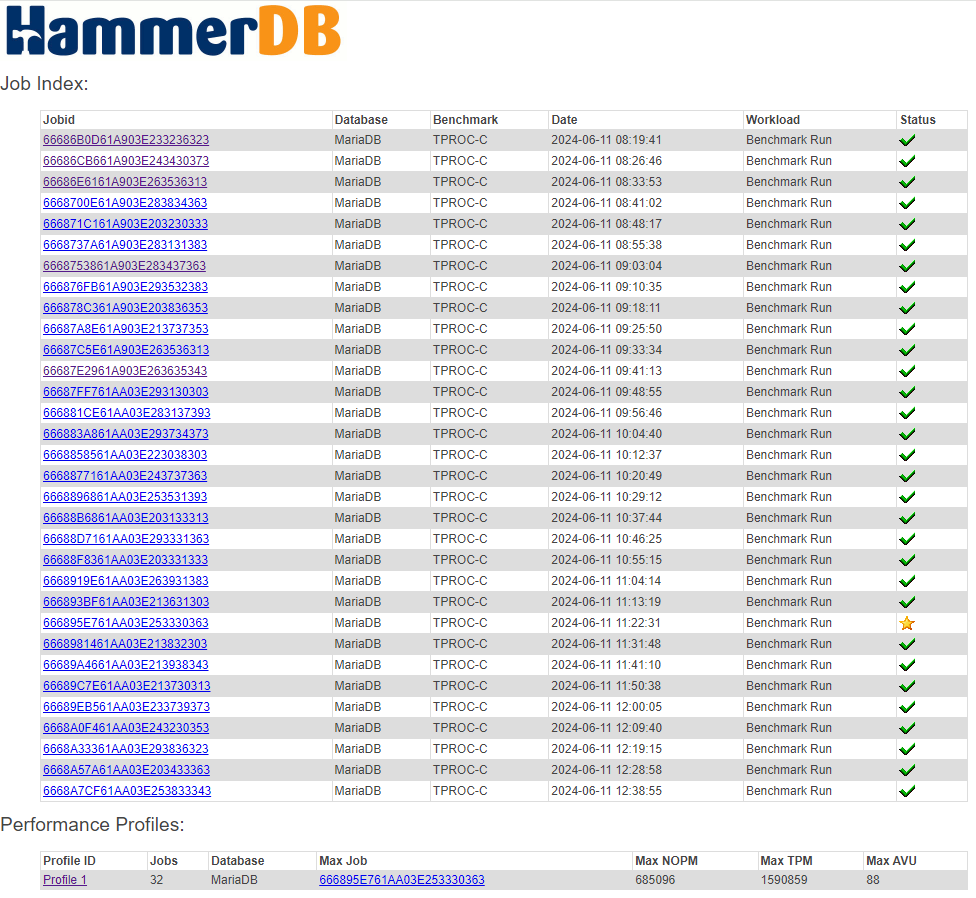
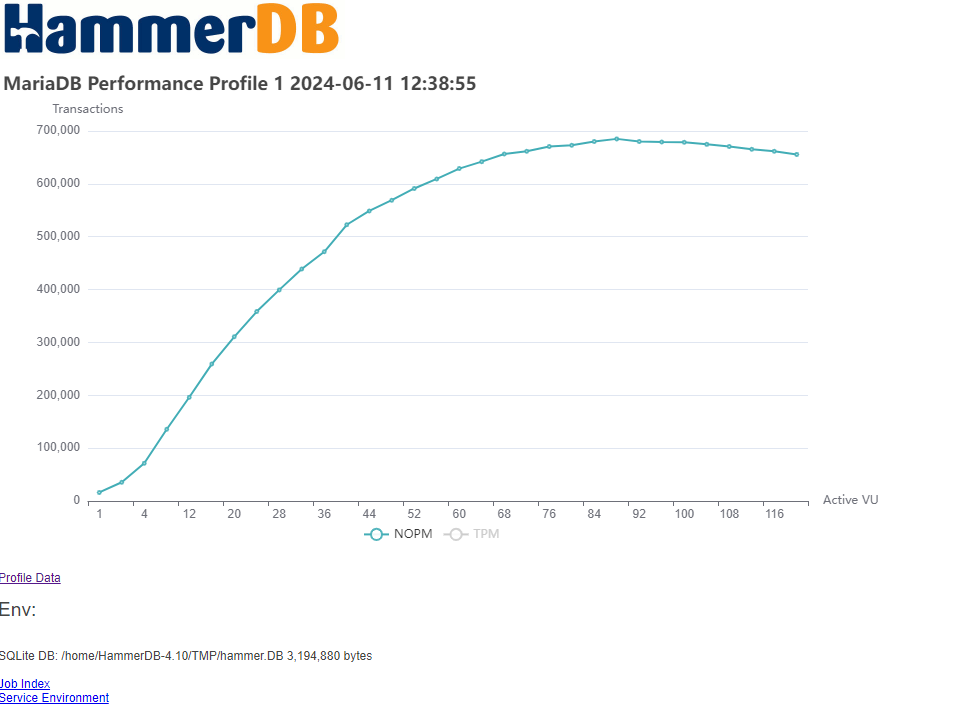
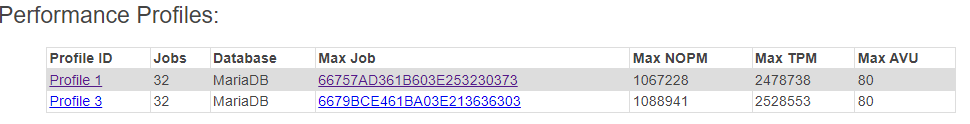
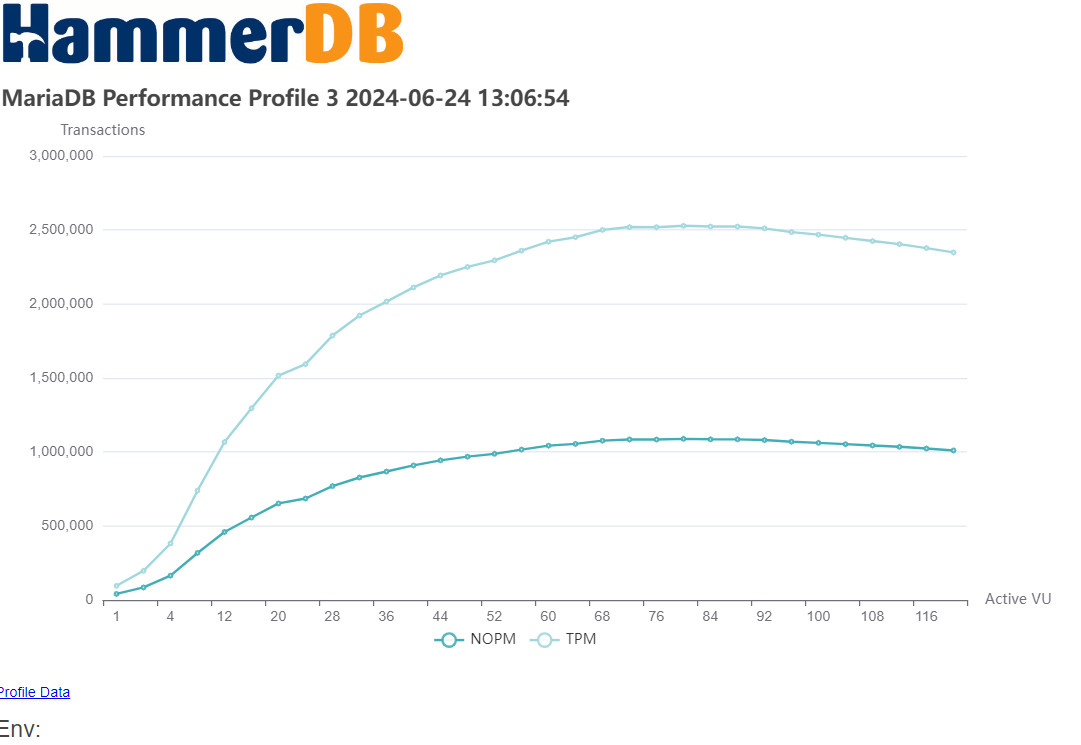
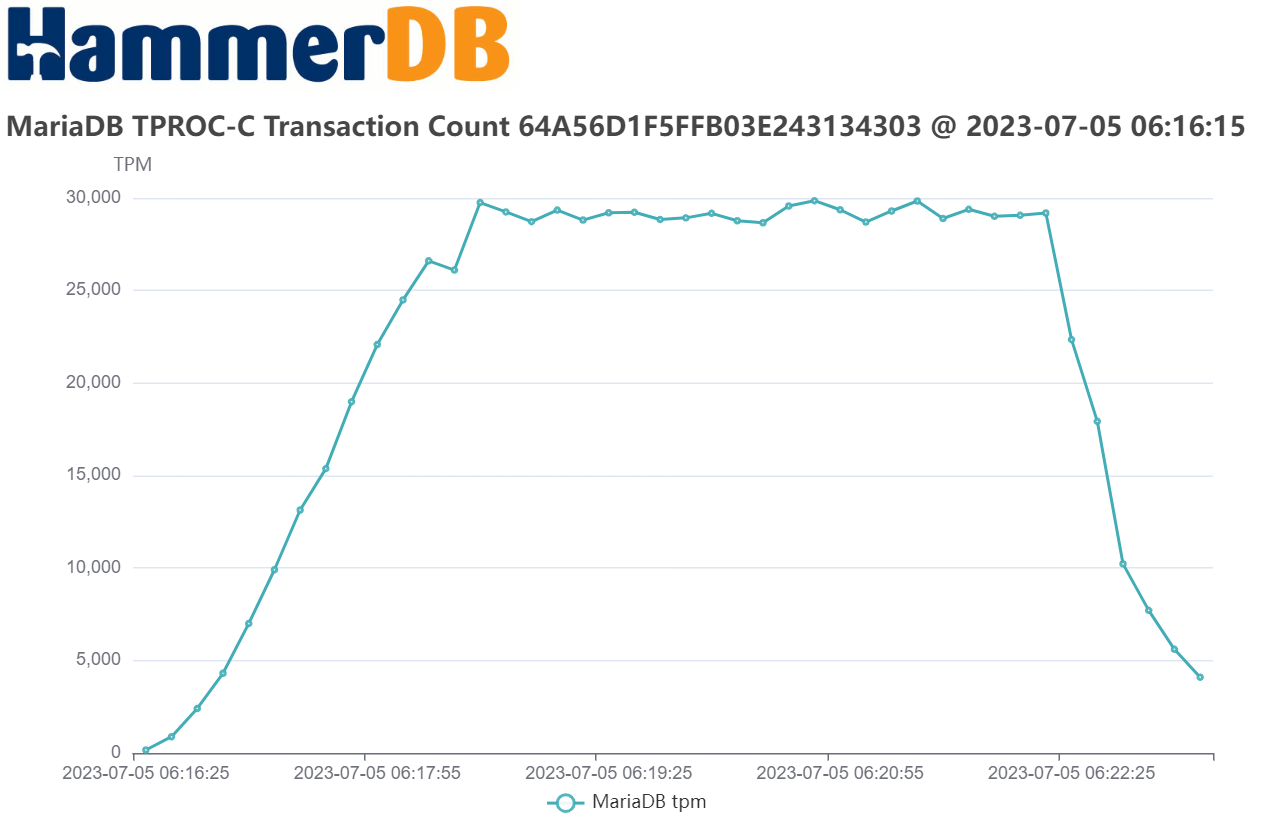
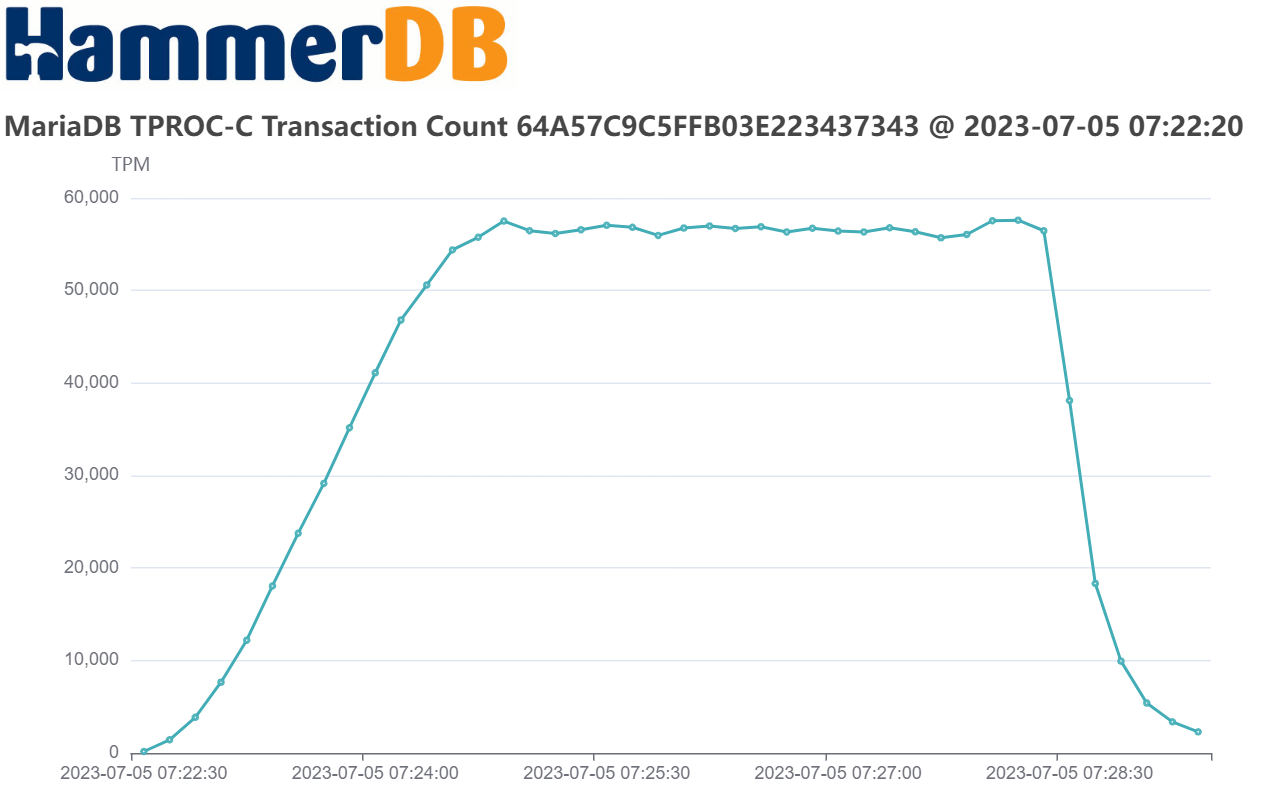
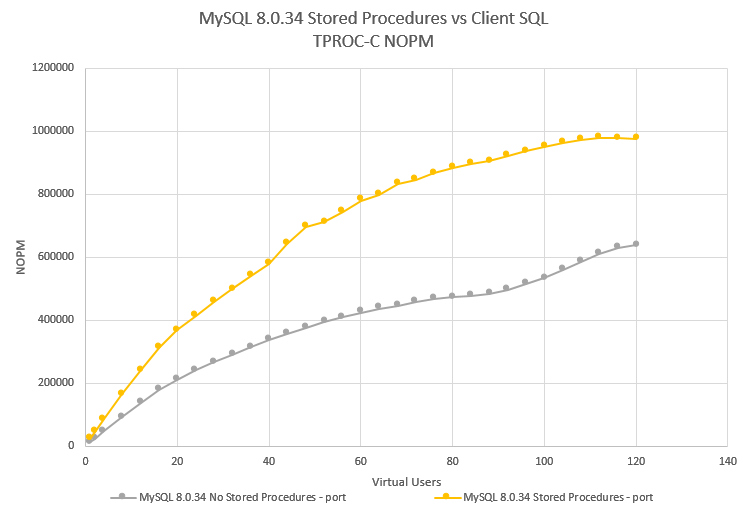
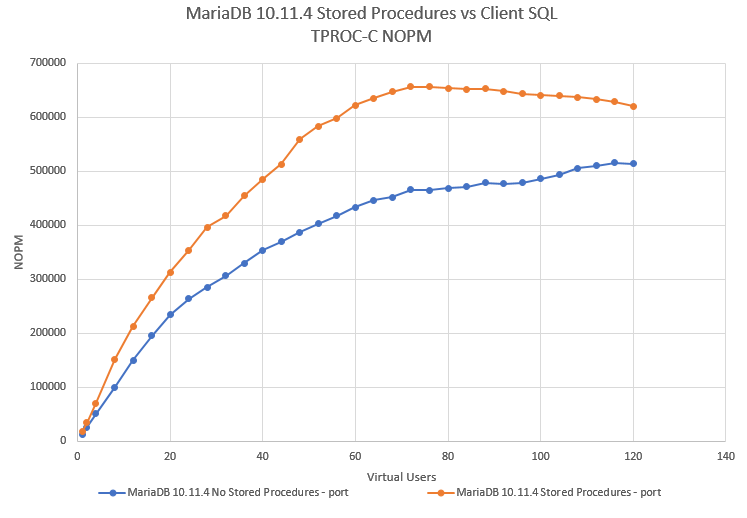
To test the stored procedures and client implementations, we ran both workloads against a system equipped with Intel Xeon 8280L. The data shows a scripted automated workload running a number of back to back tests each time with an increasing number of virtual users.
On MySQL, we saw a 1.5X performance advantage in favour of stored procedures and on MariaDB a 1.3X performance advantage.
Note that for all tests, we used the local loopback address and port to provide the lowest possible network latency between client and server and also so we don’t have any concerns about bandwidth limitations.
# iperf -c 127.0.0.1

------------------------------------------------------------

Client connecting to 127.0.0.1, TCP port 5001
TCP window size: 2.50 MByte (default)
------------------------------------------------------------
[  3] local 127.0.0.1 port 19230 connected with 127.0.0.1 port 5001
[  4] local 127.0.0.1 port 5001 connected with 127.0.0.1 port 19230
[ ID] Interval       Transfer     Bandwidth
[  3]  0.0-10.0 sec  37.3 GBytes  32.1 Gbits/sec
[ ID] Interval       Transfer     Bandwidth
[  4]  0.0-10.0 sec  37.3 GBytes  32.1 Gbits/sec
We also test both local port and socket connections and found that a local port provided the best comparative data for both MySQL and MariaDB.
Database information and performance schemas
The best approach for database performance analysis is to take a top-down approach. Use the performance metrics available in the database first before looking at data further down in the stack.
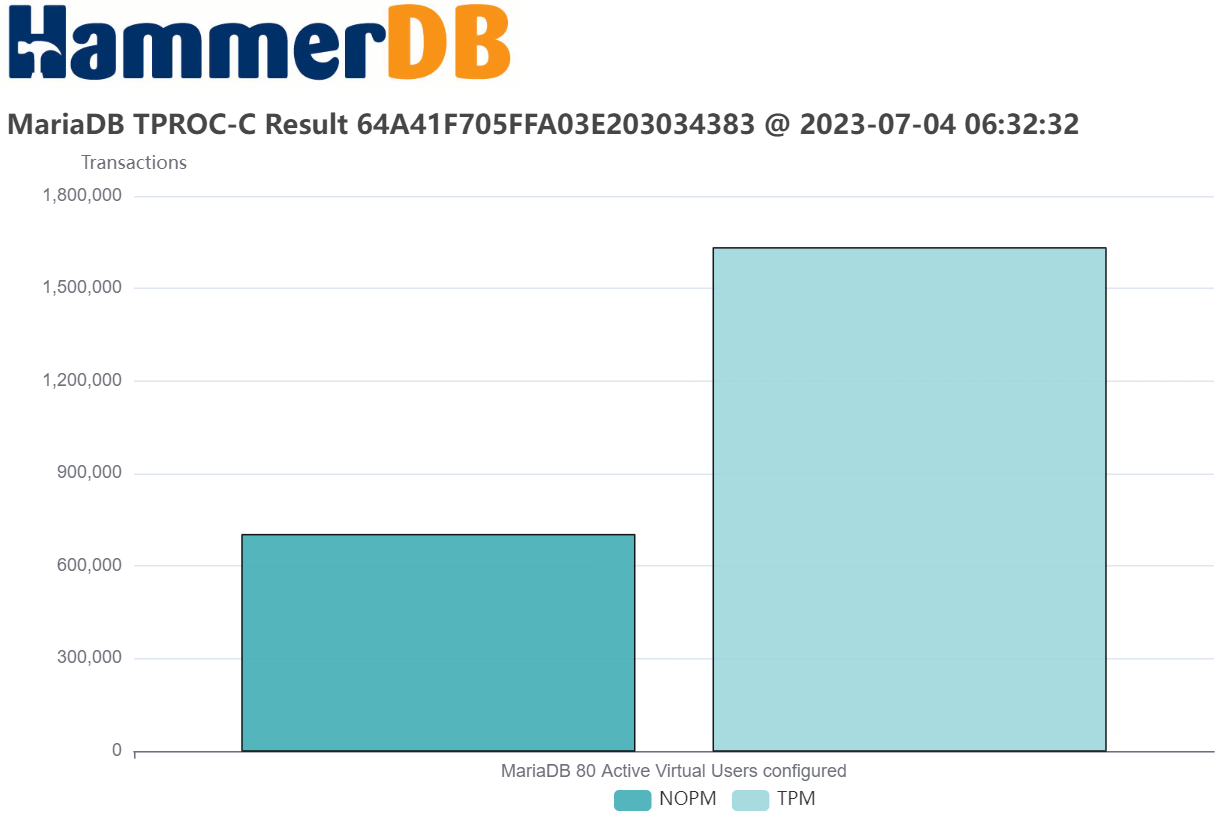
Using MariaDB and analysing performance at a workload of 80 Virtual Users the first place we can look at is the information schema user_statistics to quantify the difference in the database traffic. In this example, we can capture the bytes received and sent for the workload without stored procedures
mysql> select * from information_schema.user_Statistics where user='root'\G;
*************************** 1. row ***************************
          USER: root
          TOTAL_CONNECTIONS: 83
          BYTES_RECEIVED: 22847015761
          BYTES_SENT: 50668052468
...
And also for the workload with stored procedures
mysql> select * from information_schema.user_Statistics where user='root'\G;
*************************** 1. row ***************************
          USER: root
          TOTAL_CONNECTIONS: 83
          BYTES_RECEIVED: 3548506639
          BYTES_SENT: 6335812312
...
With this first step, we have identified a difference in that without stored procedures we sent 8X and received 6.4X the amount of data from the server to the client to achieve the same result. With the workload running for 2 minutes rampup the throughput for the workload without stored procedures is equivalent to BYTES_RECEIVED: 54 MB/s and BYTES_SENT: 120 MB/s. This in itself is not an issue as it means we are well within the systems bandwidth capabilities. It also makes sense that the database sends more data than it receives as it receives SQL queries and returns results, for the client it will be the opposite receving more data than is sent.
Therefore, the most important question is not so much how much data was sent, but how long it took and where wait time was spent. At the highest level we can look at an event called io/socket/sql/client_connection to see how much time measured in pico seconds was spent in network related events, firstly without stored procedures
mysql> select * from events_waits_summary_global_by_event_name where event_name like '%client_connection%';
+--------------------------------------+------------+------------------+----------------+----------------+----------------+
| EVENT_NAME                           | COUNT_STAR | SUM_TIMER_WAIT   | MIN_TIMER_WAIT | AVG_TIMER_WAIT | MAX_TIMER_WAIT |
+--------------------------------------+------------+------------------+----------------+----------------+----------------+
| wait/io/socket/sql/client_connection |  350769863 | 2350211822039704 |              0 |        6699889 |     8921327926 |
+--------------------------------------+------------+------------------+----------------+----------------+----------------+
1 row in set (0.01 sec)
and secondly with stored procedures
mysql> select * from events_waits_summary_global_by_event_name where event_name like '%client_connection%';
+--------------------------------------+------------+-----------------+----------------+----------------+----------------+
| EVENT_NAME                           | COUNT_STAR | SUM_TIMER_WAIT  | MIN_TIMER_WAIT | AVG_TIMER_WAIT | MAX_TIMER_WAIT |
+--------------------------------------+------------+-----------------+----------------+----------------+----------------+
| wait/io/socket/sql/client_connection |   43053845 | 310781514128952 |              0 |        7218288 |     7889980872 |
+--------------------------------------+------------+-----------------+----------------+----------------+----------------+
1 row in set (0.01 sec)
Now we can observe that when we used client SQL we spent 7.6X the time waiting for the network compared to when we used stored procedures and it is not so much the time of each event but the cumulative difference.
Note that in some places such as cloud providers the wait event io/socket/sql/client_connection is documented as being related to thread creation, however it can be observed this metric increments when SQL statements are being run against the database rather than when clients are connecting. We can also drill down into the socket_summary_by_instance table to look further at the io/socket/sql/client_connection event, again firstly without stored procedures
*************************** 3. row ***************************
               EVENT_NAME: wait/io/socket/sql/client_connection
               COUNT_STAR: 356410019
           SUM_TIMER_WAIT: 2415153960635112
           MIN_TIMER_WAIT: 0
           AVG_TIMER_WAIT: 6775980
           MAX_TIMER_WAIT: 9975342936
               COUNT_READ: 178204845
           SUM_TIMER_READ: 133364264753112
           MIN_TIMER_READ: 0
           AVG_TIMER_READ: 748092
           MAX_TIMER_READ: 8409523512
 SUM_NUMBER_OF_BYTES_READ: 20950542108
              COUNT_WRITE: 178204678
          SUM_TIMER_WRITE: 2281784113760856
          MIN_TIMER_WRITE: 0
          AVG_TIMER_WRITE: 12804240
          MAX_TIMER_WRITE: 9975342936
SUM_NUMBER_OF_BYTES_WRITE: 49197673794
               COUNT_MISC: 496
           SUM_TIMER_MISC: 5582121144
           MIN_TIMER_MISC: 0
           AVG_TIMER_MISC: 11254116
           MAX_TIMER_MISC: 67299264
and secondly with:
*************************** 3. row ***************************
               EVENT_NAME: wait/io/socket/sql/client_connection
               COUNT_STAR: 43029616
           SUM_TIMER_WAIT: 308592755260896
           MIN_TIMER_WAIT: 0
           AVG_TIMER_WAIT: 7171416
           MAX_TIMER_WAIT: 6103182288
               COUNT_READ: 21514643
           SUM_TIMER_READ: 15175699757784
           MIN_TIMER_READ: 0
           AVG_TIMER_READ: 705312
           MAX_TIMER_READ: 5876657352
 SUM_NUMBER_OF_BYTES_READ: 3219606535
              COUNT_WRITE: 21514479
          SUM_TIMER_WRITE: 293411103781368
          MIN_TIMER_WRITE: 0
          AVG_TIMER_WRITE: 13637520
          MAX_TIMER_WRITE: 6103182288
SUM_NUMBER_OF_BYTES_WRITE: 6082914012
               COUNT_MISC: 494
           SUM_TIMER_MISC: 5951721744
           MIN_TIMER_MISC: 0
           AVG_TIMER_MISC: 12047964
           MAX_TIMER_MISC: 87785304
3 rows in set (0.01 sec)
We observe that io/socket/sql/client_connection does indeed provide us the same data as the events_waits_summary_global_by_event_name table but also the documentation tells us that the columns
COUNT_READ, SUM_TIMER_READ, MIN_TIMER_READ, AVG_TIMER_READ, MAX_TIMER_READ, SUM_NUMBER_OF_BYTES_READ aggregate all receive operations (RECV, RECVFROM, and RECVMSG) and COUNT_WRITE, SUM_TIMER_WRITE, MIN_TIMER_WRITE, AVG_TIMER_WRITE, MAX_TIMER_WRITE, SUM_NUMBER_OF_BYTES_WRITE columns aggregate all send operations (SEND, SENDTO, and SENDMSG). So now we can relate the database statistics to what we can observe on the system and see that without stored procedures we spend 8.8X the time on read operations (RECV, RECVFROM, and RECVMSG) and 7.8X the time on writes (SEND, SENDTO, and SENDMSG) meaning without stored procedures we are spending a lot more time on the round trip between client and server and can use io/socket/sql/client_connection to quantify the difference.
To put it differently at least some of the time spent in the network accounts for the lower database throughput when we are not using stored procedures.
We could also expect that where operations are starting a transaction and then taking locks, if we are spending more time in the network then we could also be spending more time in lock waits. In this example measuring without stored procedures
mysql> select object_name, sum_timer_wait from table_lock_waits_summary_by_table where object_name = 'warehouse';
+-------------+----------------+
| object_name | sum_timer_wait |
+-------------+----------------+
| warehouse   |  3890167468704 |
+-------------+----------------+
1 row in set (0.00 sec)

mysql> select object_name, sum_timer_wait from table_lock_waits_summary_by_table where object_name = 'district';
+-------------+----------------+
| object_name | sum_timer_wait |
+-------------+----------------+
| district    |  5874029749344 |
+-------------+----------------+
1 row in set (0.00 sec)
compared to the same workload with stored procedures
mysql> select object_name, sum_timer_wait from table_lock_waits_summary_by_table where object_name = 'warehouse';
+-------------+----------------+
| object_name | sum_timer_wait |
+-------------+----------------+
| warehouse   |  4039611353088 |
+-------------+----------------+
1 row in set (0.00 sec)
mysql> select object_name, sum_timer_wait from table_lock_waits_summary_by_table where object_name = 'district';
+-------------+----------------+
| object_name | sum_timer_wait |
+-------------+----------------+
| district    |  5383666516296 |
+-------------+----------------+
1 row in set (0.00 sec)
The amount of time in lock waits goes up on the warehouse table but down on the district table as with the district table we have a SELECT FOR UPDATE statement that now includes a round trip between the SELECT and UPDATE.
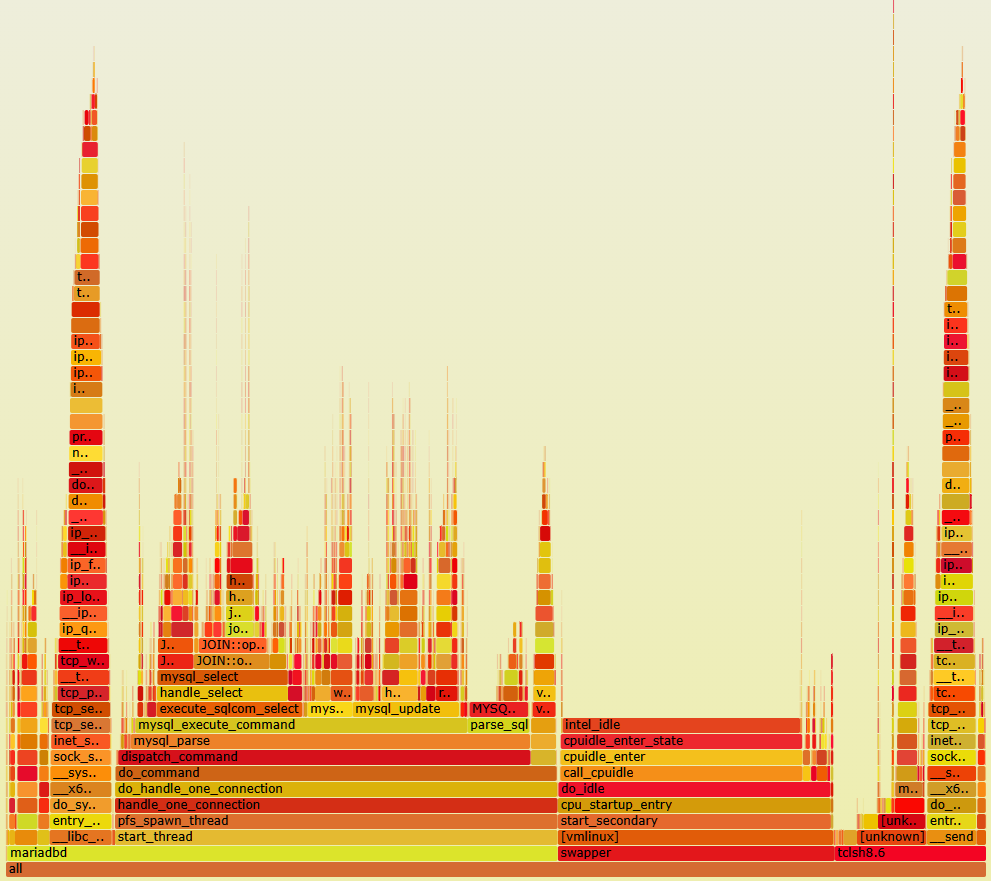
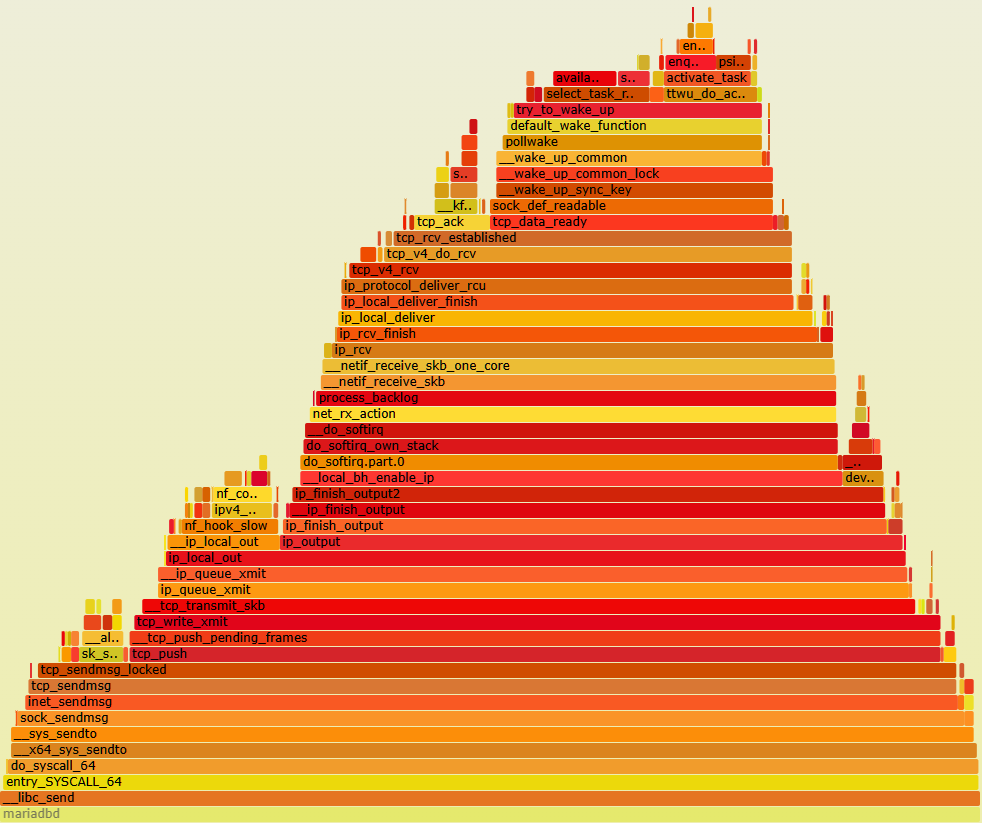
To visualize the overall difference we can generate a flame graph, again firstly without stored procedures
and secondly with
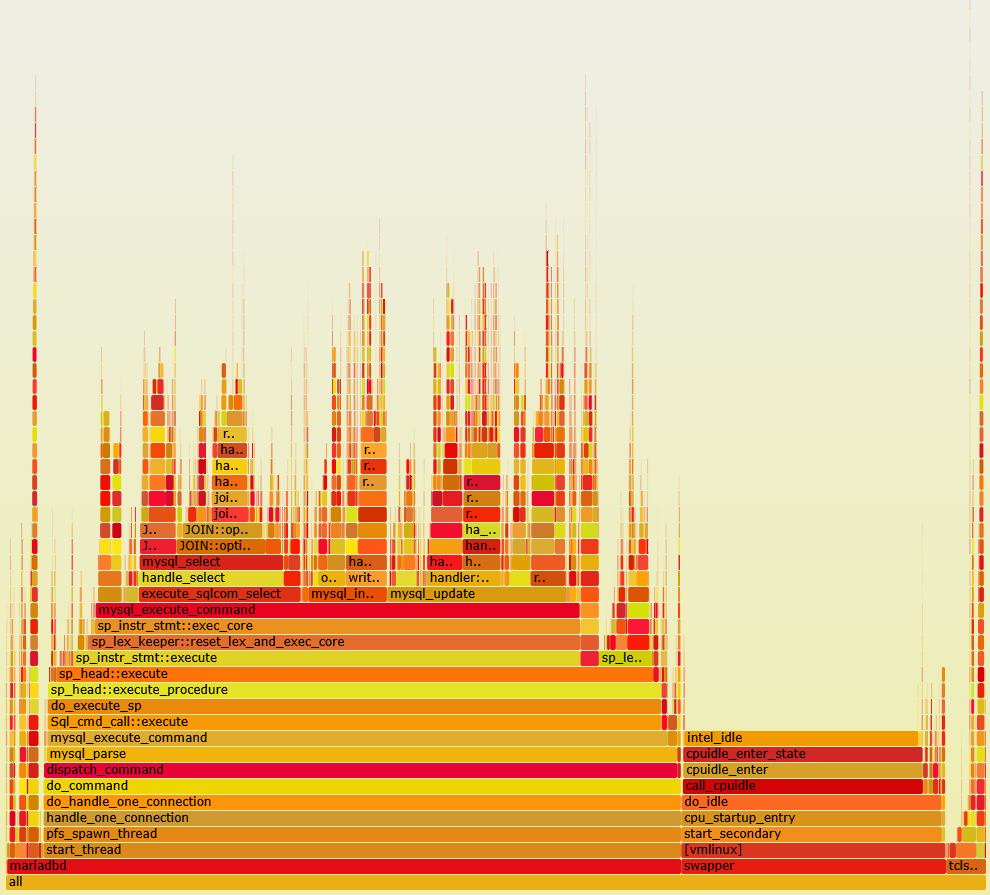
When you generate your own flame graphs you will have an interactive SVG file allowing you to drill down into both client and server functions, However the difference should immediately be clear at first glance.
The width of the bars show the time spent in each function and at the base as expected we are spending time in mariadbd, the tclsh8.6 client (i.e. HammerDB) and idle.
With stored procedures in the database and the HammerDB client the time spent in the network and even in the HammerDB client at all is minimal compared to the time spent in the database. This is intentional as the application logic is in a stored procedure within the database so we can see the time spent in do_execute_sp and the functions it calls, in particular mysql_execute_command are exactly the same as when we are not using stored procedures, i.e. the SQL is the same, but we are calling it faster.
When we run without stored procedures we can visualise what we saw from io/socket/sql/client_connection in that we are now spending a lot more time in send and recv functions in both the client and the server. note that within HammerDB this additional time is spend within the MariaDB client library.
We can also see additional time in MYSQLParse when we are not using stored procedures because we are sending SQL statements with literal values that may be different each time and therefore parsed each time, whereas stored procedures use parameters meaning the identical SQL can be reused.
System Performance with LinuxKI
From the previous analysis we can observe that the client and database is spending a lot more time in the network without stored procedures, however the previous timings only showed us active times. For a more complete picture each Virtual User is a parallel thread that matches a client connection meaning that we will now have both active but also idle time when both client and server are waiting to receive data.
mysql> select * from socket_instances;
+----------------------------------------+-----------------------+-----------+-----------+-----------+-------+--------+
| EVENT_NAME                             | OBJECT_INSTANCE_BEGIN | THREAD_ID | SOCKET_ID | IP        | PORT  | STATE  |
+----------------------------------------+-----------------------+-----------+-----------+-----------+-------+--------+
| wait/io/socket/sql/server_tcpip_socket |        94367427331136 |         1 |        15 | ::1       |  3306 | ACTIVE |
| wait/io/socket/sql/server_tcpip_socket |        94367427331456 |         1 |        16 | 127.0.0.1 |  3306 | ACTIVE |
| wait/io/socket/sql/server_unix_socket  |        94367427331776 |         1 |        17 |           |     0 | ACTIVE |
| wait/io/socket/sql/client_connection   |        94367427332096 |         9 |        38 |           |     0 | ACTIVE |
| wait/io/socket/sql/client_connection   |        94367427384896 |      2281 |        39 | 127.0.0.1 | 58684 | IDLE   |
| wait/io/socket/sql/client_connection   |        94367427385216 |      2282 |        40 | 127.0.0.1 | 58690 | IDLE   |
| wait/io/socket/sql/client_connection   |        94367427385536 |      2283 |        41 | 127.0.0.1 | 58696 | ACTIVE |
...
| wait/io/socket/sql/client_connection   |        94367427410176 |      2360 |       144 | 127.0.0.1 | 50442 | ACTIVE |
| wait/io/socket/sql/client_connection   |        94367427410496 |      2361 |       145 | 127.0.0.1 | 50444 | ACTIVE |
| wait/io/socket/sql/client_connection   |        94367427410816 |      2362 |       146 | 127.0.0.1 | 50458 | IDLE   |
+----------------------------------------+-----------------------+-----------+-----------+-----------+-------+--------+
86 rows in set (0.00 sec)
When using client SQL we are going to spend more time in the network as well as more time idle waiting to send and receive and more time for the threads to context switch between states.
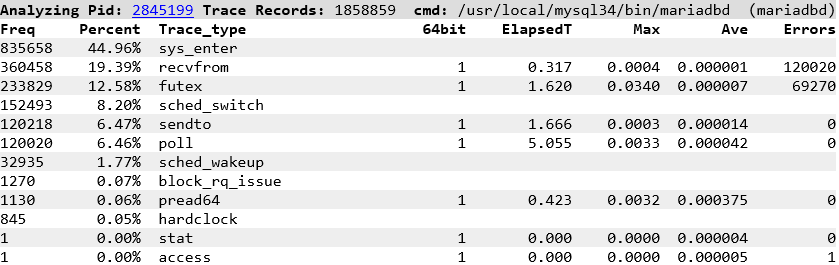
To illustrate this we will use the LinuxKI Toolset which is designed to answer 2 key questions, namely, If it’s running, what’s it doing? and If it’s waiting, what’s it waiting on? To do this we run LinuxKI for 20 seconds while running the workload with and without stored procedures and view the LinuxKI report.
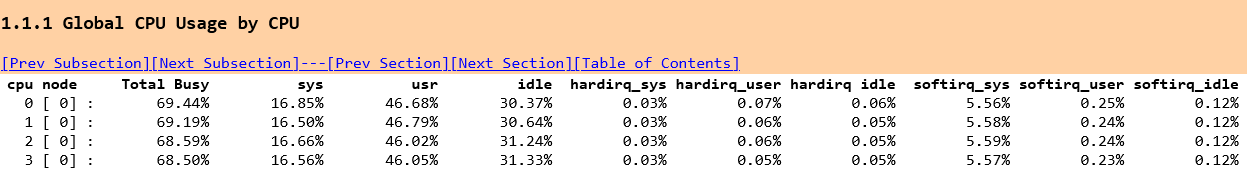
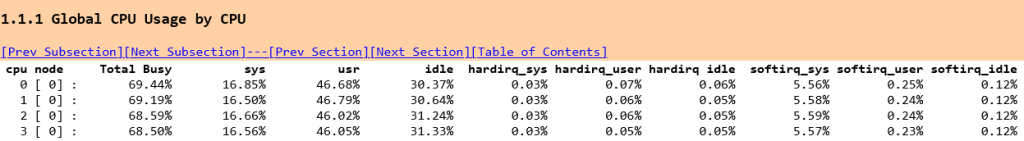
When we observe the global CPU usage one clear difference is the increase in softirqs or software interrupts.(If we were running over a network using the network card we would also see an increase in hardware interrupts).
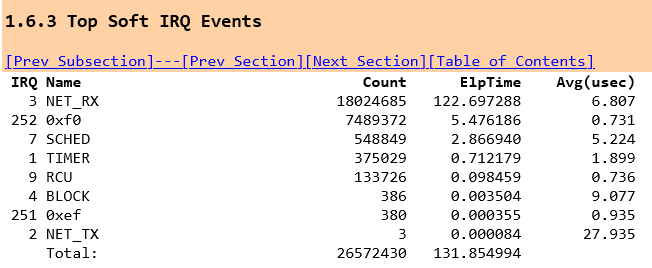
In the LinuxKI report we can see the difference without stored procedures
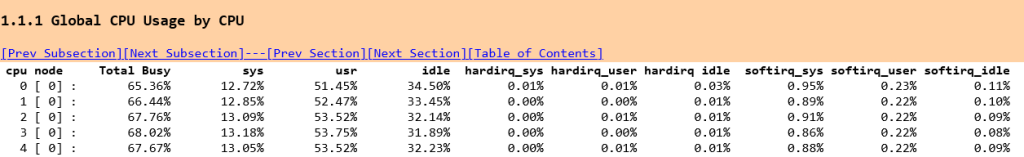
and with stored procedures
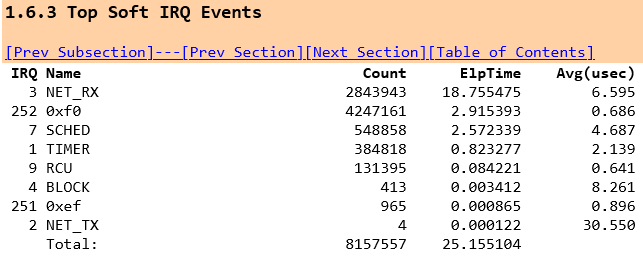
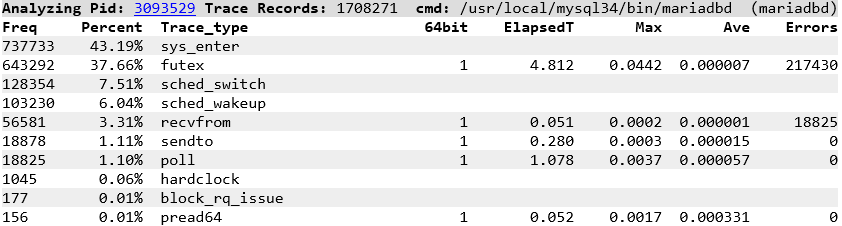
so without stored procedures we are spending 6.8X the time in the NET_RX Soft IRQ utilising 5% of the available CPU where the main function is net_rx_action which processes the data flow. And in both client and server you can see the data being sent
received
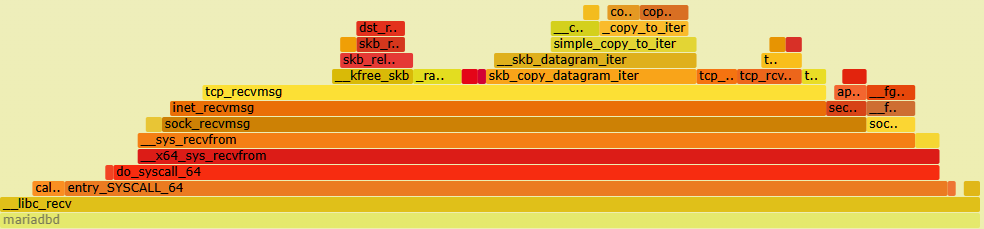
and read (in both the MariaDB client and server)
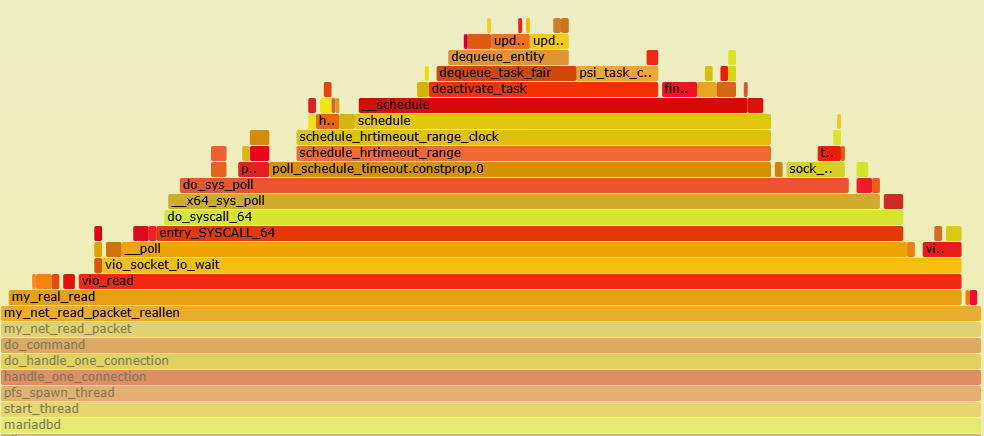
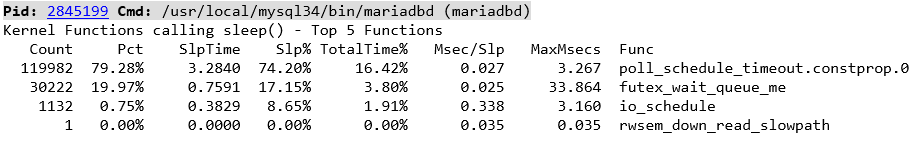
Note the function in both client and server of poll_schedule_timeout as this is what we see in the trace events of the top processes calling sleep, so we are seeing timeouts and tasks being descheduled while we are polling inside MariaDB waiting for data and then woken up when the data is ready.
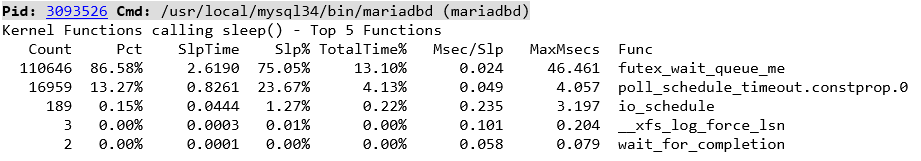
and for contrast with stored procedures where we now see futex for MariaDB mutex locking as we driving a greater level of database throughput and futex_wait_queue_me as we are waiting for mutex acquisition.
and if our MariaDB threads are polling then timing out we are going to be descheduled and doing more context switches, which we can observe on a system wide basis with vmstat or in this example on a per thread basis with pidstat. Capturing this data without stored procedures.
pidstat -wt 3 10
04:01:02 AM  1001         -   3452701  12931.33      7.33  |__mariadbd
04:01:02 AM  1001         -   3452702  13691.00     13.33  |__mariadbd
04:01:02 AM  1001         -   3452703  11562.67     13.67  |__mariadbd
04:01:02 AM  1001         -   3452705  13753.67     14.33  |__mariadbd
04:01:02 AM  1001         -   3452716  12376.00     11.33  |__mariadbd
04:01:02 AM  1001         -   3452717  13874.00     10.00  |__mariadbd
04:01:02 AM  1001         -   3452720  11129.00      9.67  |__mariadbd
04:01:02 AM  1001         -   3452723  13543.67      9.33  |__mariadbd
04:01:02 AM  1001         -   3452726  11826.67     12.00  |__mariadbd
04:01:02 AM  1001         -   3452769   3810.67      3.00  |__mariadbd
04:01:02 AM  1001         -   3452770  12672.00      9.67  |__mariadbd
04:01:02 AM  1001         -   3452773  13539.00     11.67  |__mariadbd
04:01:02 AM  1001         -   3452774  11724.33     11.33  |__mariadbd
04:01:02 AM  1001         -   3452777  12707.67     12.00  |__mariadbd
...
04:01:02 AM     0         -   3456145   8858.33     11.33  |__tclsh8.6
04:01:02 AM     0         -   3456146   9661.00      8.33  |__tclsh8.6
04:01:02 AM     0         -   3456147   8439.67     10.00  |__tclsh8.6
04:01:02 AM     0         -   3456148   8969.33      9.00  |__tclsh8.6
04:01:02 AM     0         -   3456149   8453.00      8.00  |__tclsh8.6
04:01:02 AM     0         -   3456150   7752.67      8.00  |__tclsh8.6
04:01:02 AM     0         -   3456151   6378.33      8.67  |__tclsh8.6
04:01:02 AM     0         -   3456152   4978.00      6.33  |__tclsh8.6
04:01:02 AM     0         -   3456153   4054.67      1.67  |__tclsh8.6
04:01:02 AM     0         -   3456154   2726.67      3.00  |__tclsh8.6
and with stored procedures.
pidstat -wt 3 10
04:07:12 AM  1001         -   3452701   8474.67      7.00  |__mariadbd
04:07:12 AM  1001         -   3452702   8464.33      6.67  |__mariadbd
04:07:12 AM  1001         -   3452703   8403.00      6.33  |__mariadbd
04:07:12 AM  1001         -   3452704   8339.33      5.33  |__mariadbd
04:07:12 AM  1001         -   3452705   8712.00      6.00  |__mariadbd
04:07:12 AM  1001         -   3452706   8656.00      3.33  |__mariadbd
04:07:12 AM  1001         -   3452707   8671.67      5.67  |__mariadbd
04:07:12 AM  1001         -   3452708   8585.67      9.00  |__mariadbd
04:07:12 AM  1001         -   3452716   8361.33      6.67  |__mariadbd
04:07:12 AM  1001         -   3452717   8541.67      6.00  |__mariadbd
04:07:12 AM  1001         -   3452718   8664.33      8.00  |__mariadbd
04:07:12 AM  1001         -   3452719   8574.00      6.33  |__mariadbd
04:07:12 AM  1001         -   3452720   8748.00      3.33  |__mariadbd
...
04:07:12 AM     0         -   3457711    645.33      9.33  |__tclsh8.6
04:07:12 AM     0         -   3457712    646.00     15.00  |__tclsh8.6
04:07:12 AM     0         -   3457713    674.33     15.33  |__tclsh8.6
04:07:12 AM     0         -   3457714    649.33     14.00  |__tclsh8.6
04:07:12 AM     0         -   3457715    652.67     14.00  |__tclsh8.6
04:07:12 AM     0         -   3457716    687.67     15.67  |__tclsh8.6
04:07:12 AM     0         -   3457717    634.67     14.33  |__tclsh8.6
04:07:12 AM     0         -   3457718    638.33     11.67  |__tclsh8.6
04:07:12 AM     0         -   3457719    654.00     16.00  |__tclsh8.6
04:07:12 AM     0         -   3457720    703.33     15.33  |__tclsh8.6
04:07:12 AM     0         -   3457721    669.67      7.67  |__tclsh8.6
04:07:12 AM     0         -   3457722    656.33     12.00  |__tclsh8.6
04:07:12 AM     0         -   3457723    681.33     13.00  |__tclsh8.6
We can see that our HammerDB is now doing almost 14X the number of context switches in our MariaDB client (tclsh8.6) without stored procedures. This is also going to cause run queue latency to go up as our threads are spending more time being switched off the CPU and back on again. As a thread can also be scheduled on another CPU we also see the number of migrations between CPUs increase as well as the Node migrations between different NUMA nodes. Again without stored procedures
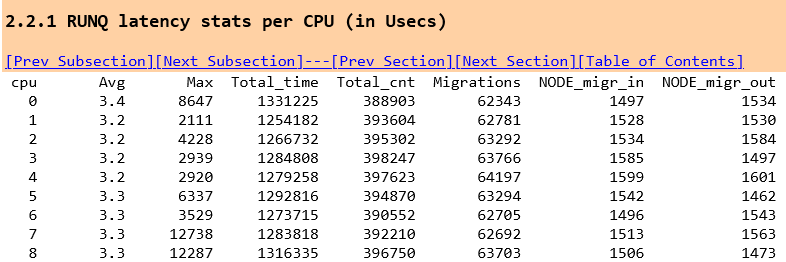
and to contrast, with stored procedures
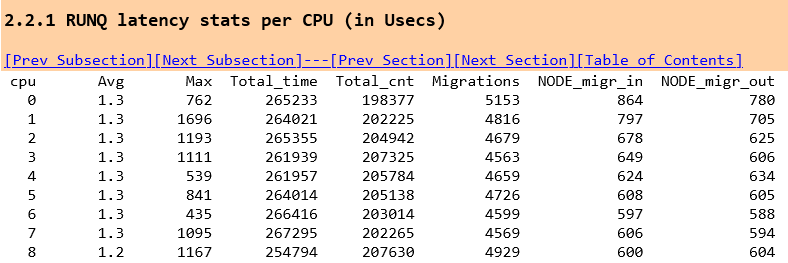
and thread migration can introduce a delay in the NET_RX soft irq performance.
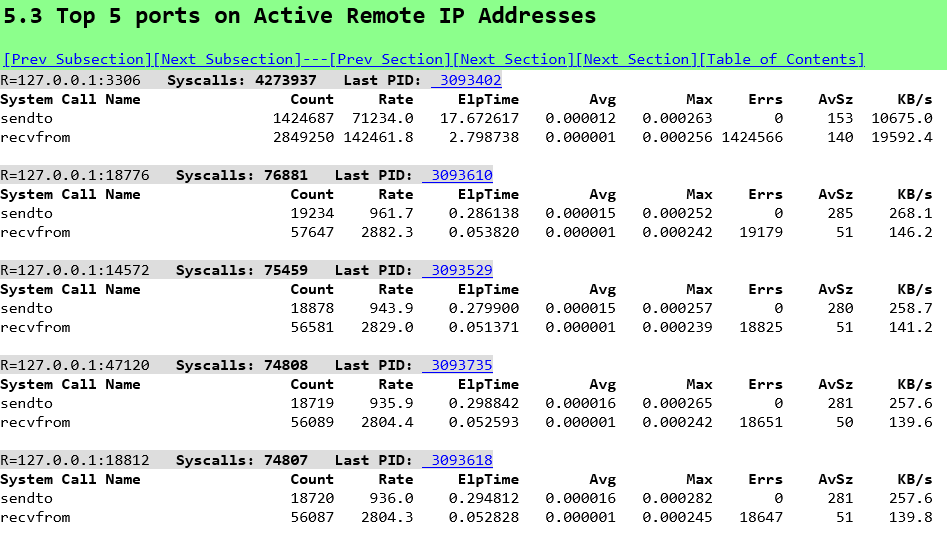
Although the LinuxKI report has a wealth more information we can relate this back to the database statistics by observing the sendto/recvfrom activity on the MariaDB ports, without stored procedures.
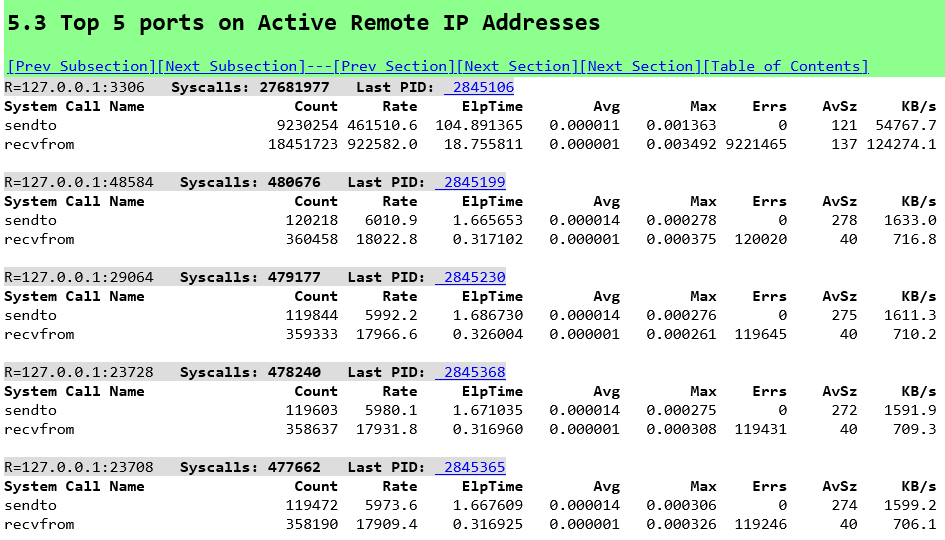
For example the data sent to port 3306 matches the BYTES_RECEIVED: 54 MB/s from the database statistics and the data received from port 3306 matches the BYTES_SENT: 120 MB/s. The other ports shows the HammerDB Virtual Users. And the same data with stored procedures.
LinuxKI enables us to have a system wide view of database performance.
Summary
The key question in this post is why you should benchmark your database using stored procedures and even though the example uses the local loopback address, when we are running the same workload without stored procedures we can observe how much more time we spend in the network and context switches rather than in the database. When we use stored procedures we spend as much time as possible in the database driving higher levels of throughput meaning we are better able to observe the performance capabilities of the database and system under test.
Nevertheless, in some cases testing without stored procedures may be useful particularly if we are observing the impact of changes at the network layer such as encryption or compression and the HammerDB v4.9 no stored procedure option gives you the flexibility to benchmark such a configuration.
However if you are looking to benchmark a database with client SQL you should account for how much time is spent in each layer, especially if you are running the test over an external network and bring hardware interrupts into play.

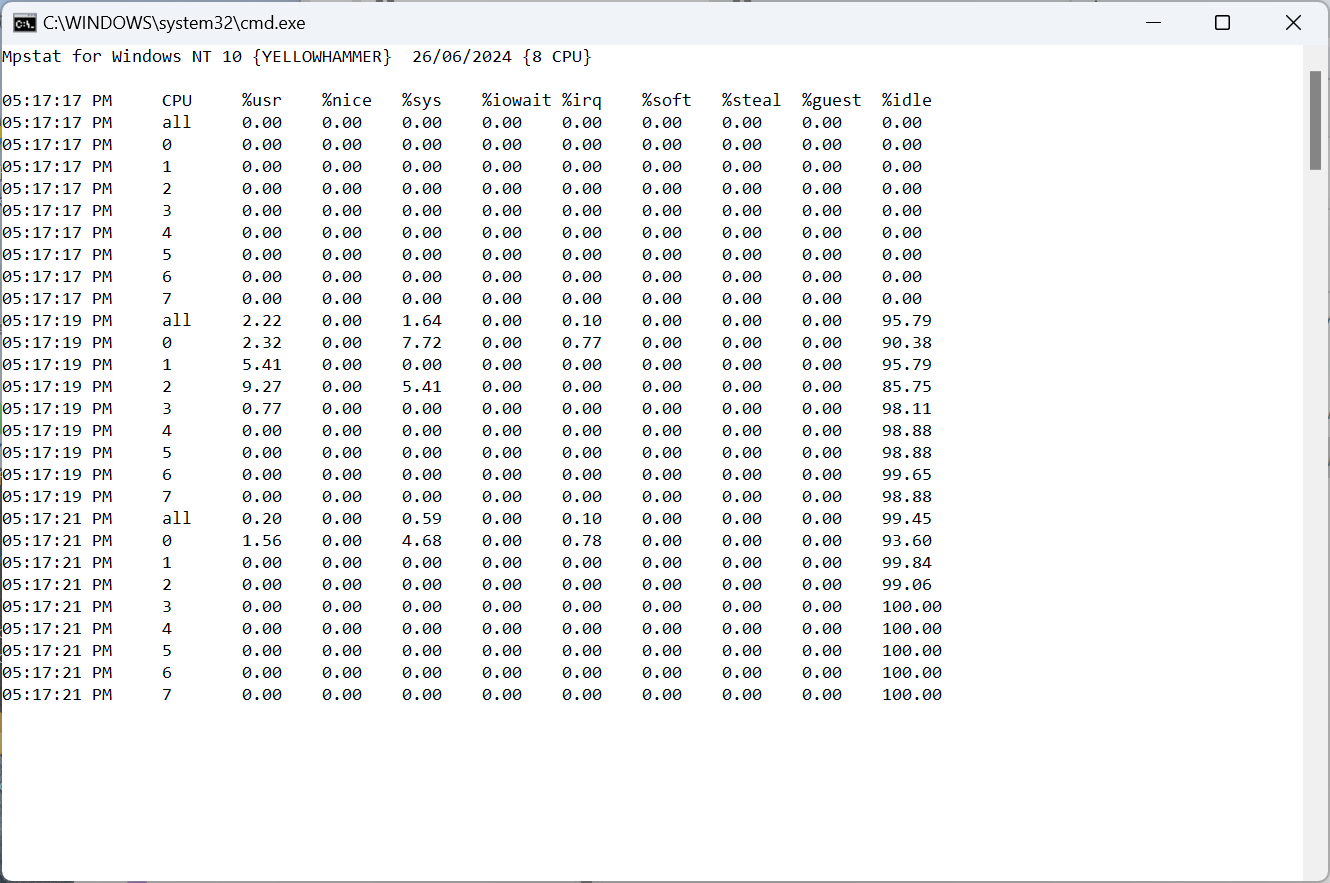
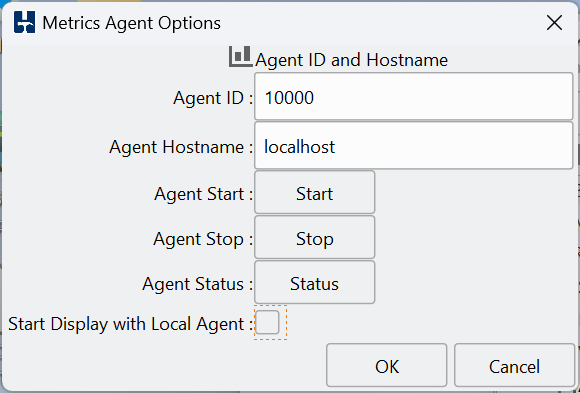
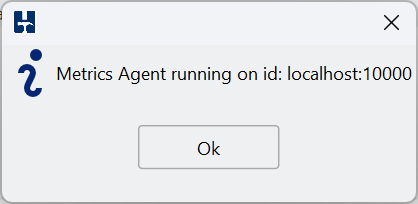
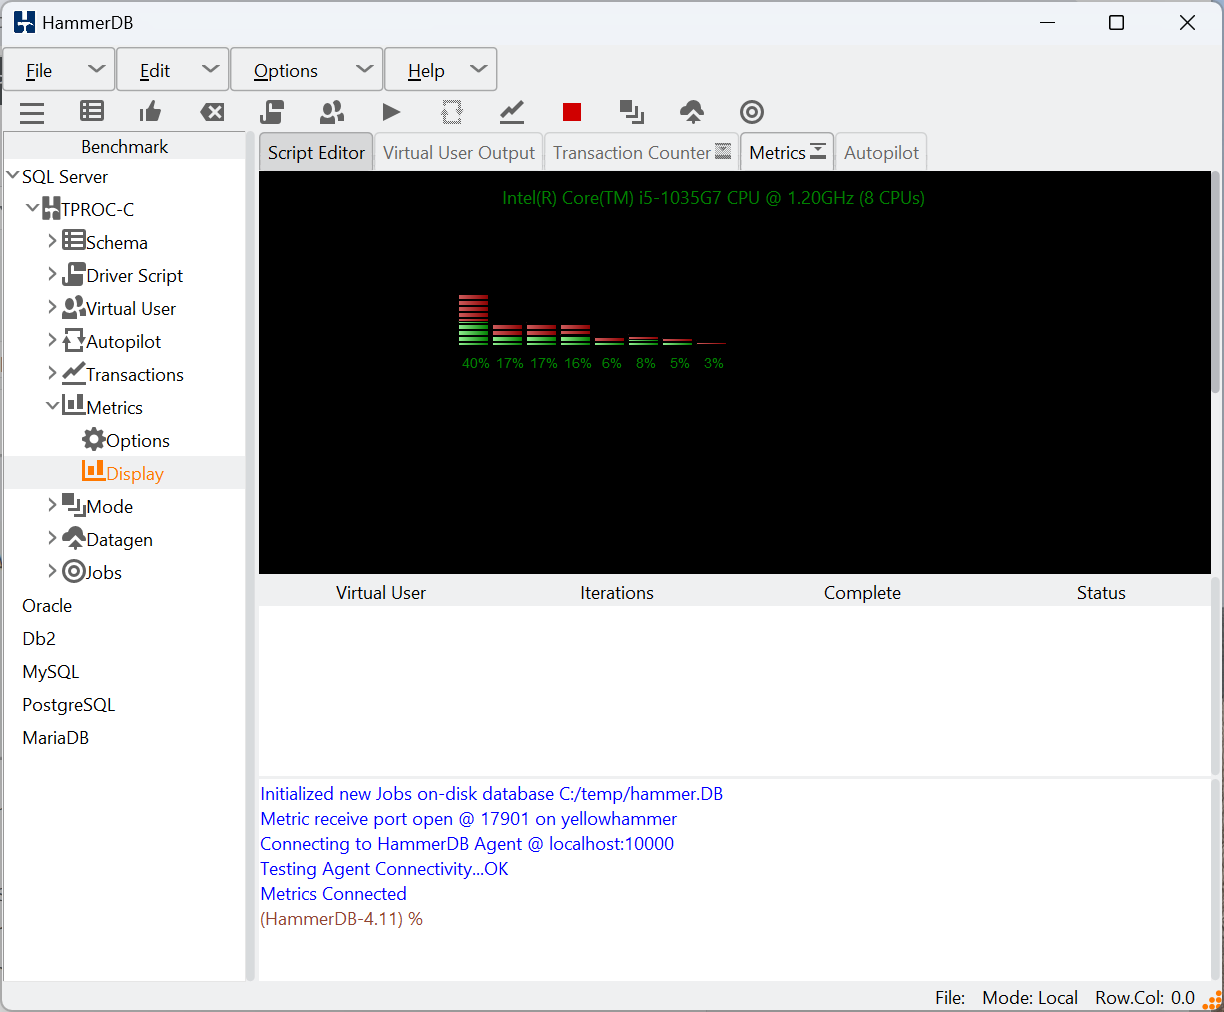
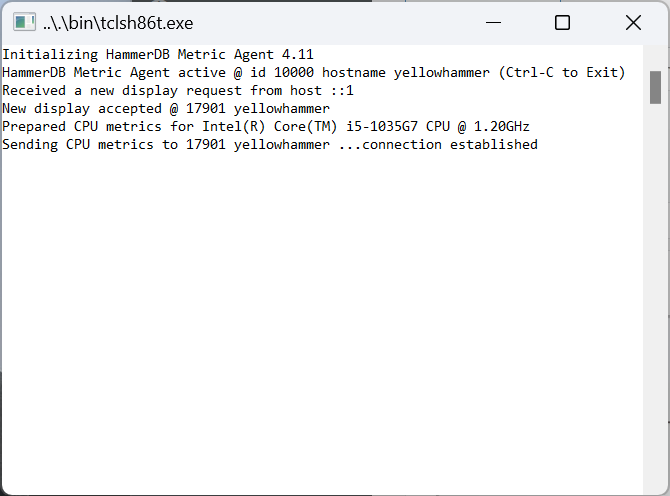
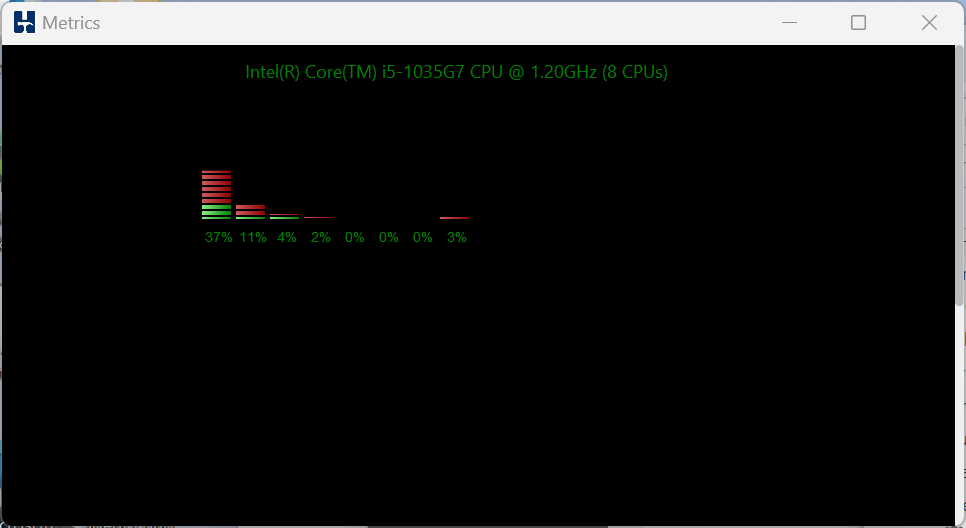
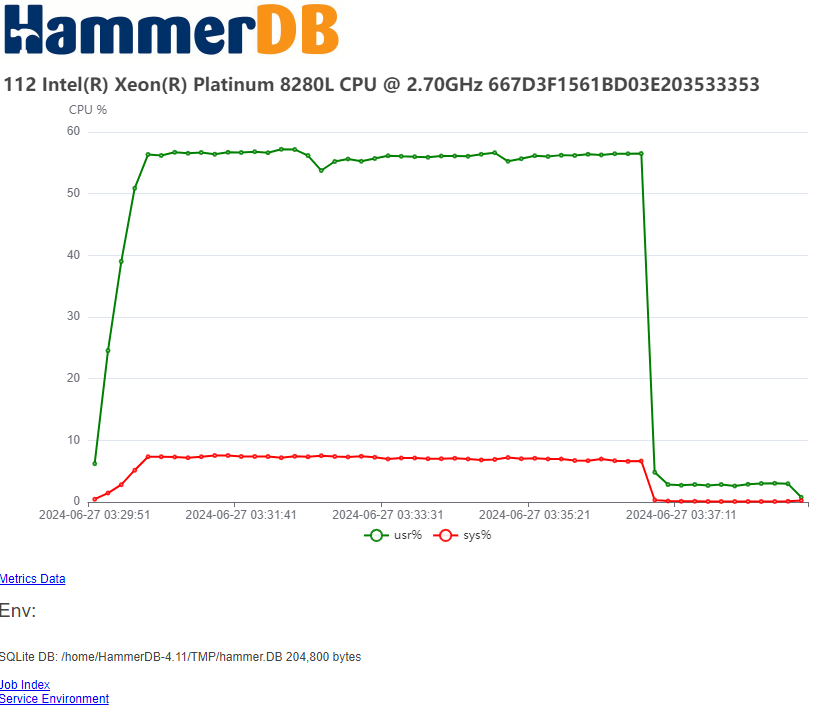
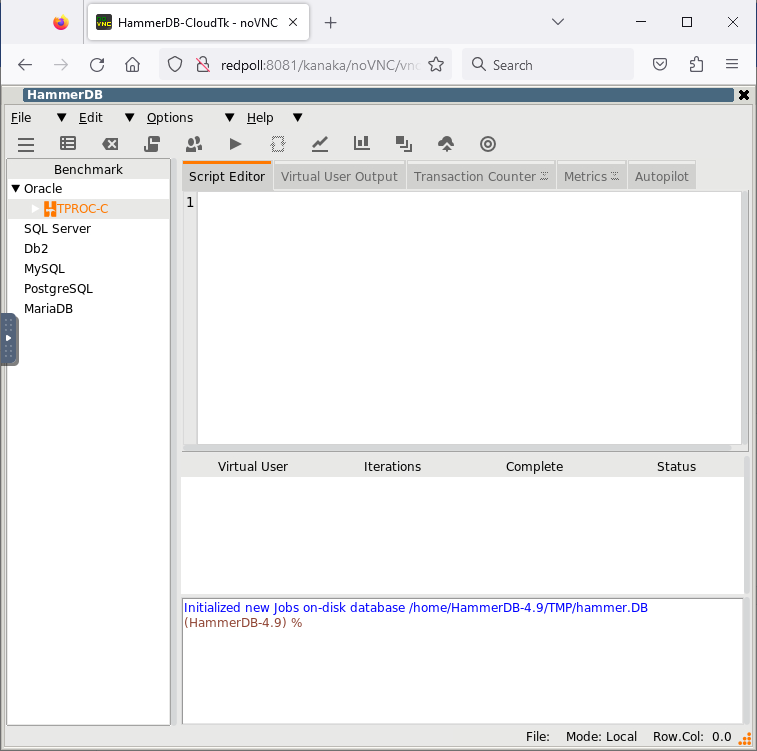
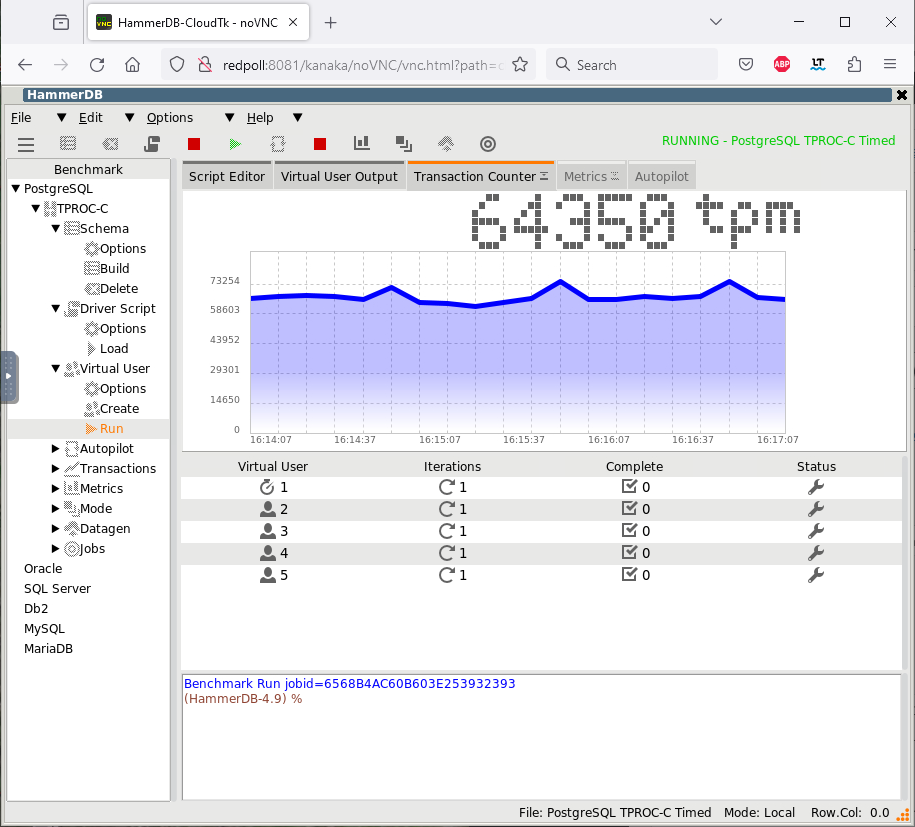
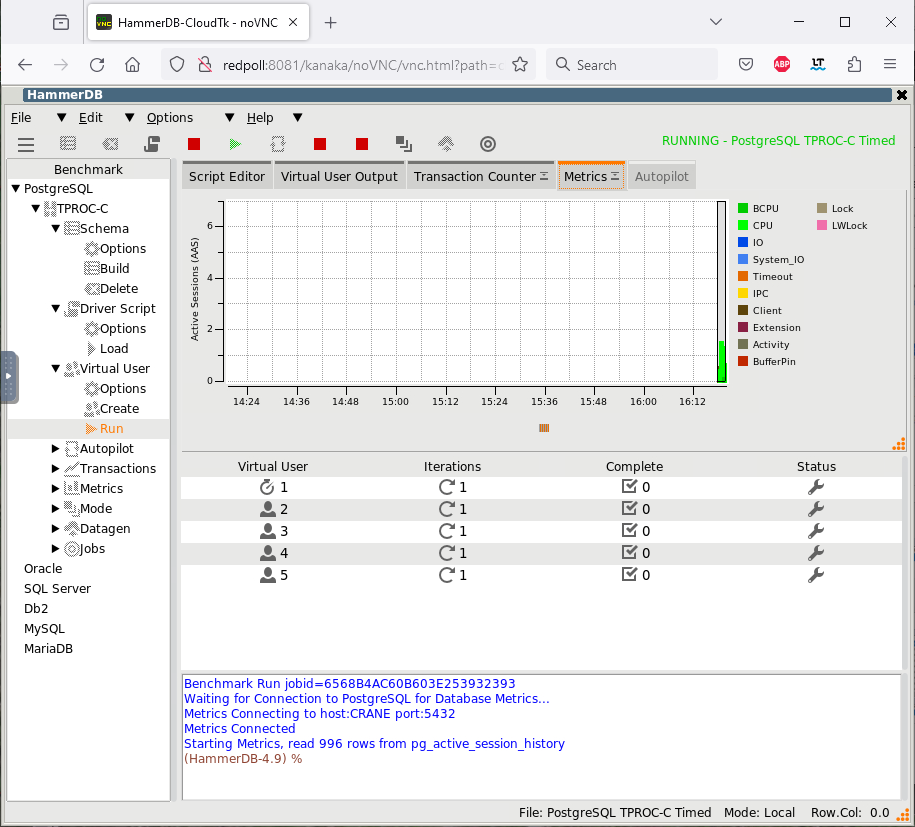
 One of the key metrics for measuring database performance is CPU utilisation. Therefore since version 2.16 HammerDB has included a CPU monitor in the GUI to graphically observe this utilisation during a workload.