Percona Live ONLINE, THE Open Source Database Conference, is taking place May 12-13, 2021. This year Steve Shaw will be presenting HammerDB: A better Way to Benchmark Your Open Source Database on Thursday, May 13th 2021 at 13.30-14.30 EDT.
This presentation is now available to view on demand on YouTube. With slides also available for download from Percona.
Percona Live is a community-focused conference with an emphasis on promoting and increasing the adoption of open source database software. It provides a forum for open source database users and experts to ask questions, and share knowledge and experience.
Online and free to attend in 2021, register to hear industry experts discuss their experiences, deep-dive into software features, and offer insight and advice.
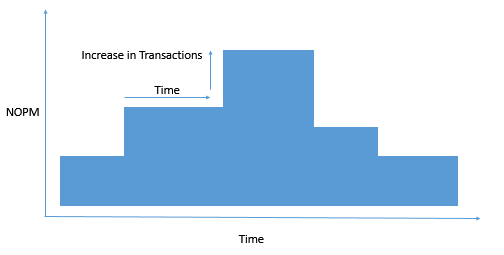
HammerDB Variable or Step Workloads are an advanced testing feature that enables you to automatically vary the load on the database over a period of time. When taking this approach you would not focus on the test result but instead monitor the databases ability to cope with the variation in demand and transaction response times.
Step Workloads
To implement Step Workloads, HammerDB v4.1 introduces a CLI only command called steprun combined with a new XML configuration file called steps.xml. the steprun command reads the XML configuration file and creates primary and replica instances of HammerDB per step with the replica instances starting at pre-defined time intervals automatically connecting back to the primary instance of HammerDB.
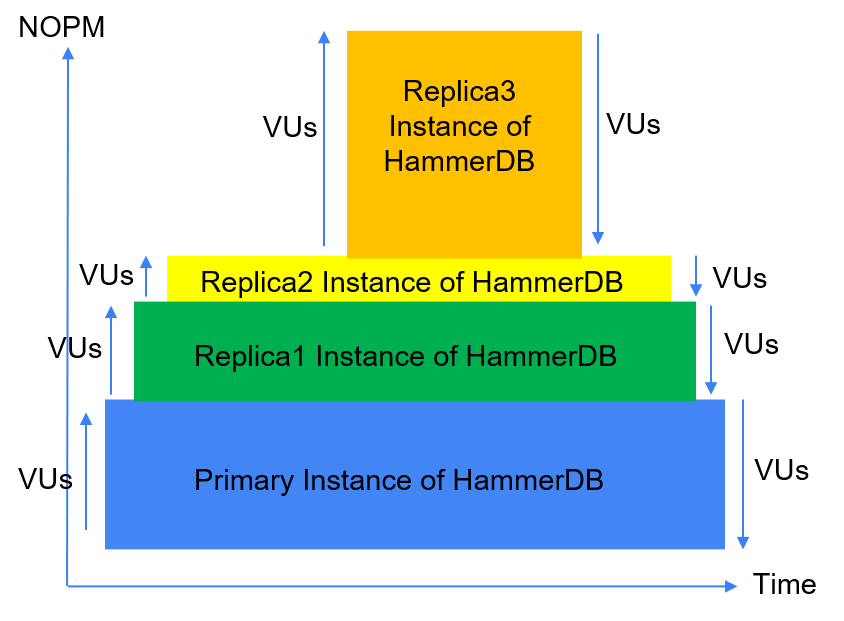
Primary and Replicas
When defining the workload it is best to think of the configuration as defining a pyramid with the primary at the base and the replicas sitting above it. Each replica must finish at the same time or earlier than the primary. The primary running time continues to be defined by the standard settings. For example for configuring an Oracle workload the following commands set the rampup and duration running times respectively. Therefore in this case the workload woud run for 12 minutes with 2 minutes of rampup and 10 minutes of duration.
diset tpcc rampup 2
diset tpcc duration 10
The replicas are defined in steps.xml in the config directory to determine how many virtual users each replica will configure, how soon after the previous instance has started the replica should start and how long it will run for.
If the configuration is incorrect HammerDB will report the error and fail to start the Step Workload. In the following example we have set the default 2 minutes of rampup and 5 minutes of test.
diset tpcc rampup 2
diset tpcc duration 5
In this case the workload errors because the replica running times exceed the primary.
Value 2 for tpcc:rampup is the same as existing value 2, no change made
Value 5 for tpcc:duration is the same as existing value 5, no change made
primary starts immediately, runs rampup for 2 minutes then runs test for 5 minutes with 2 Active VU
replica1 starts 2 minutes after rampup completes and runs test for 8 minutes with 2 Active VU
Error: replica1 is set to complete after 12 minutes and is longer than the Primary running time of 7 minutes
replica2 starts 2 minutes after previous replica starts and runs test for 6 minutes with 2 Active VU
Error: replica2 is set to complete after 12 minutes and is longer than the Primary running time of 7 minutes
replica3 starts 2 minutes after previous replica starts and runs test for 4 minutes with 2 Active VU
Error: replica3 is set to complete after 12 minutes and is longer than the Primary running time of 7 minutes
replica4 starts 2 minutes after previous replica starts and runs test for 2 minutes with 2 Active VU
Error: replica4 is set to complete after 12 minutes and is longer than the Primary running time of 7 minutes
Error: Step workload primary running time must exceed the running time of all replicas
Instead the following script defines the rampup of 2 minutes and duration of 10 correctly so that the primary provides an adequate base for the pyramid, starting before and ending at the same time or after all of the replicas. The workload is started with the steprun command as the last command. No commands should follow steprun as the command will intentionally exit all replicas and the primary when the workload is complete.
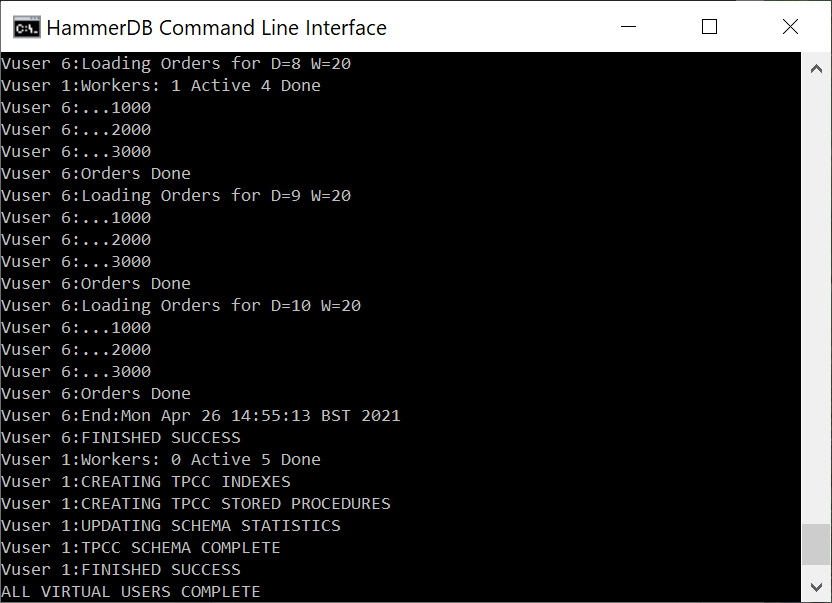
Running this script it can be seen that without further intervention the primary and replicas are created with the replicas automatically connecting back to the primary, the replicas are then started at the time interval given in the steps.xml file.
The primary sets the rampup in the replicas to zero (as the rampup has completed in the primary) and then sends the individual duration times to the replicas. Time profiling is also disabled in the replicas. When complete replicas will call exit from the primary and when the final replica has completed the primary will also exit.
Note that it is expected for Virtual User 1 of the replicas to end immediately with the message.
Vuser 1:FINISHED SUCCESS
This is because Virtual User 1 is the monitor Virtual User but this Virtual User does not run in the replica meaning it ends immediately. When the replicas are started the message sending “run_virtual” is recorded.
Sending "run_virtual" ....
The following output shows the previously defined step workload running against an Oracle database.
hammerdb>source runstepora.tcl
Database set to Oracle
Benchmark set to TPC-C for Oracle
Value system for connection:system_user is the same as existing value system, no change made
Changed connection:system_password from manager to oracle for Oracle
Changed connection:instance from oracle to RAZPDB1 for Oracle
Value tpcc for tpcc:tpcc_user is the same as existing value tpcc, no change made
Value tpcc for tpcc:tpcc_pass is the same as existing value tpcc, no change made
Changed tpcc:total_iterations from 1000000 to 10000000 for Oracle
Clearing Script, reload script to activate new setting
Script cleared
Changed tpcc:ora_driver from test to timed for Oracle
Value 2 for tpcc:rampup is the same as existing value 2, no change made
Changed tpcc:duration from 5 to 10 for Oracle
primary starts immediately, runs rampup for 2 minutes then runs test for 10 minutes with 2 Active VU
replica1 starts 2 minutes after rampup completes and runs test for 8 minutes with 2 Active VU
replica2 starts 2 minutes after previous replica starts and runs test for 6 minutes with 2 Active VU
replica3 starts 2 minutes after previous replica starts and runs test for 4 minutes with 2 Active VU
replica4 starts 2 minutes after previous replica starts and runs test for 2 minutes with 2 Active VU
Switch from Local
to Primary mode?
Enter yes or no: replied yes
Setting Primary Mode at id : 20166, hostname : razorbill.home
Primary Mode active at id : 20166, hostname : razorbill.home
Starting 1 replica HammerDB instance
Starting 2 replica HammerDB instance
HammerDB CLI v4.1
Copyright (C) 2003-2021 Steve Shaw
Type "help" for a list of commands
HammerDB CLI v4.1
Copyright (C) 2003-2021 Steve Shaw
Type "help" for a list of commands
Starting 3 replica HammerDB instance
Starting 4 replica HammerDB instance
Doing wait to connnect ....
Primary waiting for all replicas to connect .... 0 out of 4 are connected
HammerDB CLI v4.1
Copyright (C) 2003-2021 Steve Shaw
Type "help" for a list of commands
HammerDB CLI v4.1
Copyright (C) 2003-2021 Steve Shaw
Type "help" for a list of commands
The xml is well-formed, applying configuration
The xml is well-formed, applying configuration
The xml is well-formed, applying configuration
Switch from Local
to Replica mode?
Enter yes or no: replied yes
Switch from Local
to Replica mode?
Enter yes or no: replied yes
Setting Replica Mode at id : 20182, hostname : razorbill.home
Replica connecting to localhost 20166 : Connection succeeded
Received a new replica connection from host ::1
Setting Replica Mode at id : 20181, hostname : razorbill.home
Replica connecting to localhost 20166 : Connection succeeded
New replica joined : {20182 razorbill.home}
The xml is well-formed, applying configuration
Received a new replica connection from host ::1
New replica joined : {20182 razorbill.home} {20181 razorbill.home}
Switch from Local
to Replica mode?
Primary call back successful
Switched to Replica mode via callback
Enter yes or no: replied yes
Primary call back successful
Switched to Replica mode via callback
Setting Replica Mode at id : 20183, hostname : razorbill.home
Received a new replica connection from host ::1
Replica connecting to localhost 20166 : Connection succeeded
New replica joined : {20182 razorbill.home} {20181 razorbill.home} {20183 razorbill.home}
Primary call back successful
Switched to Replica mode via callback
Switch from Local
to Replica mode?
Enter yes or no: replied yes
Setting Replica Mode at id : 20184, hostname : razorbill.home
Received a new replica connection from host ::1
Replica connecting to localhost 20166 : Connection succeeded
New replica joined : {20182 razorbill.home} {20181 razorbill.home} {20183 razorbill.home} {20184 razorbill.home}
Primary call back successful
Switched to Replica mode via callback
Primary waiting for all replicas to connect .... {20182 razorbill.home} {20181 razorbill.home} {20183 razorbill.home} {20184 razorbill.home} out of 4 are connected
Primary Received all replica connections {20182 razorbill.home} {20181 razorbill.home} {20183 razorbill.home} {20184 razorbill.home}
Database set to Oracle
Database set to Oracle
Database set to Oracle
Setting primary to run 2 virtual users for 10 duration
Database set to Oracle
Database set to Oracle
Value 10 for tpcc:duration is the same as existing value 10, no change made
Sending dbset all to 20182 razorbill.home
Setting replica1 to start after 2 duration 8 VU count 2, Replica instance is 20182 razorbill.home
Sending "diset tpcc ora_timeprofile false" to 20182 razorbill.home
Value false for tpcc:ora_timeprofile is the same as existing value false, no change made
Sending "diset tpcc rampup 0" to 20182 razorbill.home
Changed tpcc:rampup from 2 to 0 for Oracle
Sending "diset tpcc duration 8" to 20182 razorbill.home
Changed tpcc:duration from 10 to 8 for Oracle
Sending "vuset vu 2" to 20182 razorbill.home
Sending dbset all to 20181 razorbill.home
Setting replica2 to start after 2 duration 6 VU count 2, Replica instance is 20181 razorbill.home
Sending "diset tpcc ora_timeprofile false" to 20181 razorbill.home
Value false for tpcc:ora_timeprofile is the same as existing value false, no change made
Sending "diset tpcc rampup 0" to 20181 razorbill.home
Changed tpcc:rampup from 2 to 0 for Oracle
Sending "diset tpcc duration 6" to 20181 razorbill.home
Changed tpcc:duration from 10 to 6 for Oracle
Sending "vuset vu 2" to 20181 razorbill.home
Sending dbset all to 20183 razorbill.home
Setting replica3 to start after 2 duration 4 VU count 2, Replica instance is 20183 razorbill.home
Sending "diset tpcc ora_timeprofile false" to 20183 razorbill.home
Value false for tpcc:ora_timeprofile is the same as existing value false, no change made
Sending "diset tpcc rampup 0" to 20183 razorbill.home
Changed tpcc:rampup from 2 to 0 for Oracle
Sending "diset tpcc duration 4" to 20183 razorbill.home
Changed tpcc:duration from 10 to 4 for Oracle
Sending "vuset vu 2" to 20183 razorbill.home
Sending dbset all to 20184 razorbill.home
Setting replica4 to start after 2 duration 2 VU count 2, Replica instance is 20184 razorbill.home
Sending "diset tpcc ora_timeprofile false" to 20184 razorbill.home
Value false for tpcc:ora_timeprofile is the same as existing value false, no change made
Sending "diset tpcc rampup 0" to 20184 razorbill.home
Changed tpcc:rampup from 2 to 0 for Oracle
Sending "diset tpcc duration 2" to 20184 razorbill.home
Changed tpcc:duration from 10 to 2 for Oracle
Sending "vuset vu 2" to 20184 razorbill.home
Script loaded, Type "print script" to view
Script loaded, Type "print script" to view
Script loaded, Type "print script" to view
Script loaded, Type "print script" to view
Script loaded, Type "print script" to view
Vuser 1 created MONITOR - WAIT IDLE
Vuser 2 created - WAIT IDLE
Vuser 3 created - WAIT IDLE
Vuser 1 created MONITOR - WAIT IDLE
Vuser 2 created - WAIT IDLE
Vuser 1 created MONITOR - WAIT IDLE
Vuser 3 created - WAIT IDLE
Vuser 2 created - WAIT IDLE
3 Virtual Users Created with Monitor VU
Vuser 3 created - WAIT IDLE
3 Virtual Users Created with Monitor VU
Vuser 1 created MONITOR - WAIT IDLE
Vuser 2 created - WAIT IDLE
Vuser 3 created - WAIT IDLE
3 Virtual Users Created with Monitor VU
Vuser 1 created MONITOR - WAIT IDLE
Vuser 2 created - WAIT IDLE
Vuser 3 created - WAIT IDLE
3 Virtual Users Created with Monitor VU
Logging activated
to /tmp/hammerdb.log
3 Virtual Users Created with Monitor VU
Starting Primary VUs
Vuser 1:RUNNING
Vuser 1:Beginning rampup time of 2 minutes
Vuser 2:RUNNING
Vuser 2:Processing 10000000 transactions with output suppressed...
Vuser 3:RUNNING
Vuser 3:Processing 10000000 transactions with output suppressed...
Delaying Start of Replicas to rampup 2 replica1 2 replica2 2 replica3 2 replica4 2
Delaying replica1 for 4 minutes.
Delaying replica2 for 6 minutes.
Delaying replica3 for 8 minutes.
Delaying replica4 for 10 minutes.
Primary entering loop waiting for vucomplete
Vuser 1:Rampup 1 minutes complete ...
Vuser 1:Rampup 2 minutes complete ...
Vuser 1:Rampup complete, Taking start AWR snapshot.
Vuser 1:Start Snapshot 18 taken at 10 MAY 2021 09:07 of instance RAZCDB1 (1) of database RAZCDB1 (171153594)
Vuser 1:Timing test period of 10 in minutes
Vuser 1:1 ...,
Sending "run_virtual" to 20182 razorbill.home
Vuser 1:RUNNING
Vuser 1:Operating in Replica Mode, No Snapshots taken...
Vuser 1:FINISHED SUCCESS
Vuser 2:RUNNING
Vuser 2:Processing 10000000 transactions with output suppressed...
Vuser 3:RUNNING
Vuser 3:Processing 10000000 transactions with output suppressed...
Vuser 1:2 ...,
Vuser 1:3 ...,
Sending "run_virtual" to 20181 razorbill.home
Vuser 1:RUNNING
Vuser 1:Operating in Replica Mode, No Snapshots taken...
Vuser 1:FINISHED SUCCESS
Vuser 2:RUNNING
Vuser 2:Processing 10000000 transactions with output suppressed...
Vuser 3:RUNNING
Vuser 3:Processing 10000000 transactions with output suppressed...
Vuser 1:4 ...,
Vuser 1:5 ...,
Sending "run_virtual" to 20183 razorbill.home
Vuser 1:RUNNING
Vuser 1:Operating in Replica Mode, No Snapshots taken...
Vuser 1:FINISHED SUCCESS
Vuser 2:RUNNING
Vuser 2:Processing 10000000 transactions with output suppressed...
Vuser 3:RUNNING
Vuser 3:Processing 10000000 transactions with output suppressed...
Vuser 1:6 ...,
Vuser 1:7 ...,
Sending "run_virtual" to 20184 razorbill.home
Vuser 1:RUNNING
Vuser 1:Operating in Replica Mode, No Snapshots taken...
Vuser 1:FINISHED SUCCESS
Vuser 2:RUNNING
Vuser 2:Processing 10000000 transactions with output suppressed...
Vuser 3:RUNNING
Vuser 3:Processing 10000000 transactions with output suppressed...
Vuser 1:8 ...,
Vuser 1:9 ...,
Vuser 1:10 ...,
Vuser 1:Test complete, Taking end AWR snapshot.
Vuser 1:End Snapshot 19 taken at 10 MAY 2021 09:17 of instance RAZCDB1 (1) of database RAZCDB1 (171153594)
Vuser 1:Test complete: view report from SNAPID 18 to 19
Vuser 1:2 Active Virtual Users configured
Vuser 1:TEST RESULT : System achieved 13607 NOPM from 28559 Oracle TPM
Vuser 1:FINISHED SUCCESS
Vuser 2:FINISHED SUCCESS
Vuser 3:FINISHED SUCCESS
Vuser 2:FINISHED SUCCESS
Vuser 3:FINISHED SUCCESS
Vuser 3:FINISHED SUCCESS
ALL VIRTUAL USERS COMPLETE
Vuser 2:FINISHED SUCCESS
Replica workload complete and calling exit from primary
Lost connection to : 20182 razorbill.home because target application died or connection lost
Vuser 3:FINISHED SUCCESS
ALL VIRTUAL USERS COMPLETE
Vuser 3:FINISHED SUCCESS
ALL VIRTUAL USERS COMPLETE
Vuser 2:FINISHED SUCCESS
ALL VIRTUAL USERS COMPLETE
Vuser 2:FINISHED SUCCESS
ALL VIRTUAL USERS COMPLETE
Replica workload complete and calling exit from primary
Lost connection to : 20181 razorbill.home because target application died or connection lost
Replica workload complete and calling exit from primary
Lost connection to : 20183 razorbill.home because target application died or connection lost
Replica workload complete and calling exit from primary
Lost connection to : 20184 razorbill.home because target application died or connection lost
Primary complete
deleting port_file /tmp/hdbcallback.tcl
Step workload complete
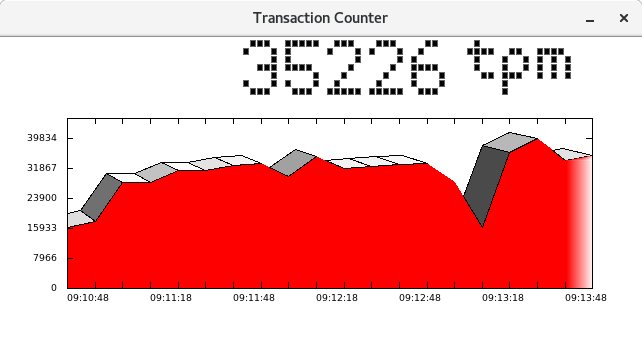
Monitoring the workload enables you to see the variation and the impact of starting additional instances against the same database over time.
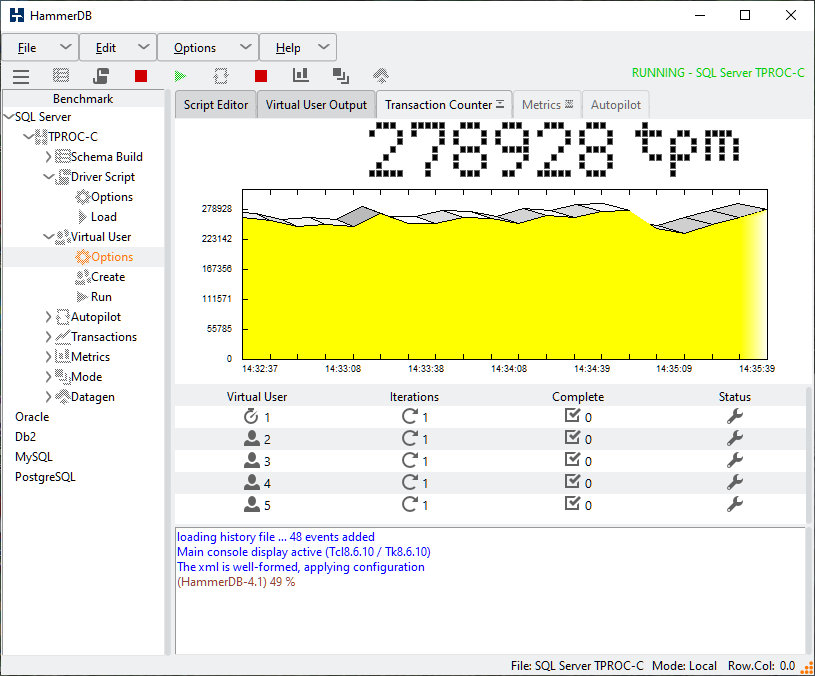
Oracle Transaction Counter
Step workloads enable you to configure complex Virtual User configurations to see how your database responds to changes in load over time.
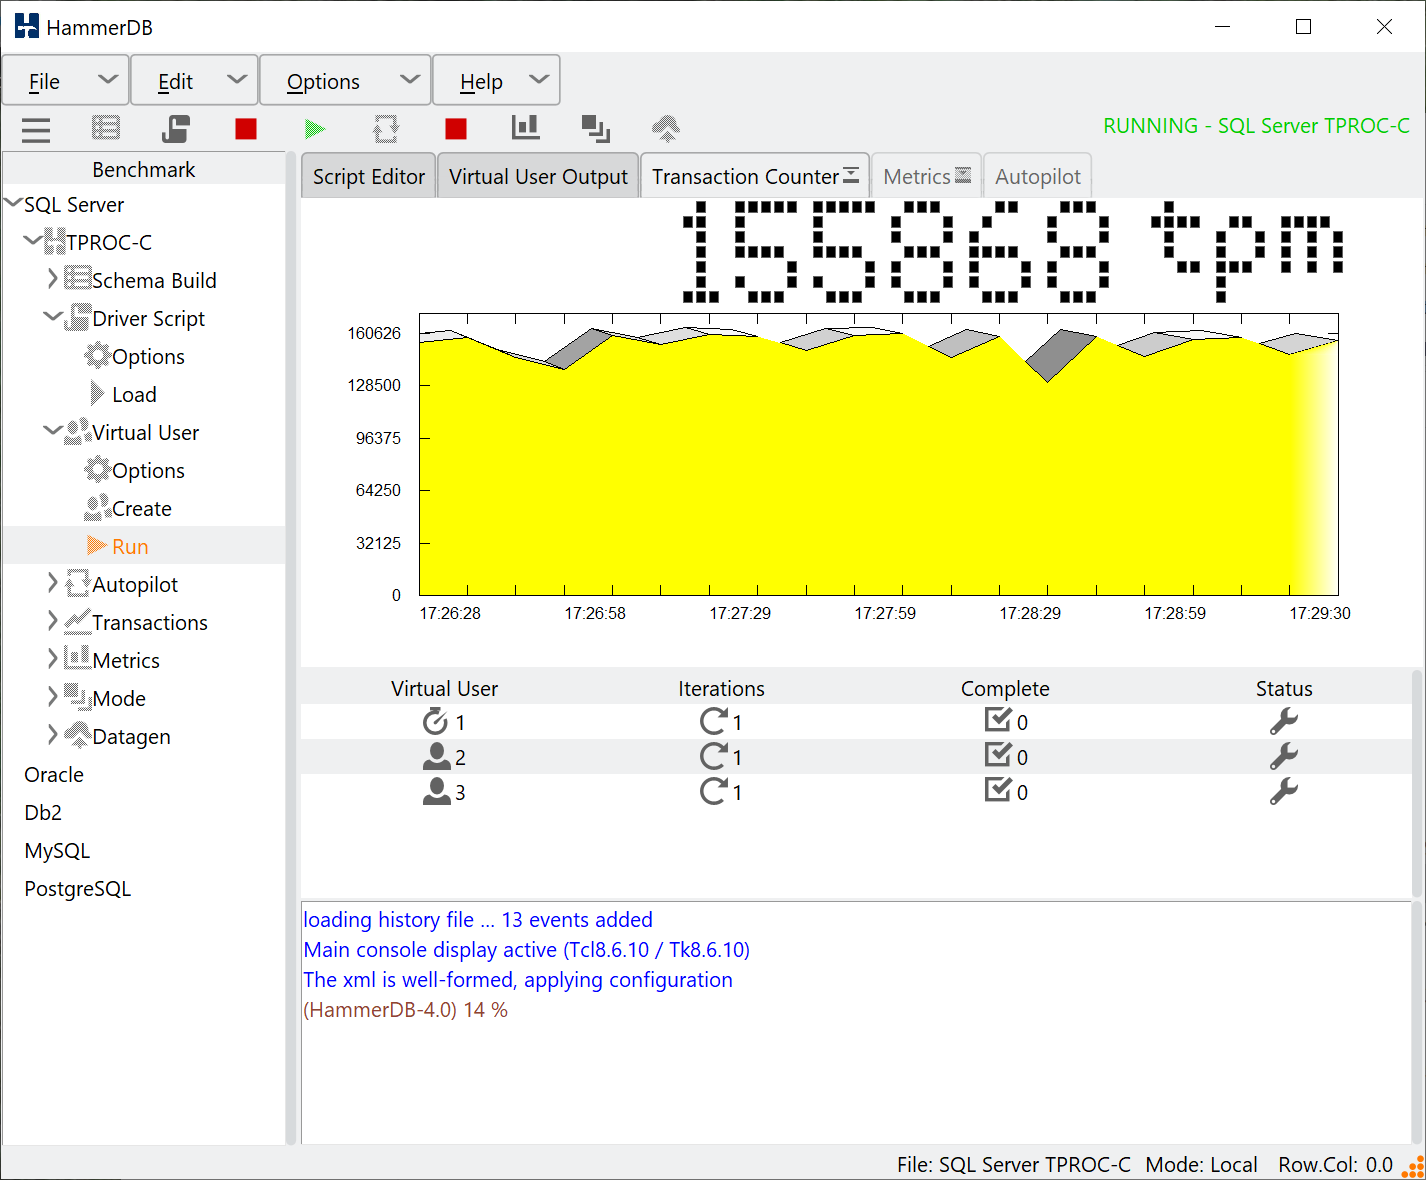
Prior to v4.1 HammerDB has featured a graphical transaction counter, this enables you to see the transaction rate taking place on the database during the test. The transaction counter is designed not to be intrusive on the schema being tested. It also enables you to verify that the transaction rate reported at the end of the test is consistent throughout without peaks and troughs in the graph that would indicate bottlenecks due to configuration issues.
GUI Transaction Counter
From v4.1 HammerDB also features a transaction counter in the CLI. Similarly to the GUI transaction counter the CLI one also runs in a separate thread to be non-intrusive to main workload. To configure the CLI transaction counter use the tcset command with the same options available in the GUI. The transaction counter can then be started with tcstart, stopped with tcstop and queried with tcstatus.
hammerdb>help tcset
tcset - Usage: tcset [refreshrate|logtotemp|unique|timestamps]
Configure the transaction counter options. Equivalent to the Transaction Counter Options window in the graphical interface.

hammerdb>help tcstart
tcstart - Usage: tcstart
Starts the Transaction Counter.

hammerdb>help tcstatus
status - Usage: tcstatus
Checks the status of the Transaction Counter.

hammerdb>help tcstop
tcstop - Usage: tcstop
Stops the Transaction Counter.
An example test script is shown including the transaction counter commands.
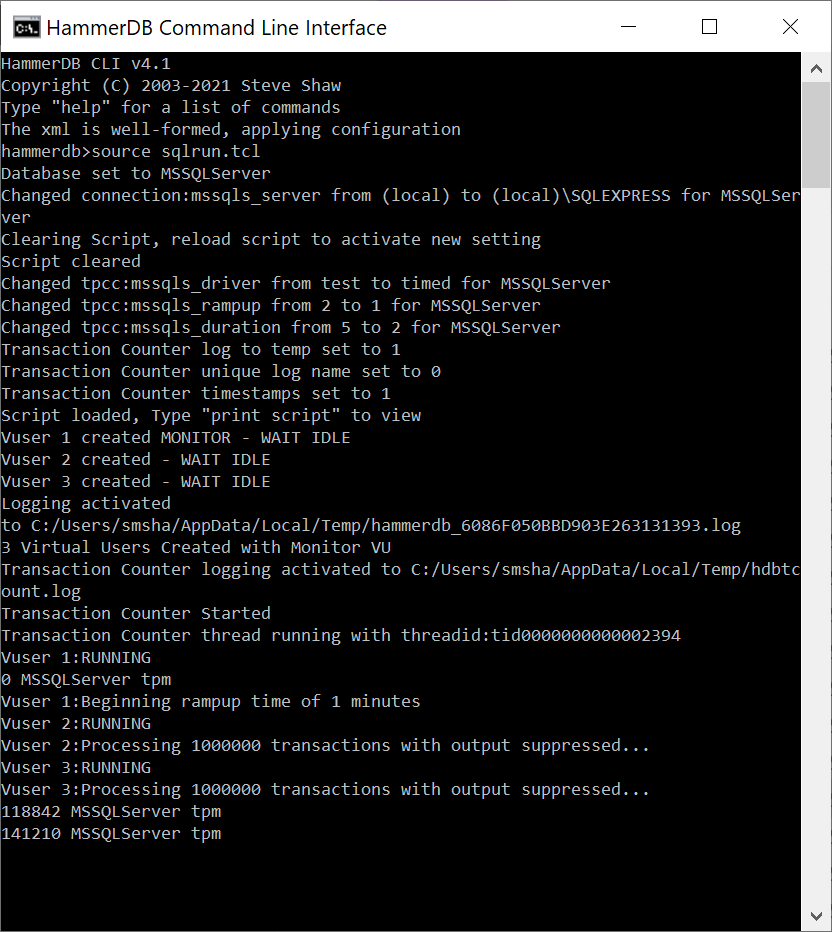
When we run the script we have now activated the transaction counter to run throughout the test.
hammerdb>source sqlrun.tcl
Database set to MSSQLServer
Changed connection:mssqls_server from (local) to (local)\SQLDEVELOP for MSSQLServer
Clearing Script, reload script to activate new setting
Script cleared
Changed tpcc:mssqls_driver from test to timed for MSSQLServer
Changed tpcc:mssqls_rampup from 2 to 1 for MSSQLServer
Changed tpcc:mssqls_duration from 5 to 2 for MSSQLServer
Transaction Counter log to temp set to 1
Transaction Counter timestamps set to 1
Script loaded, Type "print script" to view
Vuser 1 created MONITOR - WAIT IDLE
Vuser 2 created - WAIT IDLE
Vuser 3 created - WAIT IDLE
Vuser 4 created - WAIT IDLE
Vuser 5 created - WAIT IDLE
Logging activated
to C:/Users/Steve/AppData/Local/Temp/hammerdb.log
5 Virtual Users Created with Monitor VU
Transaction Counter logging activated to C:/Users/Steve/AppData/Local/Temp/hdbtcount.log
Transaction Counter Started
Transaction Counter thread running with threadid:tid0000000000002F88
Vuser 1:RUNNING
0 MSSQLServer tpm
Vuser 1:Beginning rampup time of 1 minutes
Vuser 2:RUNNING
Vuser 2:Processing 1000000 transactions with output suppressed...
Vuser 3:RUNNING
Vuser 3:Processing 1000000 transactions with output suppressed...
Vuser 4:RUNNING
Vuser 4:Processing 1000000 transactions with output suppressed...
Vuser 5:RUNNING
Vuser 5:Processing 1000000 transactions with output suppressed...
238182 MSSQLServer tpm
261366 MSSQLServer tpm
251310 MSSQLServer tpm
255102 MSSQLServer tpm
252180 MSSQLServer tpm
Vuser 1:Rampup 1 minutes complete ...
Vuser 1:Rampup complete, Taking start Transaction Count.
Vuser 1:Timing test period of 2 in minutes
228408 MSSQLServer tpm
Timer: 1 minutes elapsed
267666 MSSQLServer tpm
248466 MSSQLServer tpm
283332 MSSQLServer tpm
270900 MSSQLServer tpm
242988 MSSQLServer tpm
Vuser 1:1 ...,
246384 MSSQLServer tpm
Timer: 2 minutes elapsed
255042 MSSQLServer tpm
275712 MSSQLServer tpm
260112 MSSQLServer tpm
258246 MSSQLServer tpm
243798 MSSQLServer tpm
Vuser 1:2 ...,
Vuser 1:Test complete, Taking end Transaction Count.
Vuser 1:4 Active Virtual Users configured
Vuser 1:TEST RESULT : System achieved 112009 NOPM from 257938 SQL Server TPM
Vuser 1:FINISHED SUCCESS
Vuser 3:FINISHED SUCCESS
Vuser 2:FINISHED SUCCESS
Vuser 5:FINISHED SUCCESS
Vuser 4:FINISHED SUCCESS
ALL VIRTUAL USERS COMPLETE
runtimer returned after 178 seconds
235392 MSSQLServer tpm
vudestroy success
Transaction Counter thread running with threadid:tid0000000000002F88
Stopping Transaction Counter
Closed Transaction Counter Log
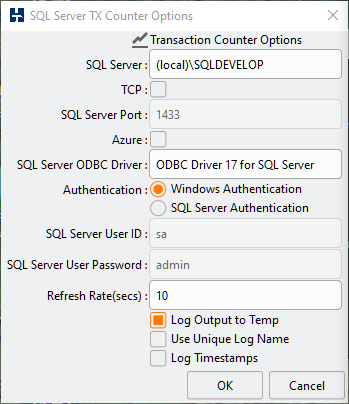
It should also be noted that we now have the option to record the output of the transaction counter to a new log file called hdbtcount.log. We also have the option of giving this file a unique log name and adding timestamps to each line of output. The following shows the contents in the logfile from the previous test.
This option to record the transaction counter output is not only available in the CLI, it has also been added to the GUI with a checkbox option of Log Output to Temp with the same additional options as the CLI to use a unique log name and add timestamps.
GUI Log Transaction Counter
Adding the Transaction Counter to the CLI and Transaction Counter Logging to both GUI and CLI enables you to record the transaction rate during the test to ensure that the rates are consistent throughout the test without significant variance around your test result.
Up to HammerDB v4.0 you have had the ability to do time profiling for the first Active Virtual User only. This post showed you how to graph the transaction response times using this package called etprof. v4.1 enhances time profiling by introducing a new package called xtprof that enables you to capture timing data for all Active Virtual Users simultaneously. This post will get you started with time profiling in v4.1.
Time profiling of a workload is the process of capturing transaction response times. Response times give us multiple insights beyond just transaction rates in the form of NOPM and TPM. NOPM shows us the new orders per minute so the number of new order transactions only. TPM shows us the user commits and user rollbacks across the whole database, however with both values we are recording the average transaction rate across a minute. With the transaction counter this shows us how even this transaction rate is across the measured time, however time profiling enables a much finer granular view on the workload of each Virtual User.
Within the TPROC-C workload there is a transaction mix of neword 45%, payment 43%, delivery 4%, order status 4%, stock level 4%. The transaction to run is selected according to this mix and NOPM records only 45% of this mix. Note that for example New Order is called 45% of the time however the actual time ratio attributed to the transaction could be longer or shorter.
So using the test workload as an example for a single Virtual User they will run a sequence of transactions such as follows.
Vuser 1:order status
Vuser 1:payment
Vuser 1:payment
Vuser 1:new order
Vuser 1:new order
Vuser 1:new order
Vuser 1:stock level
Vuser 1:new order
Vuser 1:payment
Vuser 1:payment
Vuser 1:payment
Vuser 1:new order
Vuser 1:payment
Vuser 1:payment
Vuser 1:order status
Vuser 1:new order
Vuser 1:new order
Vuser 1:payment
Vuser 1:new order
Vuser 1:delivery
Looking at this single Virtual User if for example the Stock Level or Order Status transactions takes longer, then it should be clear they are going to be able to run fewer New Orders in a minute because while they are running other transactions they are not recording any New Order transactions.
However, it is in most cases not just one Virtual User, instead it is tens, hundreds or thousands running at the same time and the database is managing the concurrency between them. Stock Level for example is querying the district, stock and order_line tables so while other virtual users are inserting and updating these tables with New Order and Payment or deleting with Delivery, Stock Level is doing a longer running query with locks and multiversioning to ensure that the data is consistent. A very basic database approach for Stock Level would be to lock the tables to ensure consistency, however doing this would block any other transactions from running until Stock Level was complete resulting in low performance overall. This is the very design of TPC-C specification in that the transactions are intended to do inserts, updates, deletes and queries on the data at the same time to test how well the database engine can manage the concurrency. Time profiling can give you a deeper insight into how well this is managed.
To begin using extended profiling view the settings in the generic.xml file in the config directory. From v4.1 the default profiler will be the newer xtprof, however this can be changed back to etprof to use the earlier single Virtual User profiler. As xtprof profiles all Virtual Users output now gets written to a dedicated log file and therefore there is the option of whether a unique log name is required, 0 for a regular filename and 1 for a unique id.
With the profiler setting set to xtprof HammerDB will use the new profiler automatically enabling it for all Virtual Users when selected.
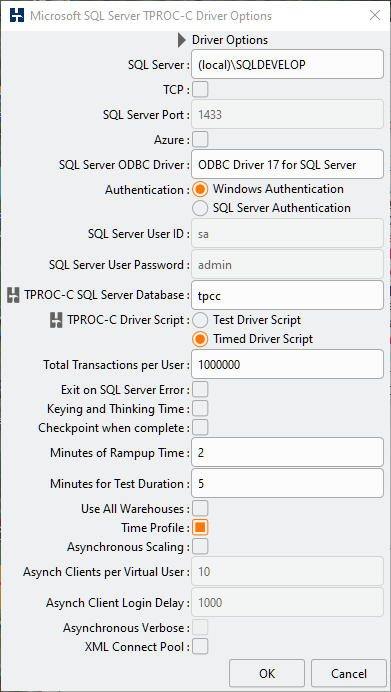
To enable time profiling when configuring the driver script select the time profiling option.
Time Profile Option
In the CLI set the timeprofile option to true.
hammerdb>diset tpcc mssqls_timeprofile true
Changed tpcc:mssqls_timeprofile from false to true for MSSQLServer
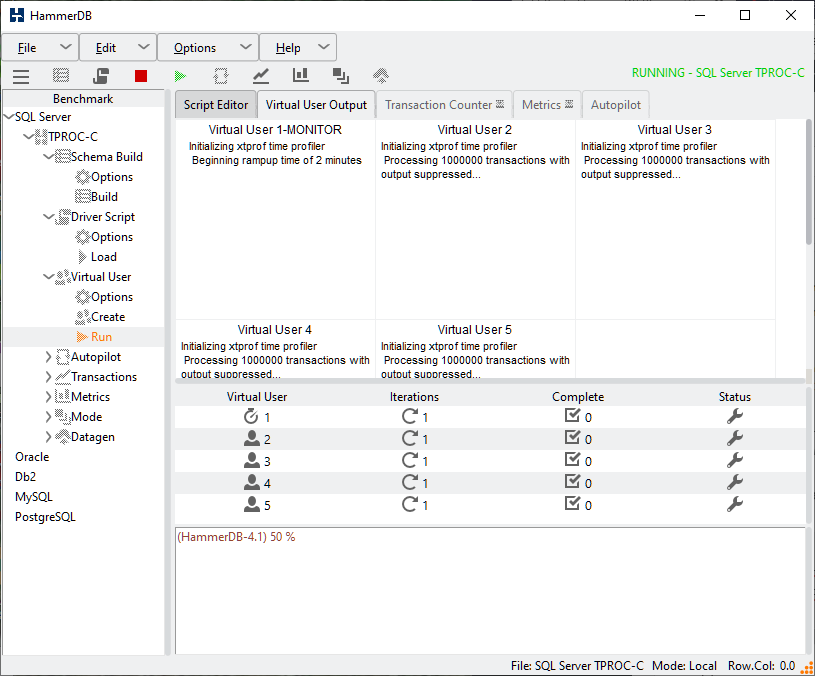
When running a workload you will now see a message “Initializing xtprof time profiler” in all Virtual Users. Note that the package initializes in the Monitor Virtual User also as all data is gathered, processed and reported by the Monitor.
Time Profiling Started
When the workload is complete after reporting the NOPM/TPM the Monitor Virtual User will report messages on Gathering timing data/Calculating timings and Writing timing data to an external logfile to mark the separate stages of gathering and processing the data.
In the logfile there is a report of the timings for all of the Active Virtual Users followed by a summary of the cumulative data.
In the report the values have the following meaning with all timings in milliseconds.
Value
Description
CALLS
Number of times that the stored procedure was called.
MIN
Minimum response time in milliseconds.
AVG
Average response time in milliseconds.
MAX
Maximum response time in milliseconds.
TOTAL
Total time spent in that stored procedure during the measuring interval. The total time will include both rampup and timed test times.
P99
99th percentile in milliseconds.
P95
95th percentile in milliseconds.
P50
50th percentile in milliseconds.
SD
Standard Deviation showing variance in captured values.
RATIO
Ratio showing percentage time taken for that stored procedure. The total of these values may be less than 100% as only timings for the stored procedures are shown.
Some key observations are to note that time profiling begins immediately for each Virtual User and includes both rampup and timed durations. For this reason by default the captured time for the first Virtual User will be longer than the second and so on because there is a pause between each starting. It is a proposal to Exclude ramp up duration for time profiling #233 and this may be an enhancement for a future version. Also note that for the summary the elapsed times will be proprtionally longer than the duration of the test as it is recording the elapsed time for all Virtual Users.
Typically the key metrics you will want to observe will be P95 & P99 as this shows that 95% and 99% respectively of transactions completed inside this time. You would normally expect the total elapsed time to be in the order of NEWORD, PAYMENT, DELIVERY, SLEV, OSTAT however this may vary for some databases when higher levels of locking are experienced. Finally the SD value or standard deviation can give an indication of the variance between the recorded values. A higher variation gives an indication of less consistent transaction processing times.
Finally for advanced users comfortable with examining the HammerDB source code in the xtprof module there is the following comment as a reference point.
#At this point [dict get $monitortimings $vutr $sproc clickslist] will return all unsorted data points for vuser $vutr for stored proc $sproc
#To record all individual data points for a virtual user write the output of this command to a file
As shown in the comment at this section of the code if desired you can use the commands given to print out all individual data points for all Virtual Users for advanced plotting and analysis of timing data. This is also functionality considered for future releases beyond v4.1 and a potential area for future code contribution.
So the HammerDB project is open source. That shouldn’t come as too much of a surprise. When you install it you accept the license agreement and once installed there is a file called LICENSE headed GNU GENERAL PUBLIC LICENSE Version 3, 29 June 2007 – so you know that the code is open source under GPLv3.
It is rare these days for people downloading and using open source not to have awareness of open source etiquette and responsibilities. We all know by now that ‘Free’ software means free as in freedom and by taking you also take the responsibility to give according to your ability. This doesn’t mean that if you are not an expert programmer or developer you have nothing to contribute. To the contrary everyone downloading and using HammerDB can at a minimum contribute to Issues and Discussions on the HammerDB GitHub site or by publishing performance results.
For example if you find a bug and then create an Issue this start the conversation of what needs to be done to make the software better for everyone. On the other hand if you don’t interact or only tweet or blog about bugs then that doesn’t make the software better either for you or anyone else. Even better practice is creating an Issue and then the Pull Request to resolve it, here is just one example of good practice that typifies the open source approach.
GitHub User sravanigomatam raised the Issue Add limit clause to query10 for TPC-H Oracle #172 this correctly identified that HammerDB was missing the limit clauses in one of the TPC-H queries for Oracle that meant that this query took longer than it should. Further investigation showed that more queries were impacted by the same issue. sravanigomatam then created the Pull Request Add limit clause to TPC-H Oracle queries #186 to resolve the Issue. This fix was included in the release HammerDB v4.1 for everyone’s benefit.
If you don’t have the skills to do the Pull Request just raising an Issue you have identified can be a way to contribute to the project. Similarly, if you have a question GitHub discussions is the best place to ask HammerDB related questions to receive an informed answer. Even better is answering questions on GitHub discussions can be a way to provide your unique insights to the HammerDB community.
And if you don’t have the skills right now for Pull Requests or answering questions then everyone can contribute Ideas through Issues and Discussions or share their performance results. Of course the best way to see your idea included in HammerDB is to improve those development skills and do the Pull Request but even if you can’t then all new features start as an idea.
But what about documentation? Many open source users can be unaware that most open source project documentation is open source as well. This means you have the freedom to contribute to the documentation as well. If you feel that open source documentation is insufficient then this is a great opportunity for you to give back and improve it without programming skills.
In the case of HammerDB the documentation is published under the GNU Free Documentation License. HammerDB documentation is written in Docbook format meaning anyone can edit the documentation and submit their changes via a GitHub Pull Request to the HammerDB project.
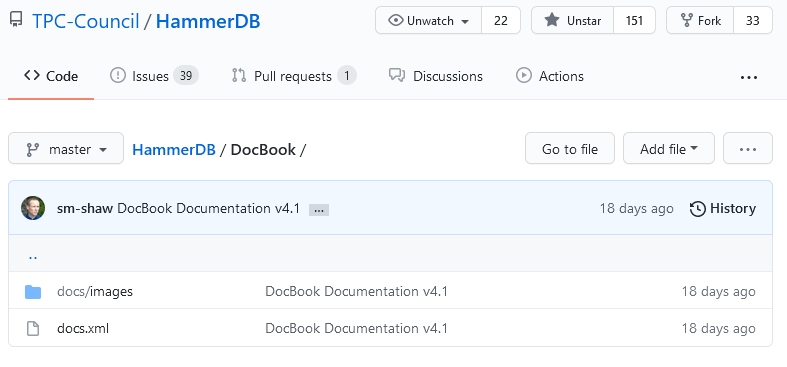
To get started go to the HammerDB project under the Docbook directory. Here you will find a docs.xml file containing the documentation in Docbook v5.1 standard and the images included in the HammerDB documentation. If you clone or download the project you will already have a copy of the documentation and images that you need to start editing.
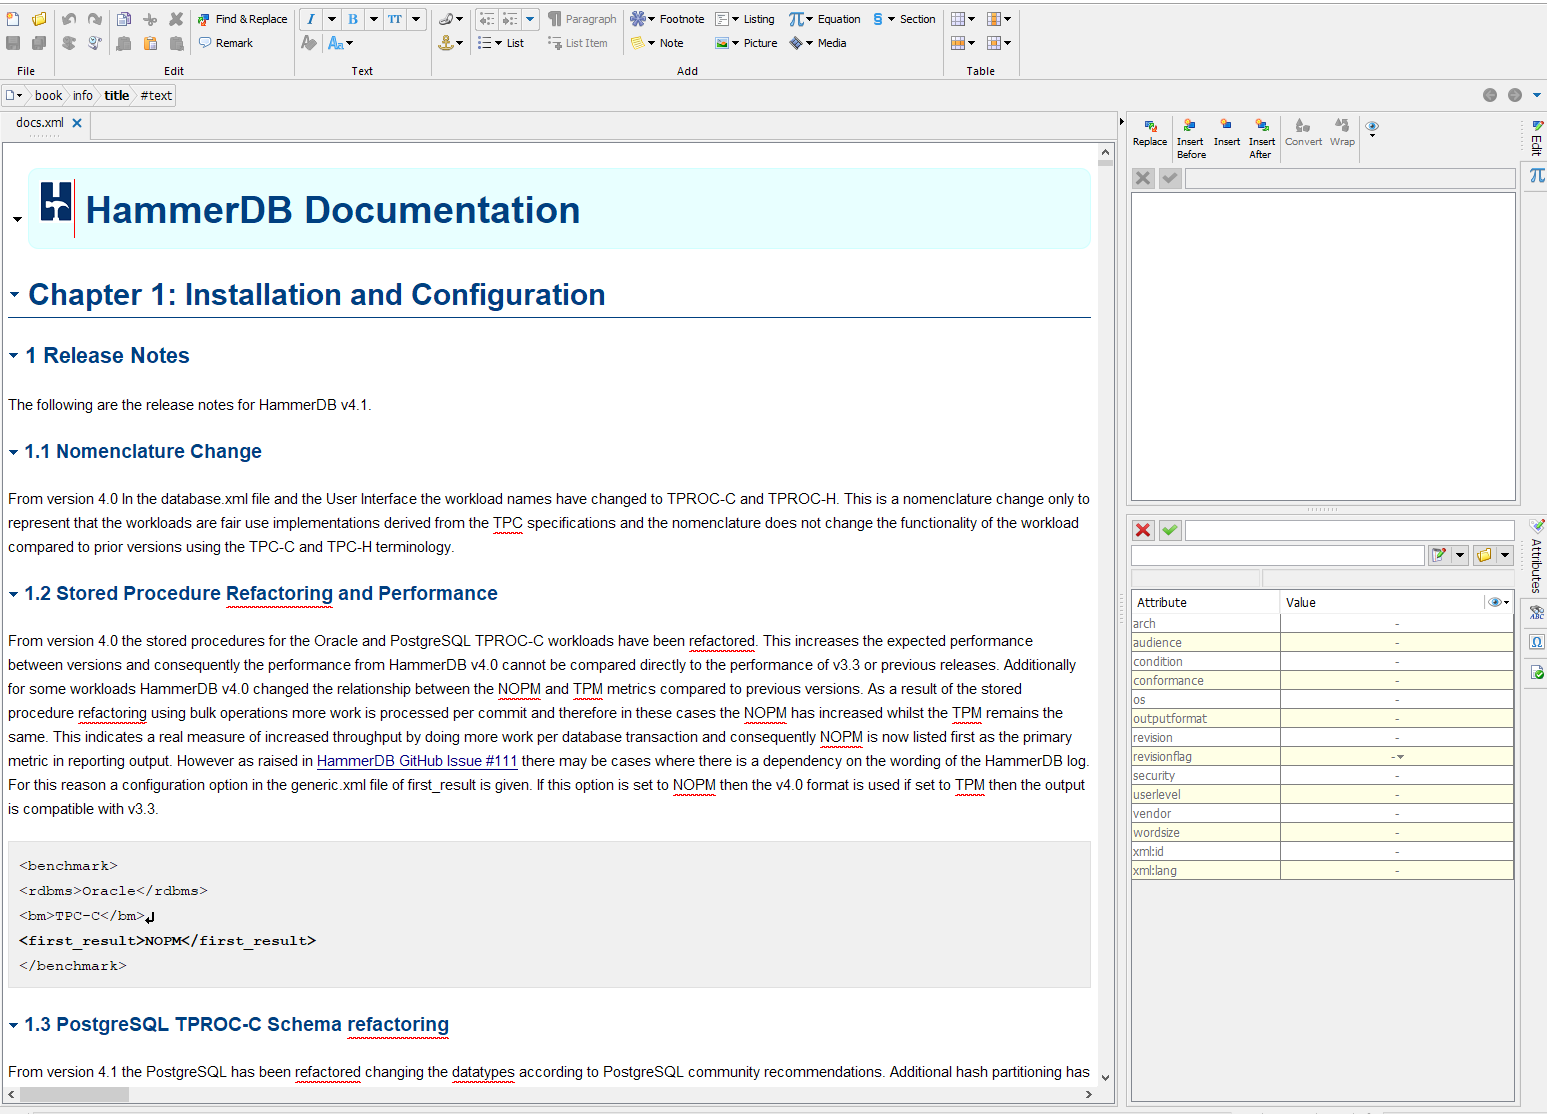
There are many Docbook editors that you can use to edit the documentation such as XMLmind Personal Edition that is free to use for open source projects. Using XMLmind as an example we have downloaded a ZIP copy of the HammerDB project extracted it and navigated to the Docbook directory. There we can open the docs.xml file and begin writing documentation.
When you have added to the docs.xml file save the contents not forgetting to include any new images in the images directory and submit a Pull Request with your changes. Once reviewed these can be converted to HTML by HammerDB and uploaded to the HammerDB website for everyone to benefit from your insights.
So if you find HammerDB useful whether writing code, raising and resolving issues, answering questions, submitting ideas or writing documentation remember that open source like any community thrives on what you give back keeping software Free for everyone’s benefit.
This post is to give anyone starting out with HammerDB a guide on using the CLI or command line interface for text based environments. As the workflow in the CLI and GUI are the same we will show equivalent commands side by side to help you quickly get up to speed on using the CLI in both interactive and scripted scenarios.
Help and Navigation
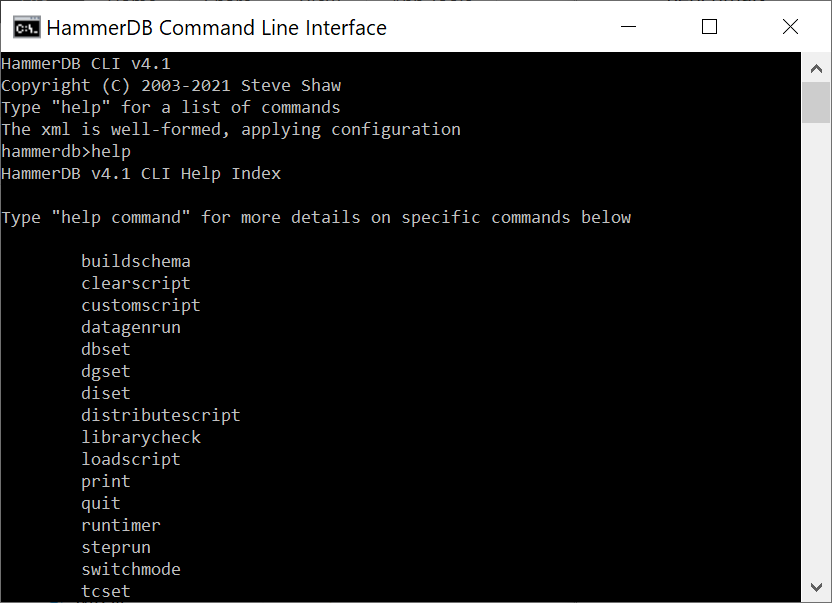
To begin with run the hammerdbcli command in Linux or hammerdbcli.bat in Windows and type help at the hammerdb prompt.
help command
This displays the available CLI commands with “help command” providing detailed information about the command and arguments required.
To navigate and edit at the CLI use the standard Ctrl commands as follows:
Ctrl Command
Action
Ctrl-P
Move to previous command
Ctrl-N
Move to next command
Ctrl-F
Move cursor forward
Ctrl-B
Move cursor backward
Ctrl-A
Move cursor to the start
Ctrl-E
Move cursor to the end
Ctrl-G
Clear Line
Ctrl-K
Cut
Ctrl-Y
Paste
Ctrl-H
Backspace
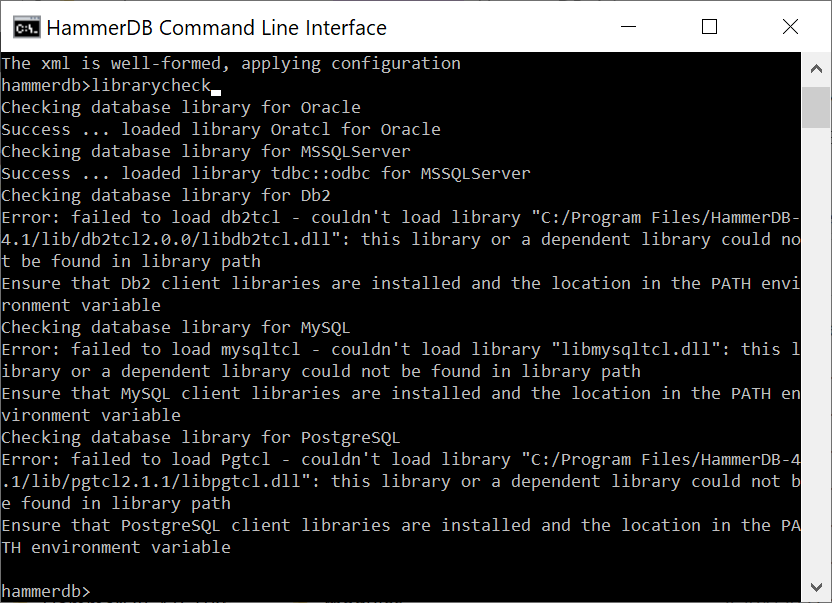
Librarycheck
One of the first things you will want to do is make sure that we can access the 3rd party driver libraries for the database that we want to use. This is done with the librarycheck command. In this example we are using SQL Server so the message shows that everything is in order and we can proceed with running tests. If the library failed to load consult the HammerDB documentation on installing and configuring your libraries with the PATH environment variable for Windows or LIBRARY_PATH environment for Linux.
librarycheck
Selecting a database
Select a database
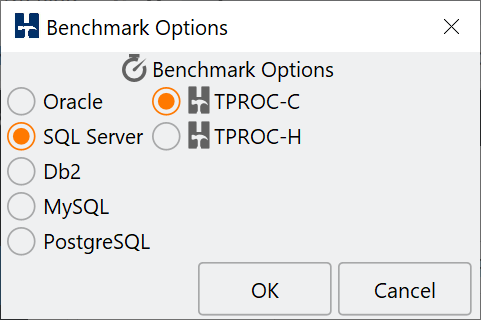
The next thing you will want to do is to select your preferred database. In the GUI we can select from the menu or double right-click the database heading.
This will show the benchmark options dialog.
Benchmark Options
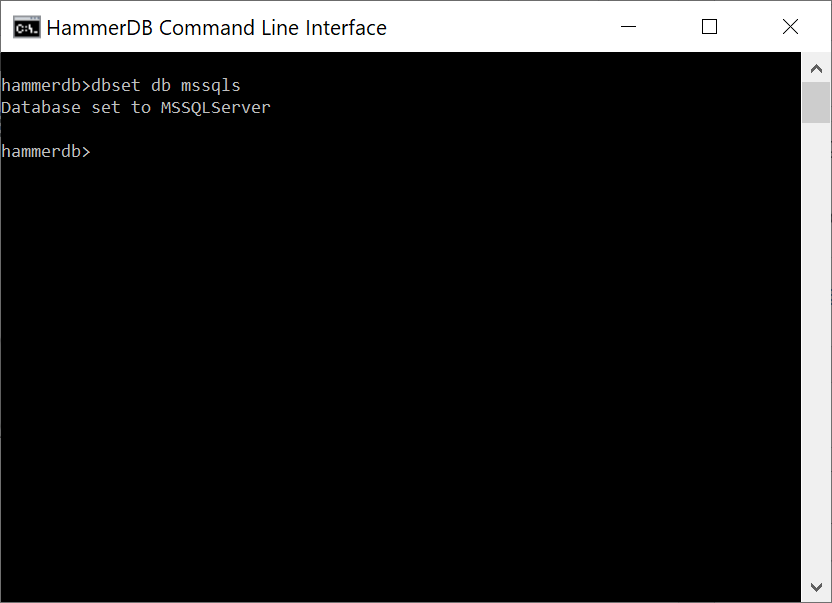
In the CLI this corresponds to the dbset command with the database set using the db argument according to the prefix in the XML configuration which are ora, mssqls, db2, mysql, pg for Oracle, Microsoft SQL Server, IBM Db2, MySQL and PostgreSQL respectively.
dbset db command
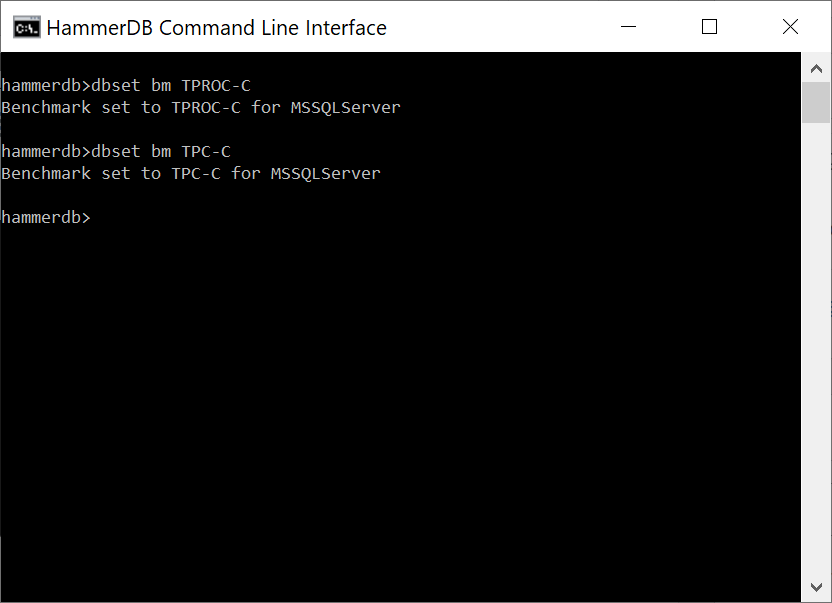
and benchmark set with the bm argument. You can use either the TPROC or TPC terminology at the CLI.
dbset bm command
Building the Schema
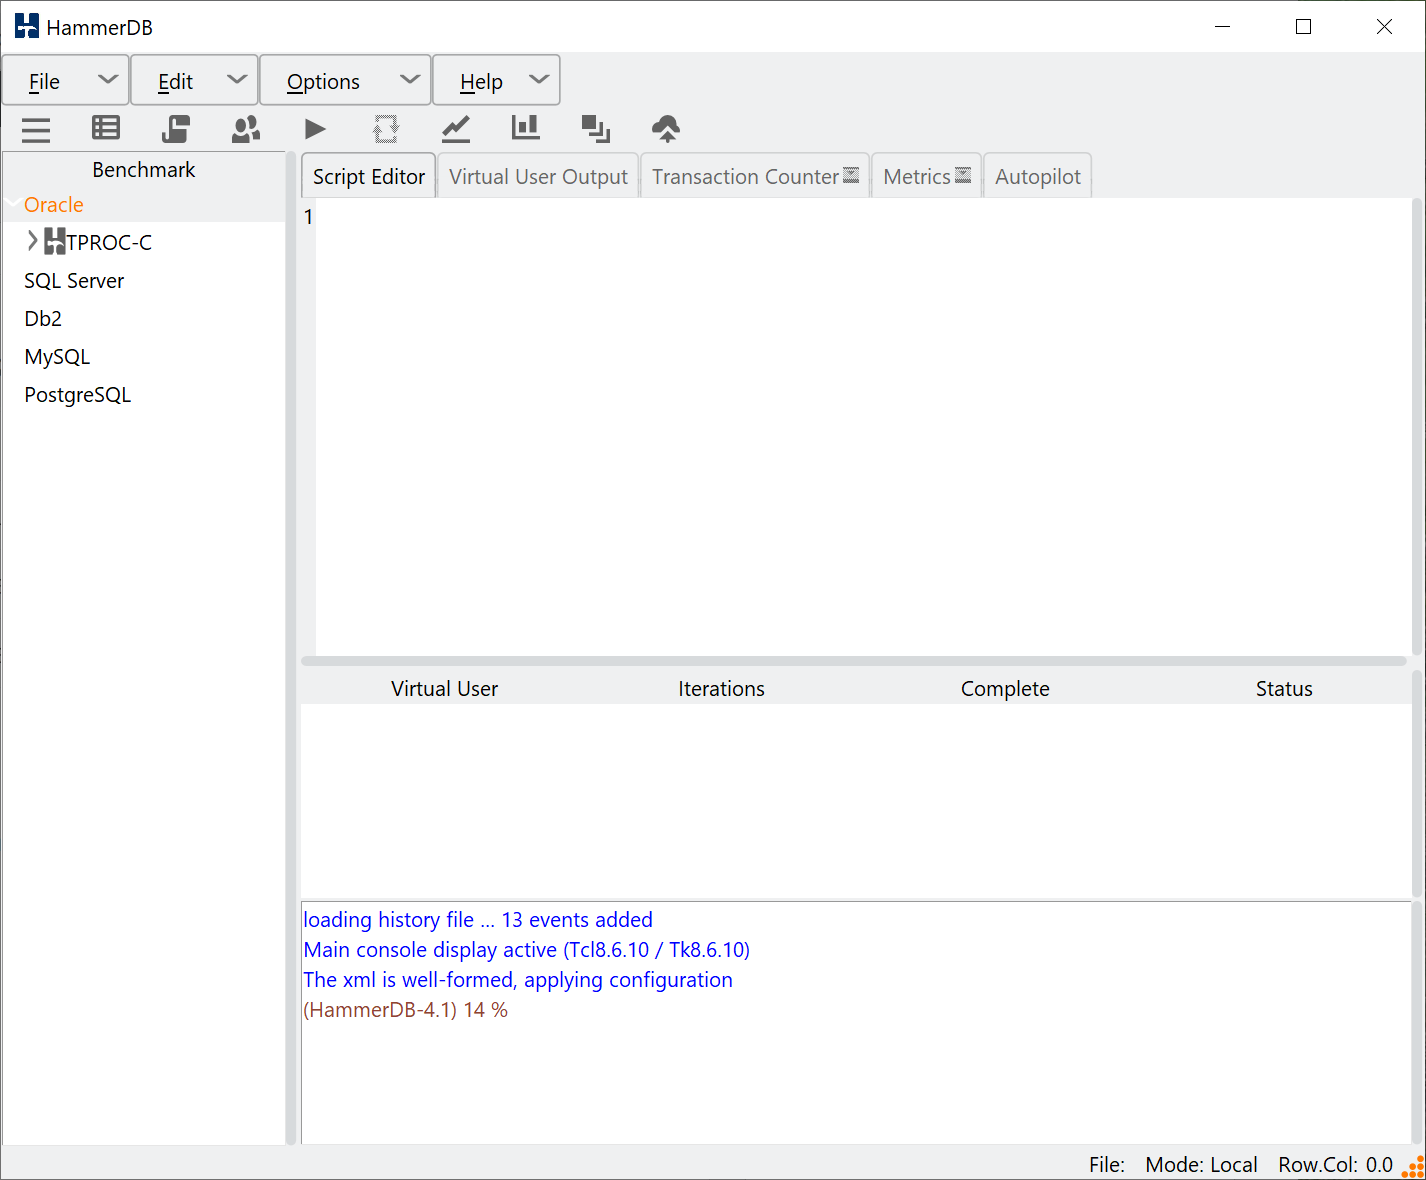
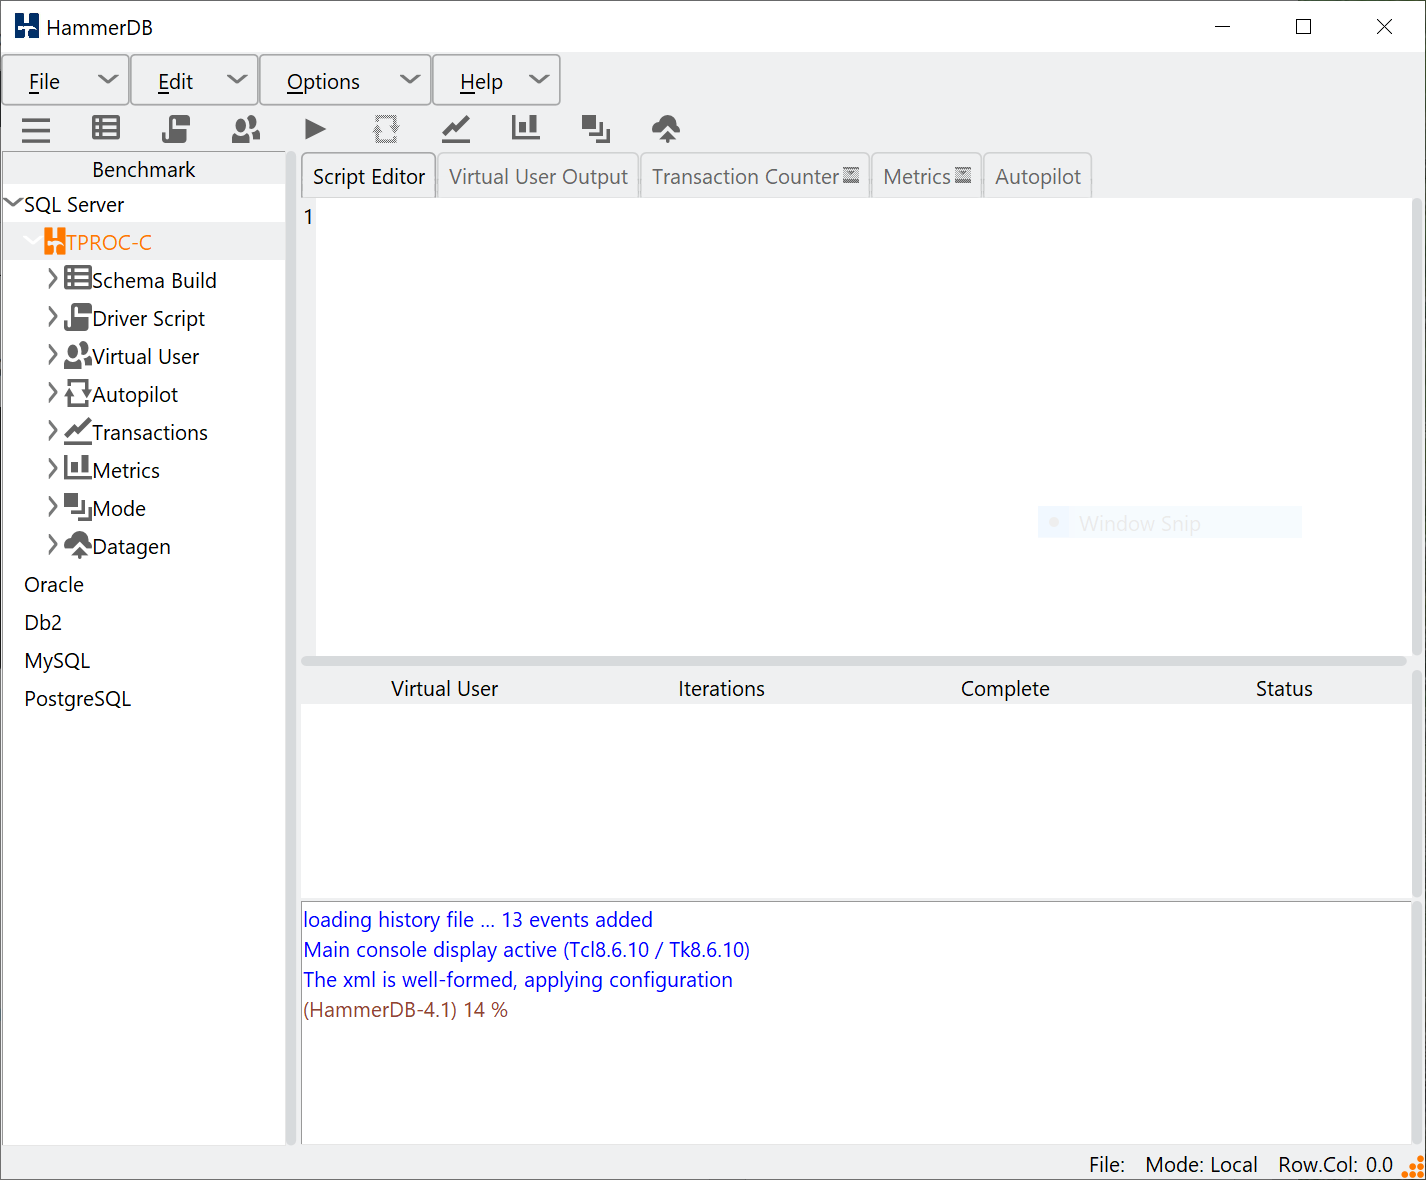
Expanding the GUI menu presents the workflow with our first task of building the schema.
GUI Workflow
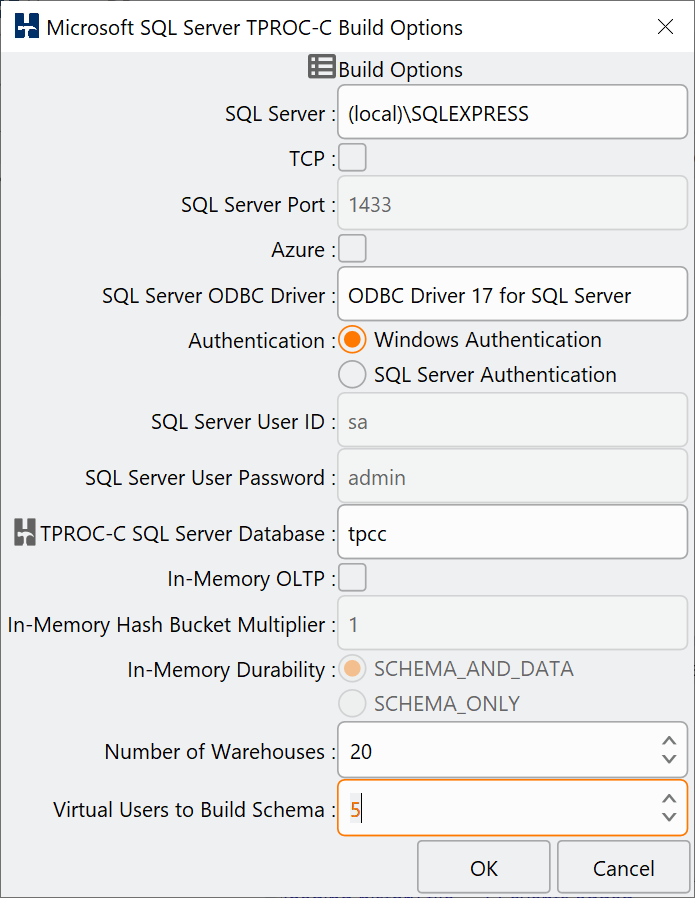
Selecting schema build and options presents the schema build options dialog. In the example below we have modified the SQL Server, number of warehouses to build and the virtual users to build them.
Build Options
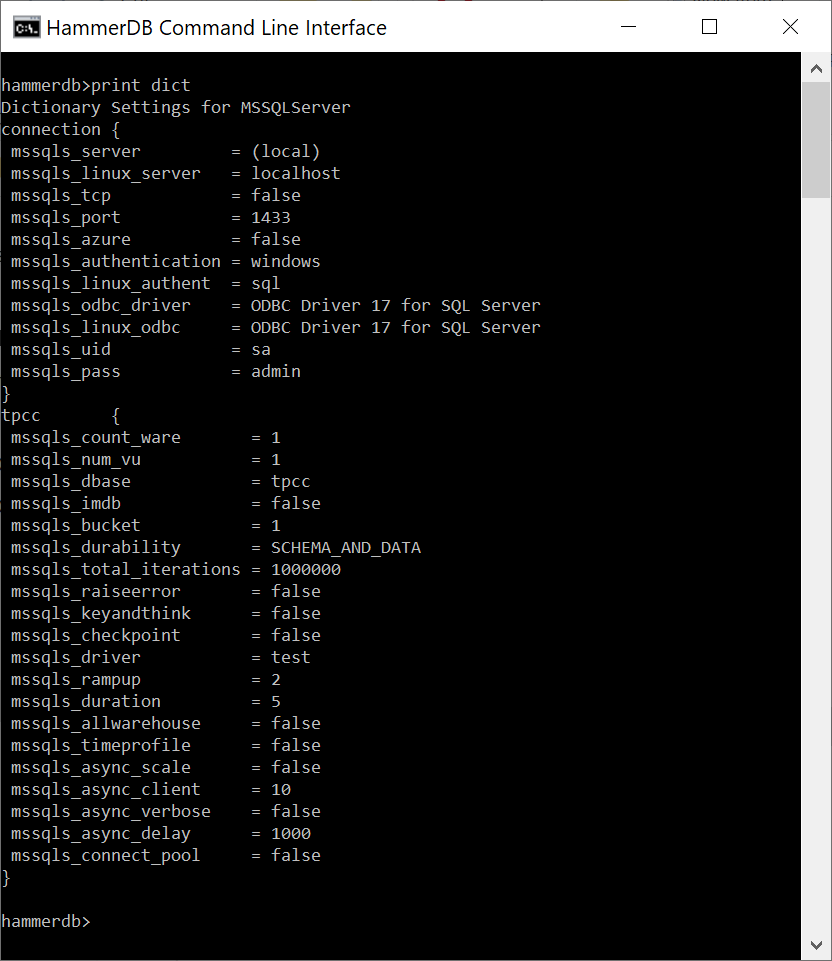
In the CLI the print dict command shows us the available options.
print dict
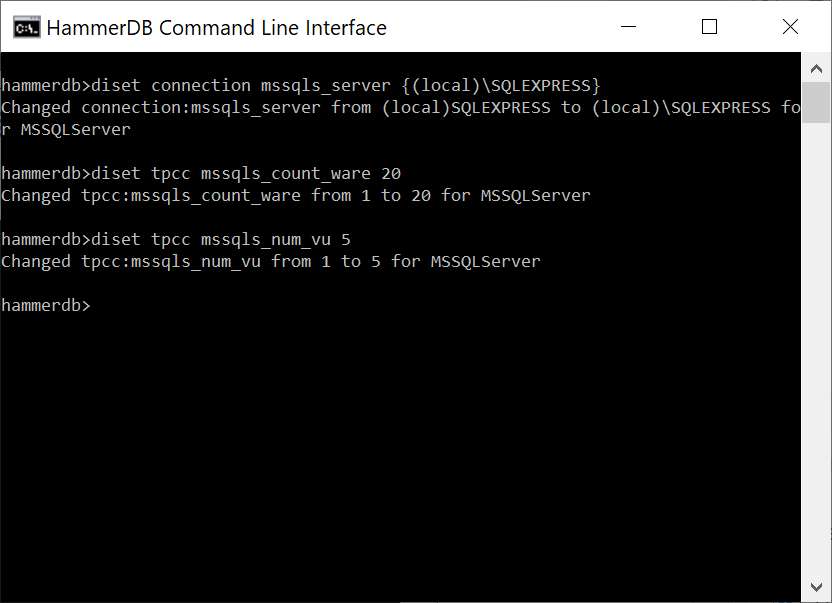
These can be modified with the diset command specifying the option and the value to be changed. The example below shows the same settings made in the GUI. We have set the connection value of mssqls_server and then the tpcc value of the warehouse count and the number of virtual users to build them. Note that for the mssqls_server value there is the backslash special character and therefore the entered value is wrapped with curly brackets {…} to preserve the special character.
diset command
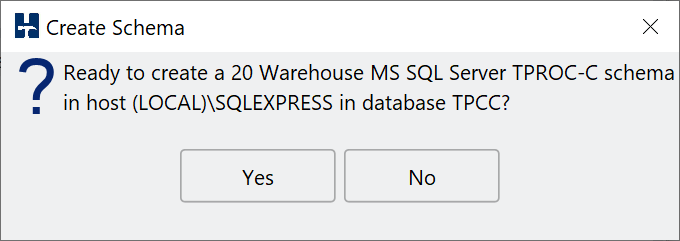
In the GUI clicking on Build presents the build dialog. Clicking yes will start the schema build.
Create Schema Dialog
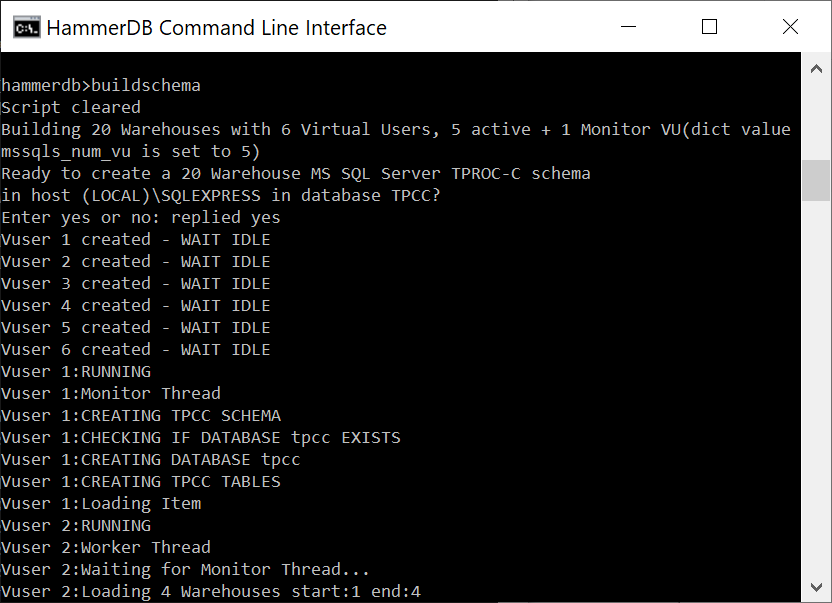
In the CLI buildschema shows the same prompt and accepts automatically.
buildschema command
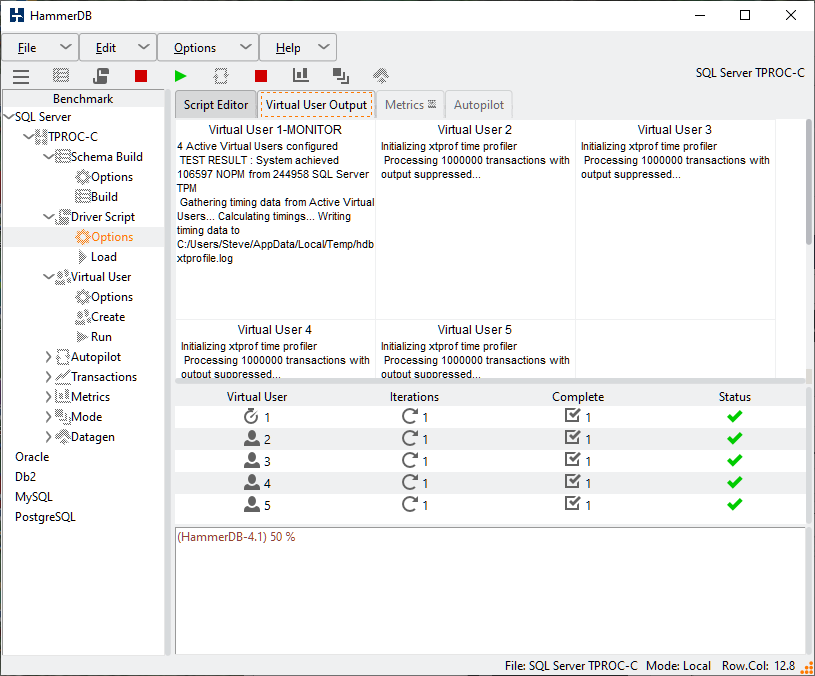
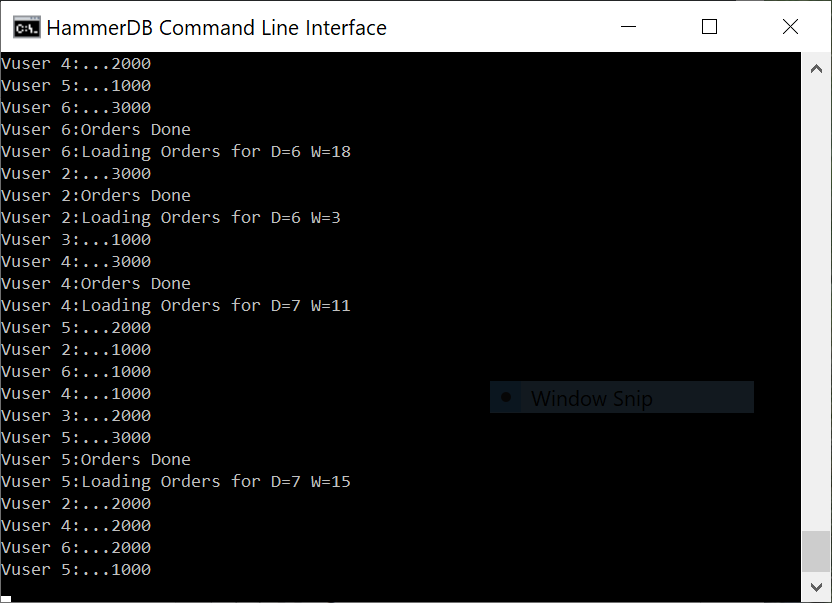
A key aspect is being able to visualise the multithreaded nature of the Virtual Users. In the GUI the Virtual User output is shown in a grid and status to a table easily enabling us to see the multithreaded nature of the workload. In the CLI all output is printed to the console preceded by the name of Virtual User producing it. Nevertheless the CLI is multithreaded in the same way as the GUI. For both the time it will take for the build to complete will depend on the HammerDB client CPU and the performance of the database server being loaded, during this time each action will be printed to the display. You may need a number of minutes for the build to complete.
Build in progress
When the build is complete Virtual User 1 will show TPCC SCHEMA COMPLETE. The schema build is the same process whether built from the GUI or the CLI.
Build Complete
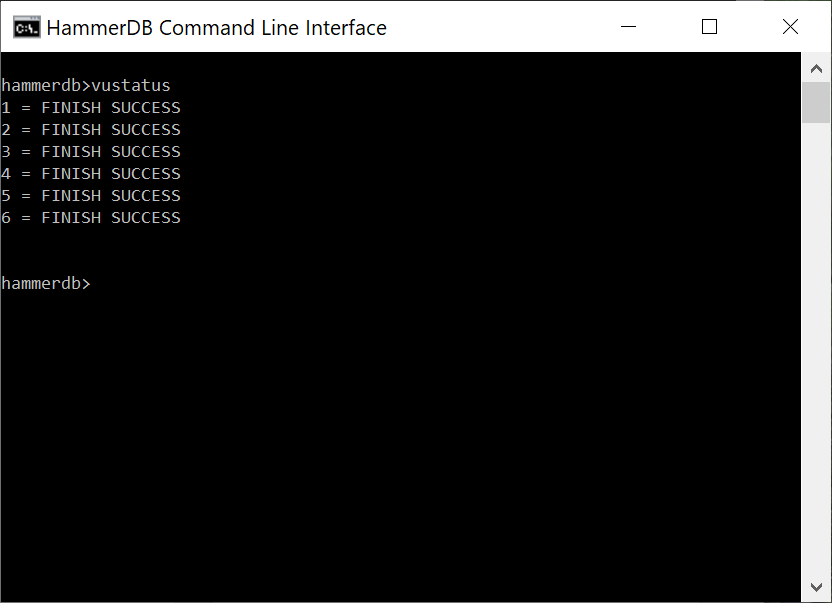
Using the vustatus command we can now see the status of the Virtual Users as having completed successfully. Note that as the CLI is running in interactive mode the vustatus command can be also be run while a workload is running. Press return for a prompt and then type the command needed. vudestroy will perform the equivalent action as pressing the stop button in the GUI to close the Virtual Users Down. Similarly doing the same while a workload is running will also do the same action as pressing the stop button while a workload is running in the GUI.
vustatus
Loading the Driver and running the test
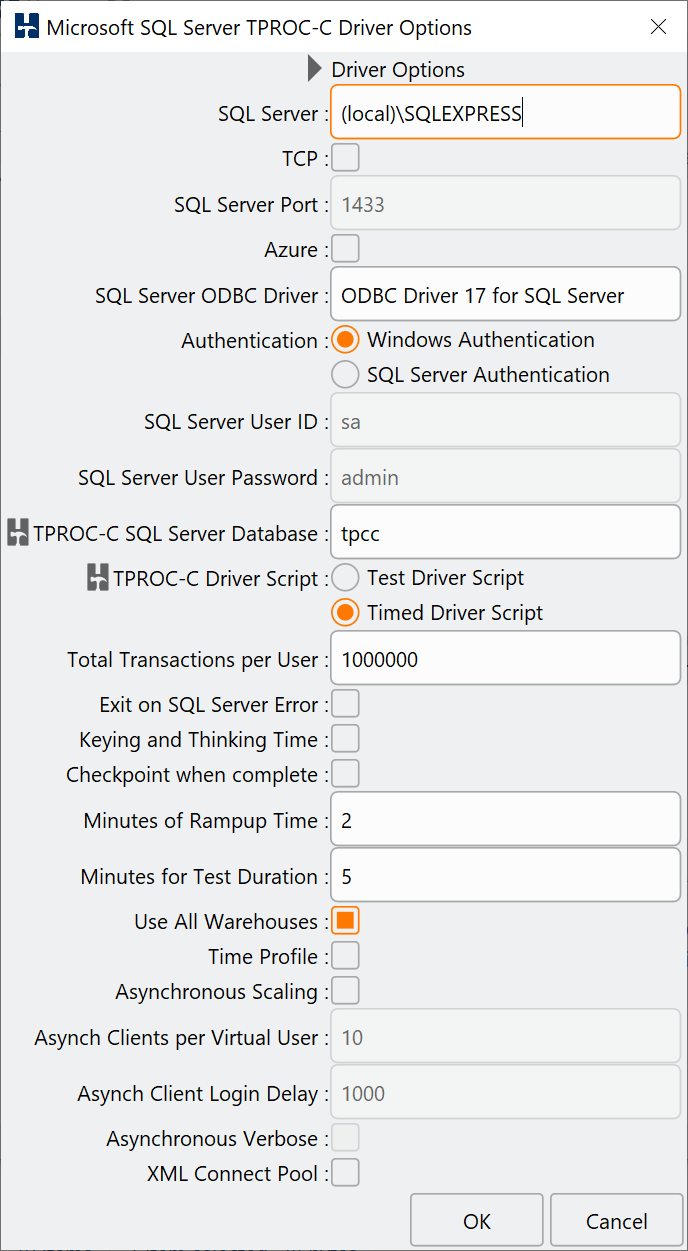
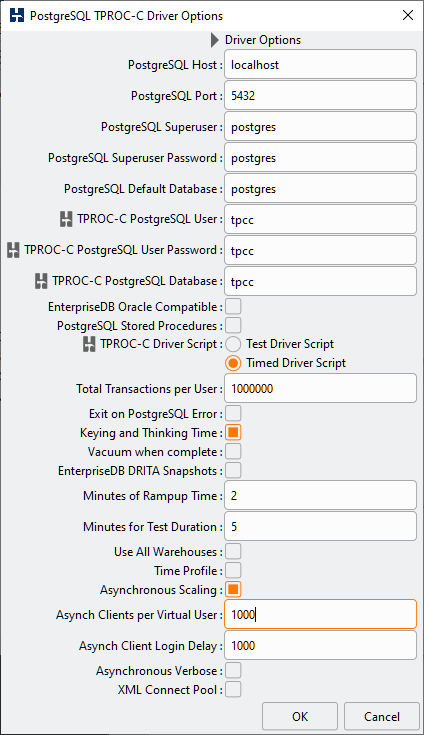
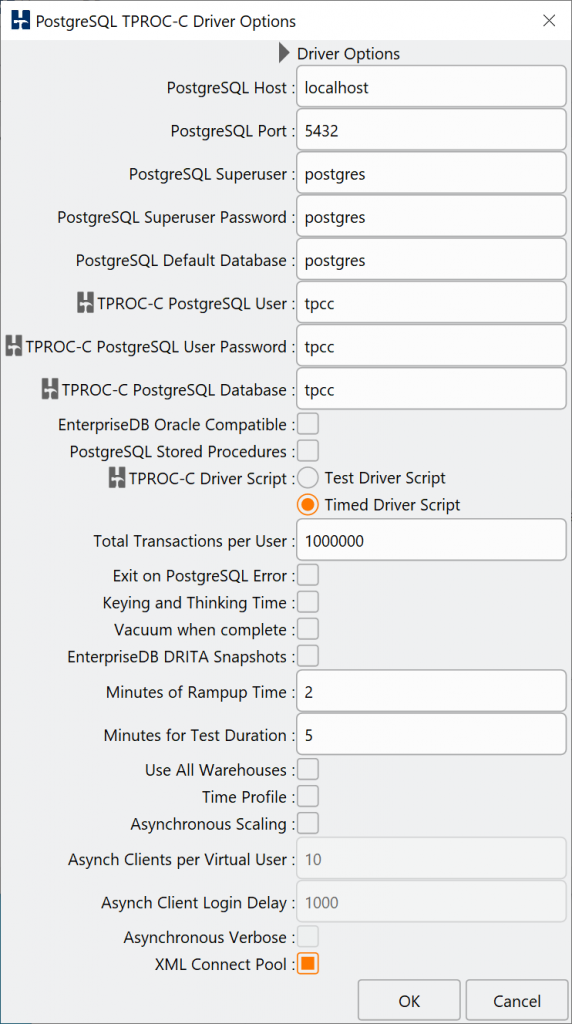
We have now built a schema. The next step in the workflow is to define the driver script options. In the GUI we are presented with an options dialog to set the configuration. In the example we have again set the server name, have chosen the timed workload and also selected the Use All Warehouses option.
GUI Driver Options
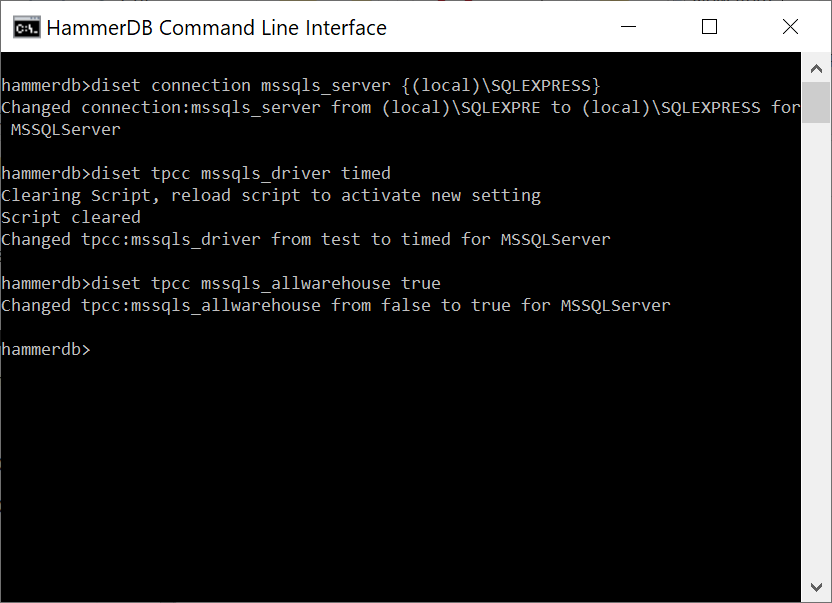
To do the same in the CLI we again use the diset command.
diset Driver Options
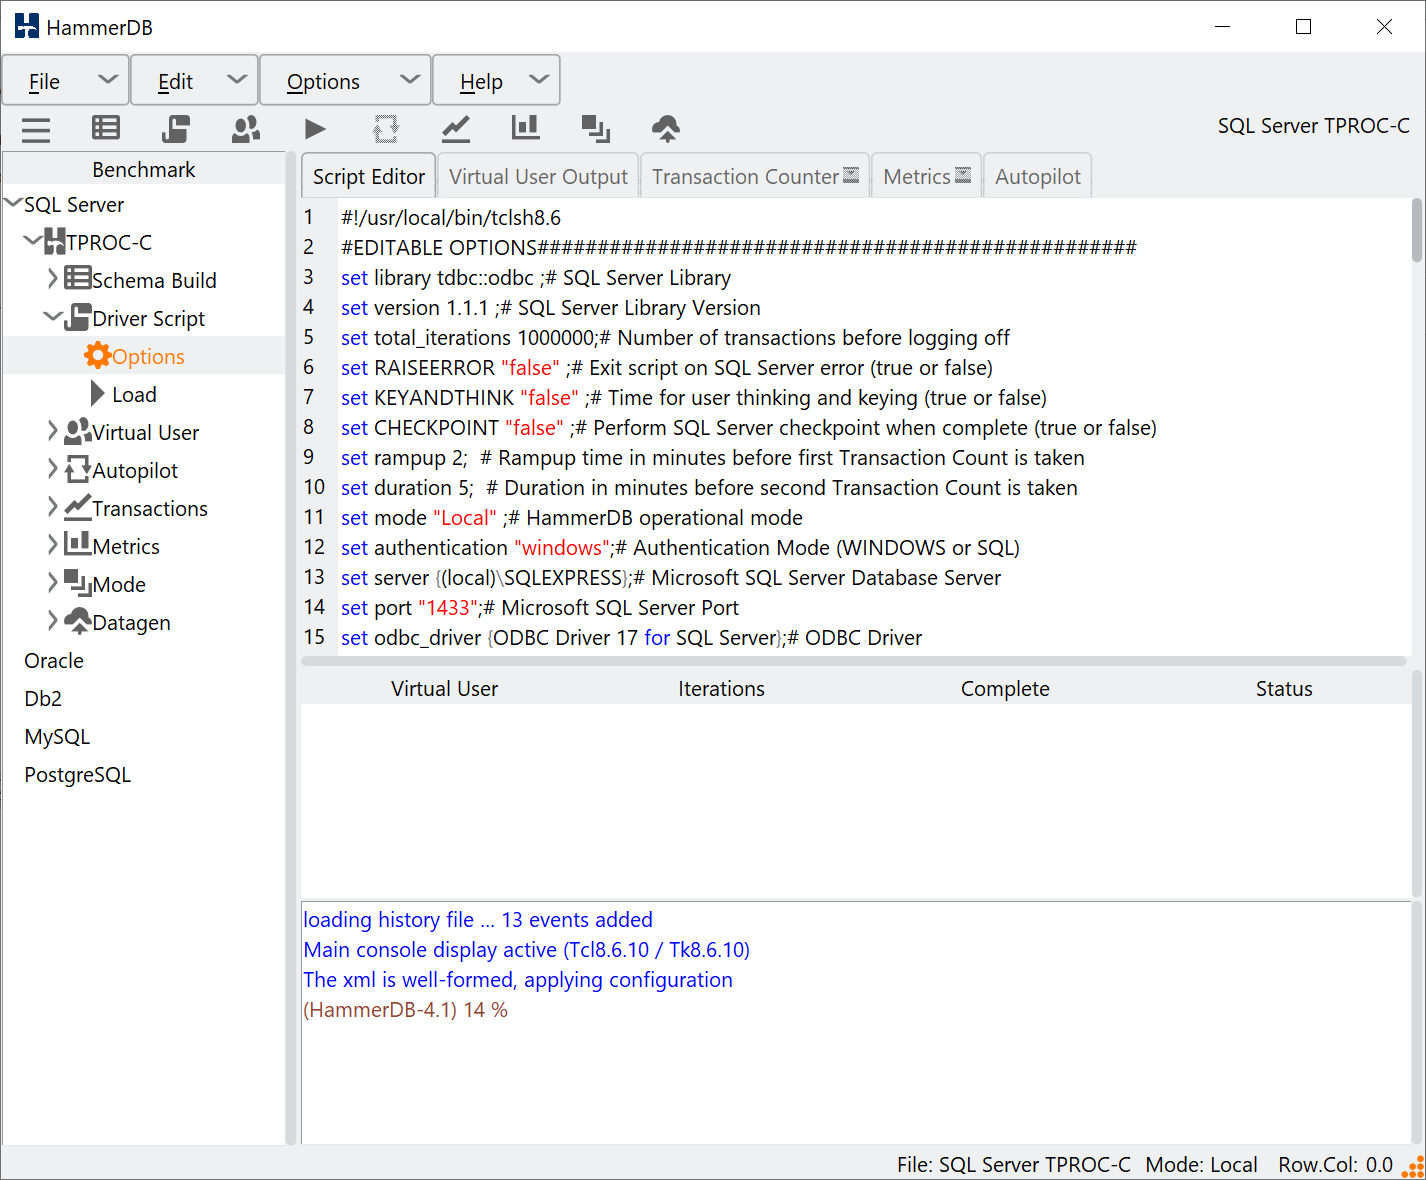
Once the options have been chosen the driver script is loaded automatically in the GUI or can be re-loaded with the Load command.
GUI Driver Script
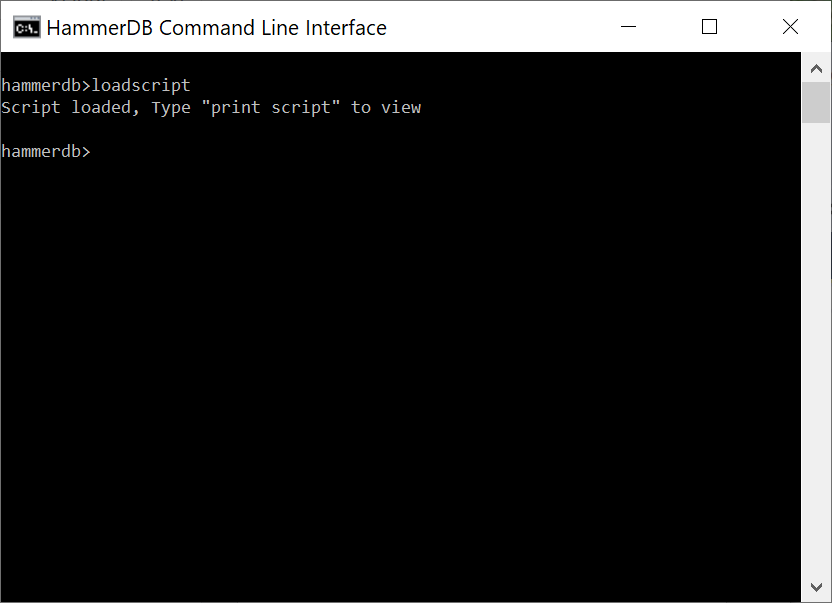
The loadscript command does the same at the CLI with the print script command showing the script loaded. Note that the driver script is identical in both the GUI and CLI (as long as you have chosen the same options) meaning that the workload that is run is also identical regardless of the interface chosen. You can also load a modified script using the customscript command meaning that you can edit a script in the HammerDB GUI save it and then load it to run in the CLI.
loadscript
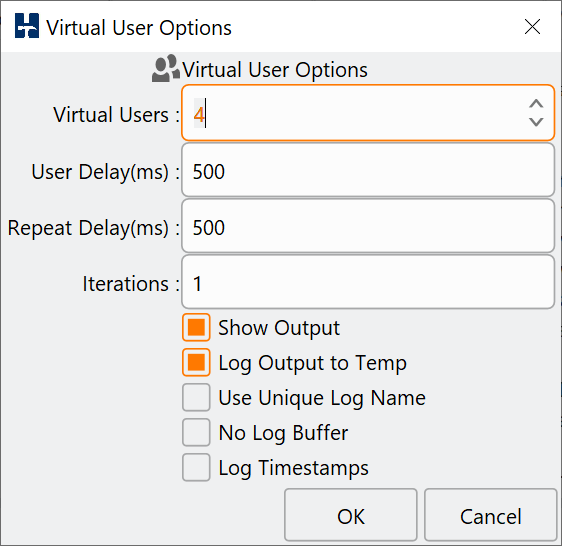
Referring back to the GUI for our workflow the next step is the creation of Virtual Users for running the driver script loaded.
GUI Virtual User Options
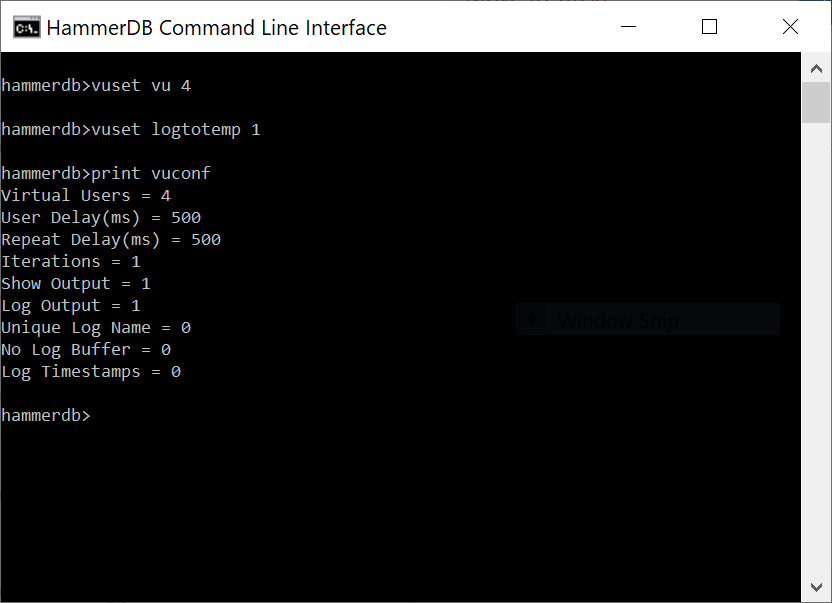
In the CLI the vuset command sets the Virtual User options and the print vuconf command displays the setting.
CLI Virtual User Options
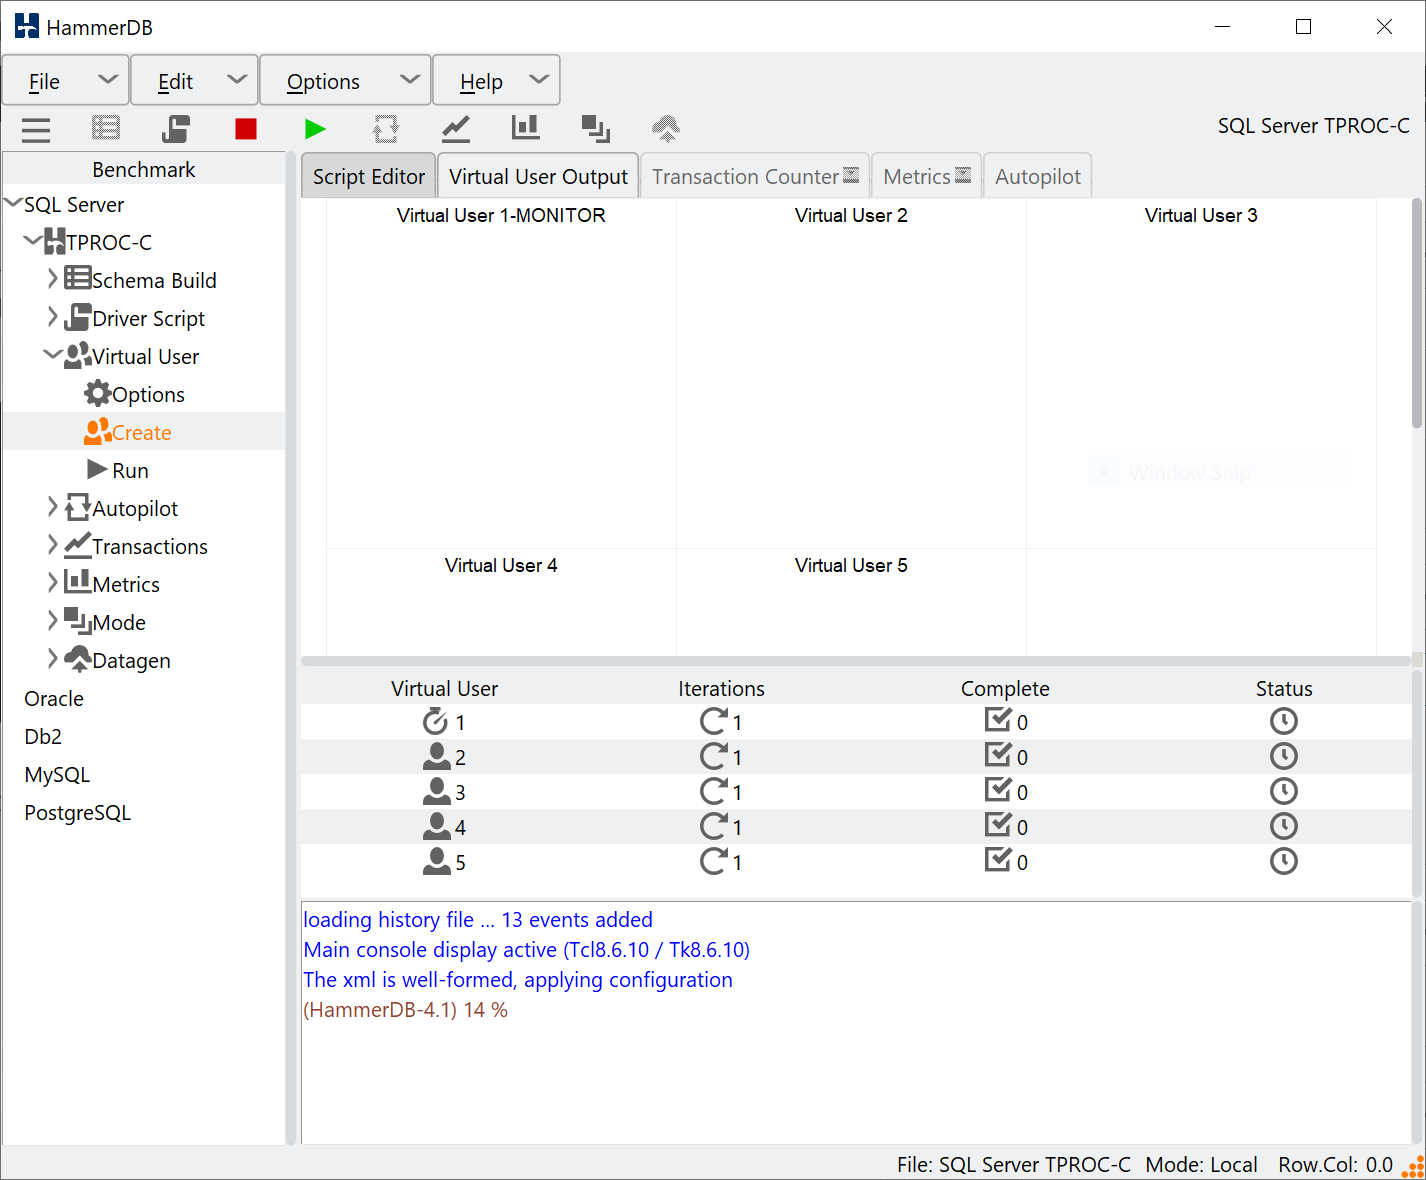
With the Virtual User configuration set the next stage is to create the Virtual Users. Having chosen the timed workload we see a monitor Virtual User in addition to the active Virtual Users chosen.
GUI Create Virtual Users
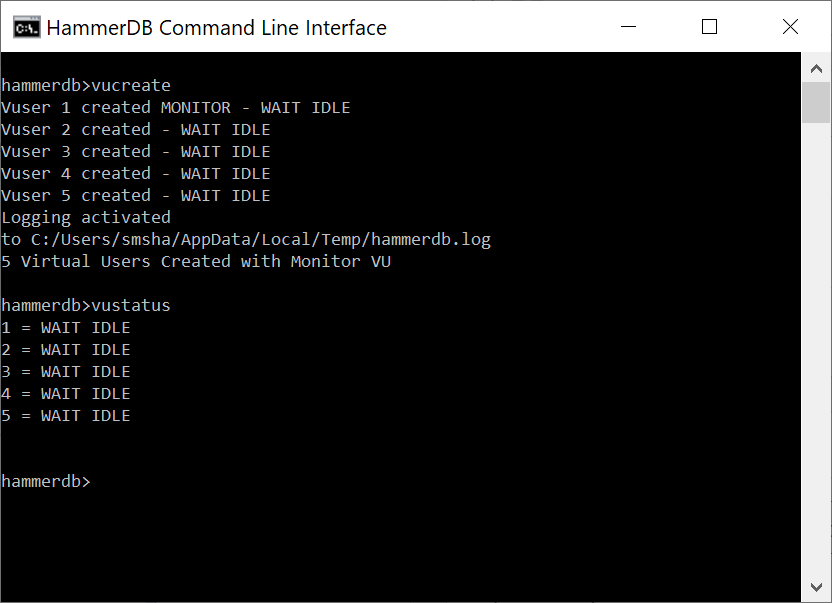
In the CLI the vucreate command creates the Virtual Users and the vustatus command shows the status that is shown in the status column of the Virtual User table in the GUI.
vucreate
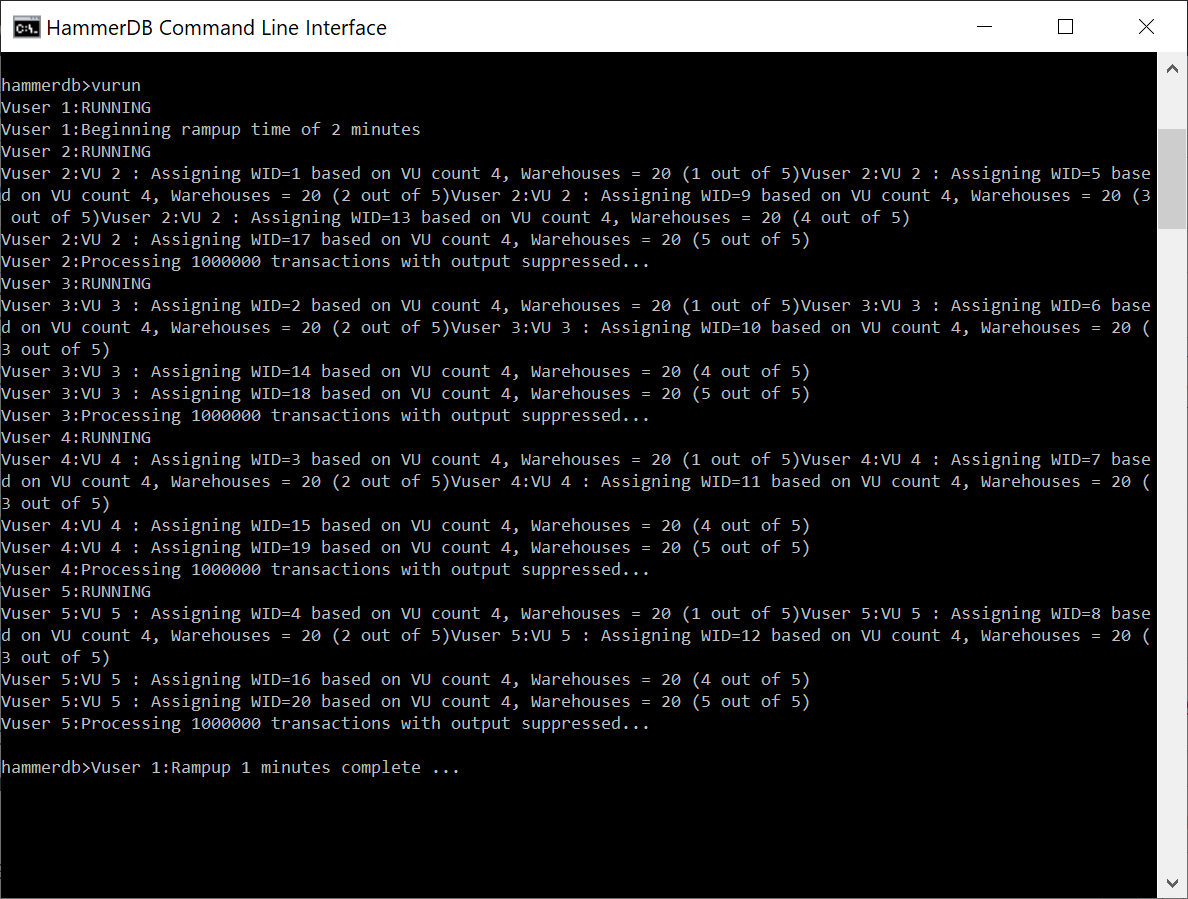
ln the GUI we would then run the Virtual Users, in the CLI the workload is started with with the vurun command.
vurun
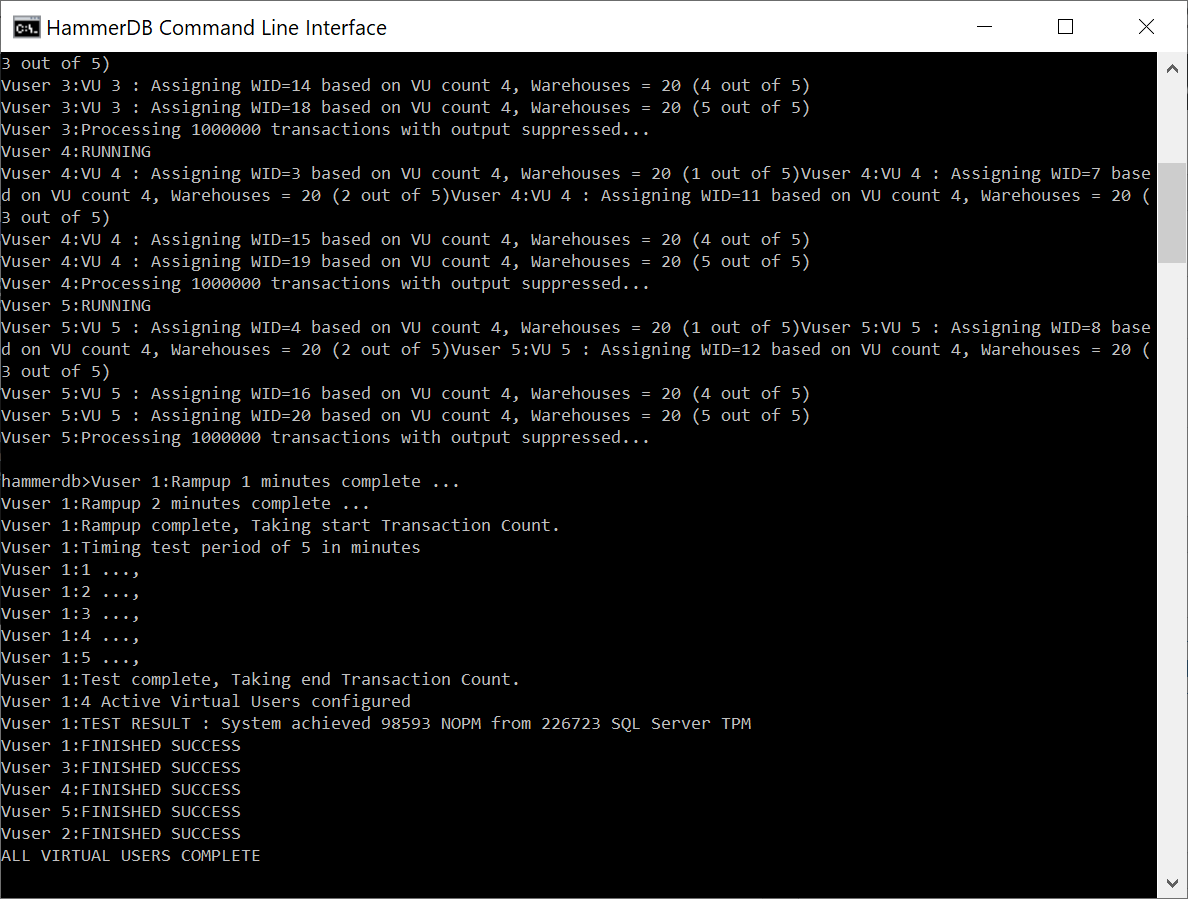
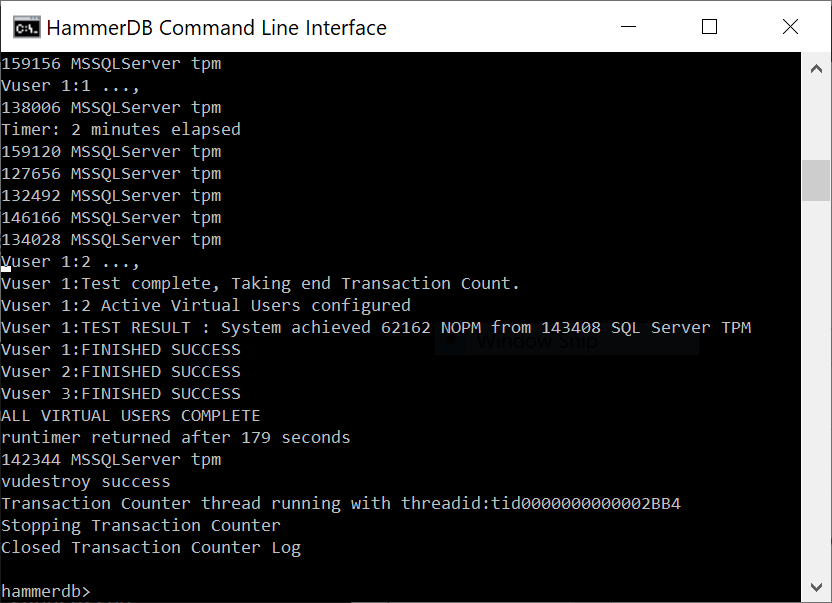
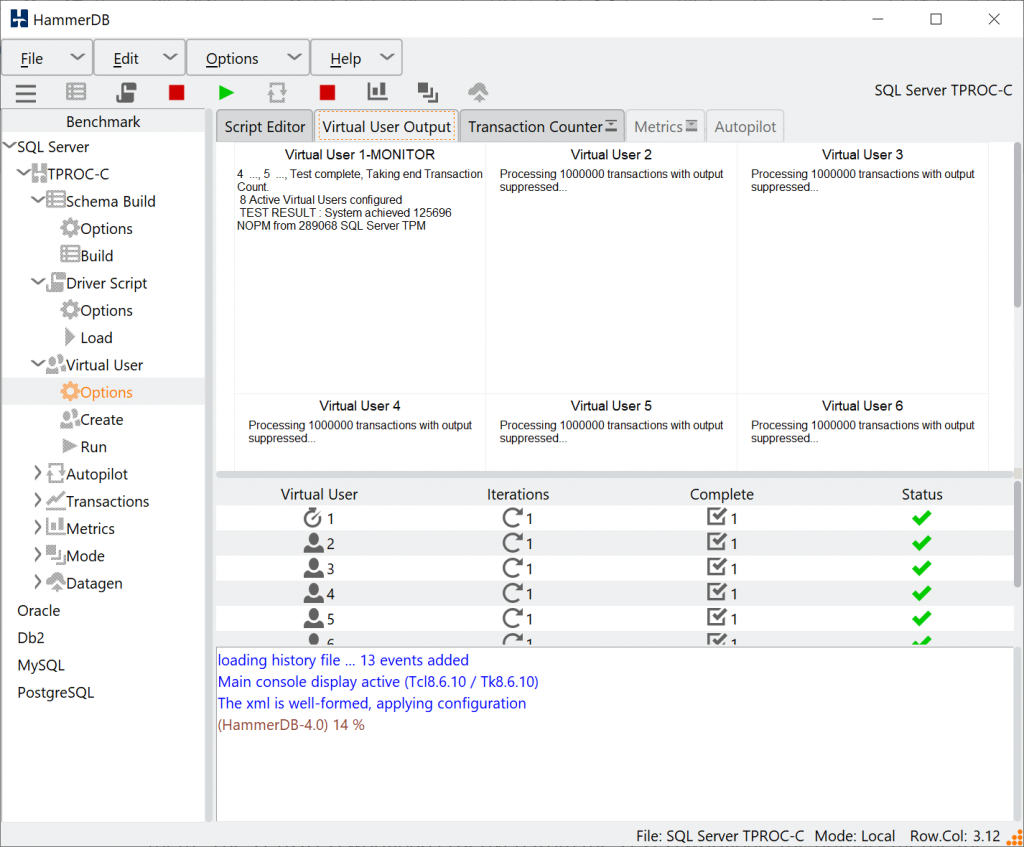
When the workload is complete we see the TEST RESULT output and the status of the Virtual Users. The vudestroy command will close down the Virtual Users in the same way as pressing the red stop button in the GUI.
TEST RESULT
Additional CLI Functionality
At this stage we have followed the GUI workflow to use the CLI to create the schema and run the TPROC-C workload with a number of Virtual Users. It is of note that much of the additional GUI functionality is also available with CLI commands, for example primary and replica instances can be created and connected in the CLI and also as shown the CLI transaction counter.
CLI Transaction Counter
Scripting the workloads
We have seen how to run the HammerDB CLI interactively by typing commands in a similar manner that we would use the GUI to build schemas and run workloads. However one major benefit of the command line use is also the ability to script workloads. There are 2 approaches to scripting HammerDB CLI commands. Firstly we can run a script from the interactive prompt using the source command. Secondly we can use the auto argument to run a script directly without the interactive prompt.
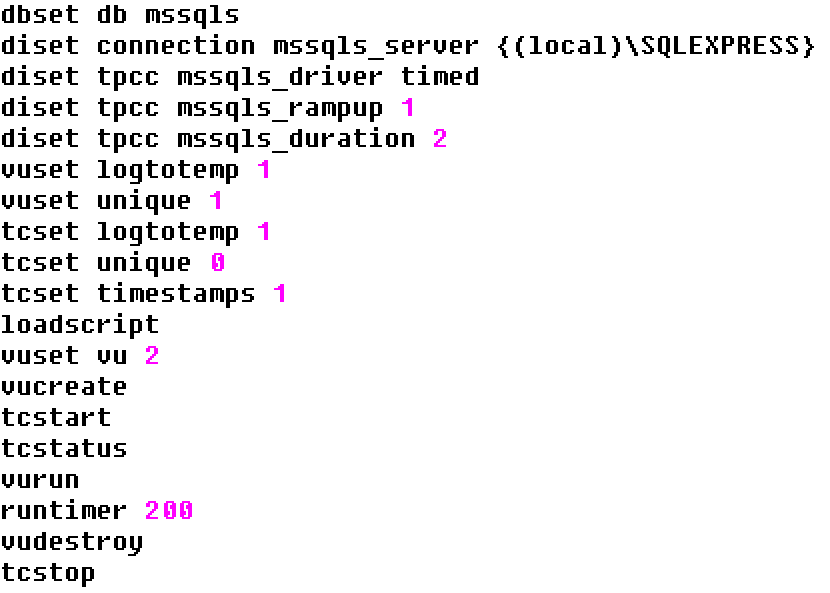
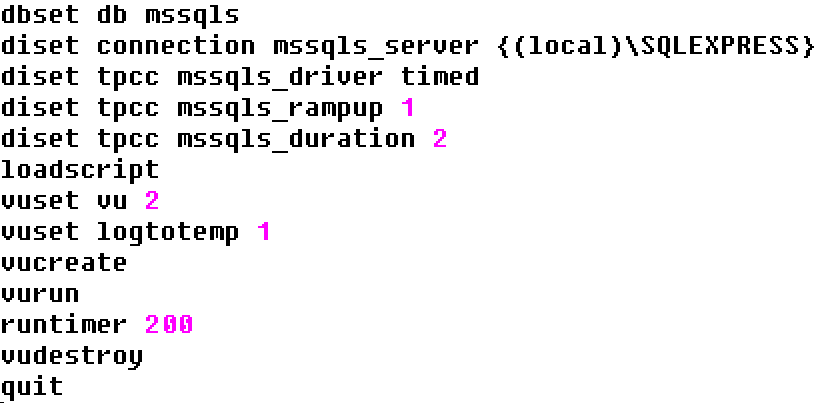
To run a script using the source command we can take a text editor and enter the commands into a file with a .tcl extension. In this example we are running a timed workload with 2 active virtual users, we are logging the output and also running the transaction counter with logged output. Note one additional command has been added to what has been seen previously when running interactively, namely runtimer. This is where having run the same workload in the GUI helps understand the concepts. HammerDB ins multithreaded and the Virtual Users run independently as operating system threads. Consequently if vurun is followed by vudestroy in a script then the Virtual Users will be immediately terminated by the main thread as soon as they are started. This is unlikely to be the desired effect. Therefore runtimer keeps the main HammerDB thread busy and will not continue to the next command until one of 2 things happen. Firstly if the vucomplete command returns true or the seconds value is reached. For this reason the runtimer seconds value should exceed both the rampup and duration time. Then only when the Virtual Users have completed the workload will vudestroy be run.
sqlrun.tcl
Now we can run the source command giving our script as an argument and the commands will be run without further interaction.
source sqlrun.tcl
We can see how the script ran to completion, called vudestroy and returned us to the interactive prompt. If desired the quit command returns from the interactive prompt to the shell prompt.
ALL VIRTUAL USERS COMPLETE
The HammerDB CLI is not restricted only to the commands shown in the help menu. The CLI instead supports the full syntax of the TCL language meaning you can build more complex workloads.
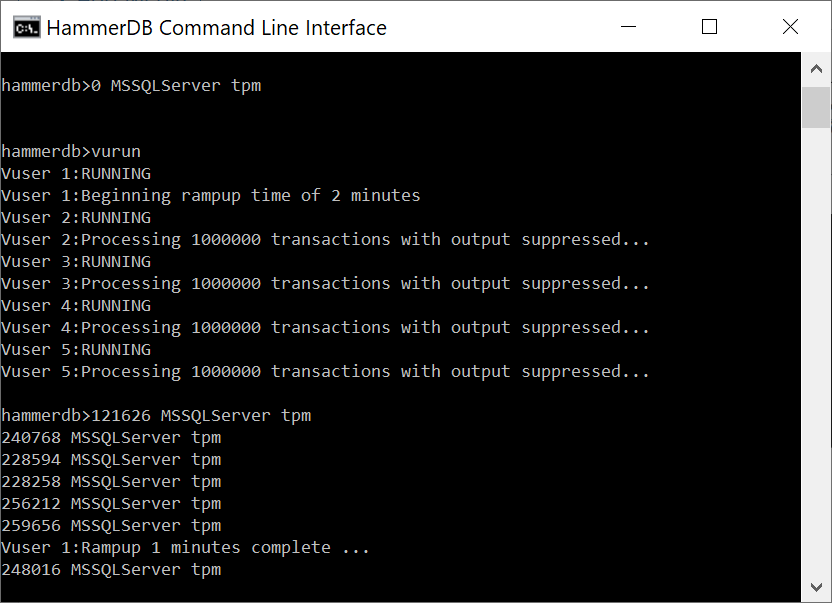
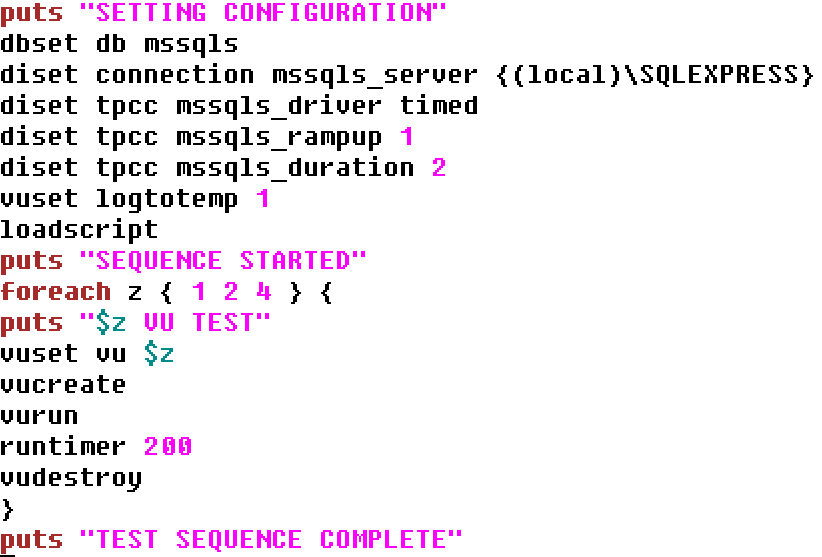
A simple example is shown using the foreach command to implement the autopilot feature from the GUI.
foreach loop
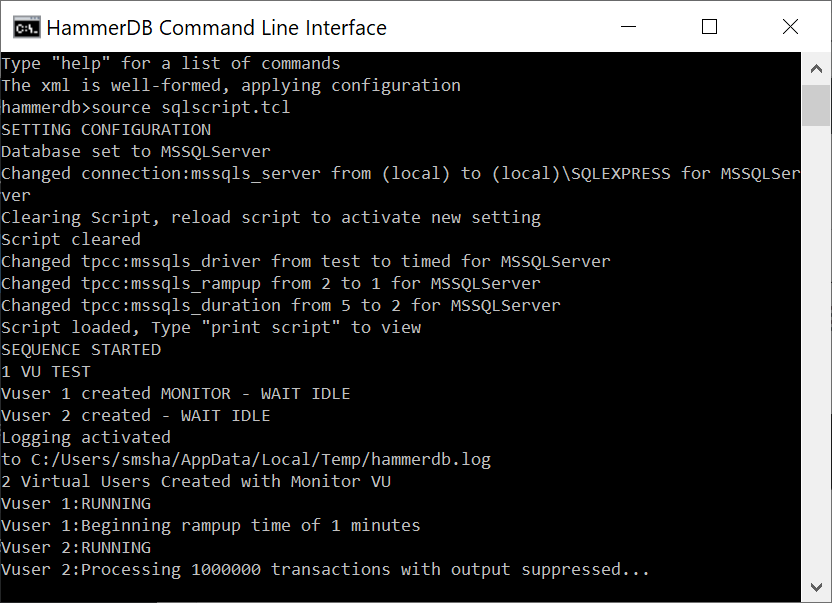
Running this script we are now executing a loop of tests with 1 then 2 then 4 Active Virtual Users in an unattended manner.
Unattended CLI Test
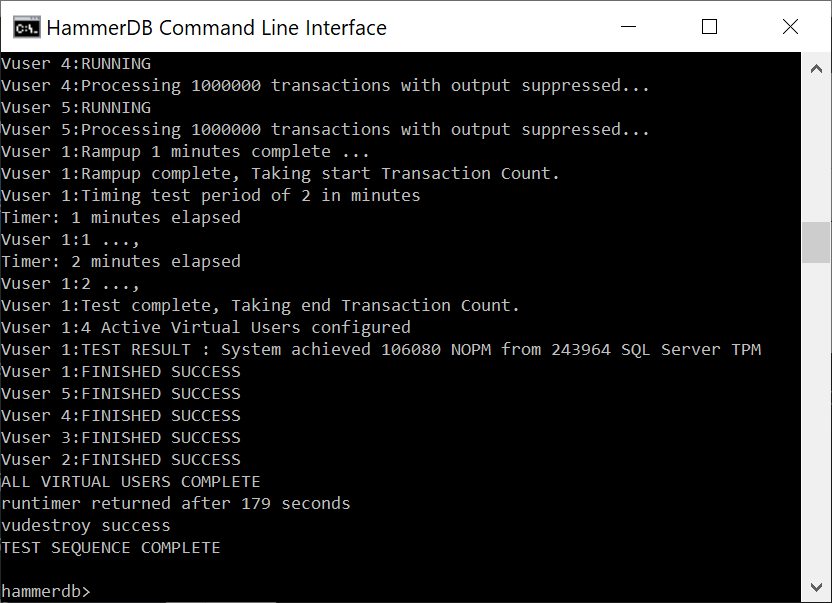
When the final iteration in the loop is complete the CLI returns to the prompt.
TEST SEQUENCE COMPLETE
and the log file provides a summary of all of the workloads.
Vuser 1:1 Active Virtual Users configured
Vuser 1:TEST RESULT : System achieved 33643 NOPM from 77186 SQL Server TPM
...
Vuser 1:2 Active Virtual Users configured
Vuser 1:TEST RESULT : System achieved 66125 NOPM from 152214 SQL Server TPM
...
Vuser 1:4 Active Virtual Users configured
Vuser 1:TEST RESULT : System achieved 106080 NOPM from 243964 SQL Server TPM
...
Running the CLI from the OS Shell
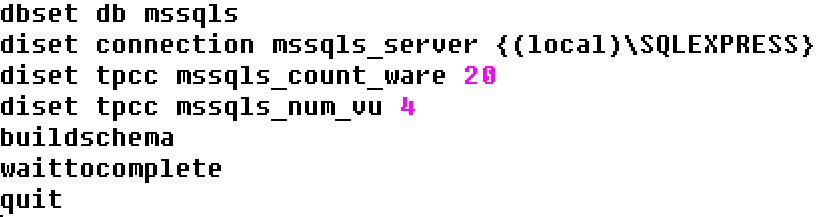
Of course you can use TCL scripting to configure complex build and test scenarios including the execution of host commands. Another way is to run multiple CLI scripts from the OS shell such as Bash on Linux and Powershell on Windows. The following example shows a build and test script for SQL Server. Note the additional waittocomplete command in the build script. This command is a subset of runtimer and causes the CLI to wait indefinitely until all of the Virtual Users return a complete status. At this point the CLI will return. In this case it is followed by a quit command to exit the CLI. These scripts are called sqlbuild2.tcl and sqlrun2.tcl respectively.
sqlbuild2.tclsqlrun2.tcl
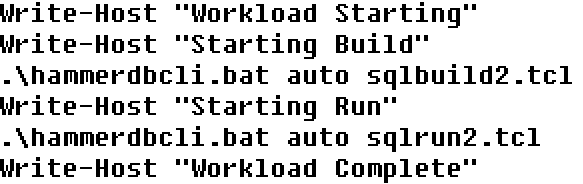
In Windows we can now write a powershell script called buildrun2.ps1 that calls the build and run scripts in turn. In Linux we would do the same with a bash script. In this case we use the auto argument to run the script in a non-interactive mode. These commands can be interspersed with other operating system or database commands at the shell level. In this case we have only written to the output however any additional database configuration commands can be used to build a complex test scenario.
buildrun2.ps1
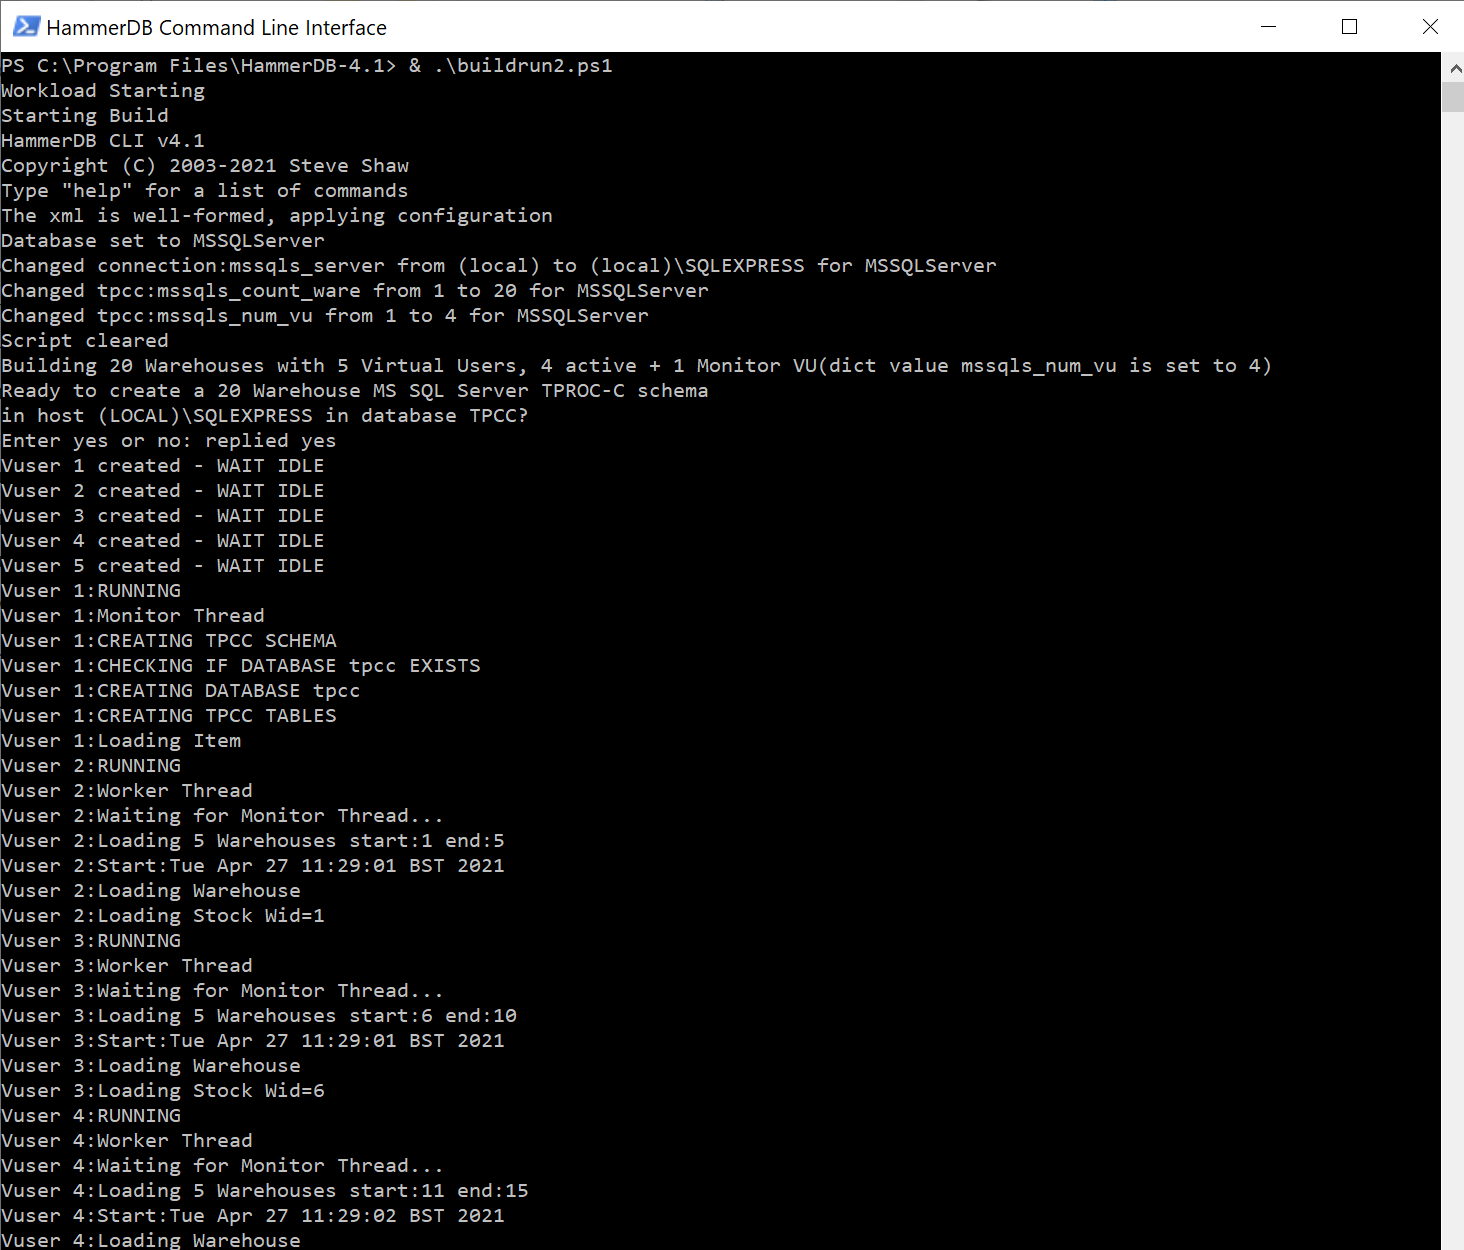
Starting the powershell we change to the HammerDB directory and run the powershell script. (You should always run the scripts after changing to the HammerDB directory rather than running them from another directory). This starts running the build script to build the schema.
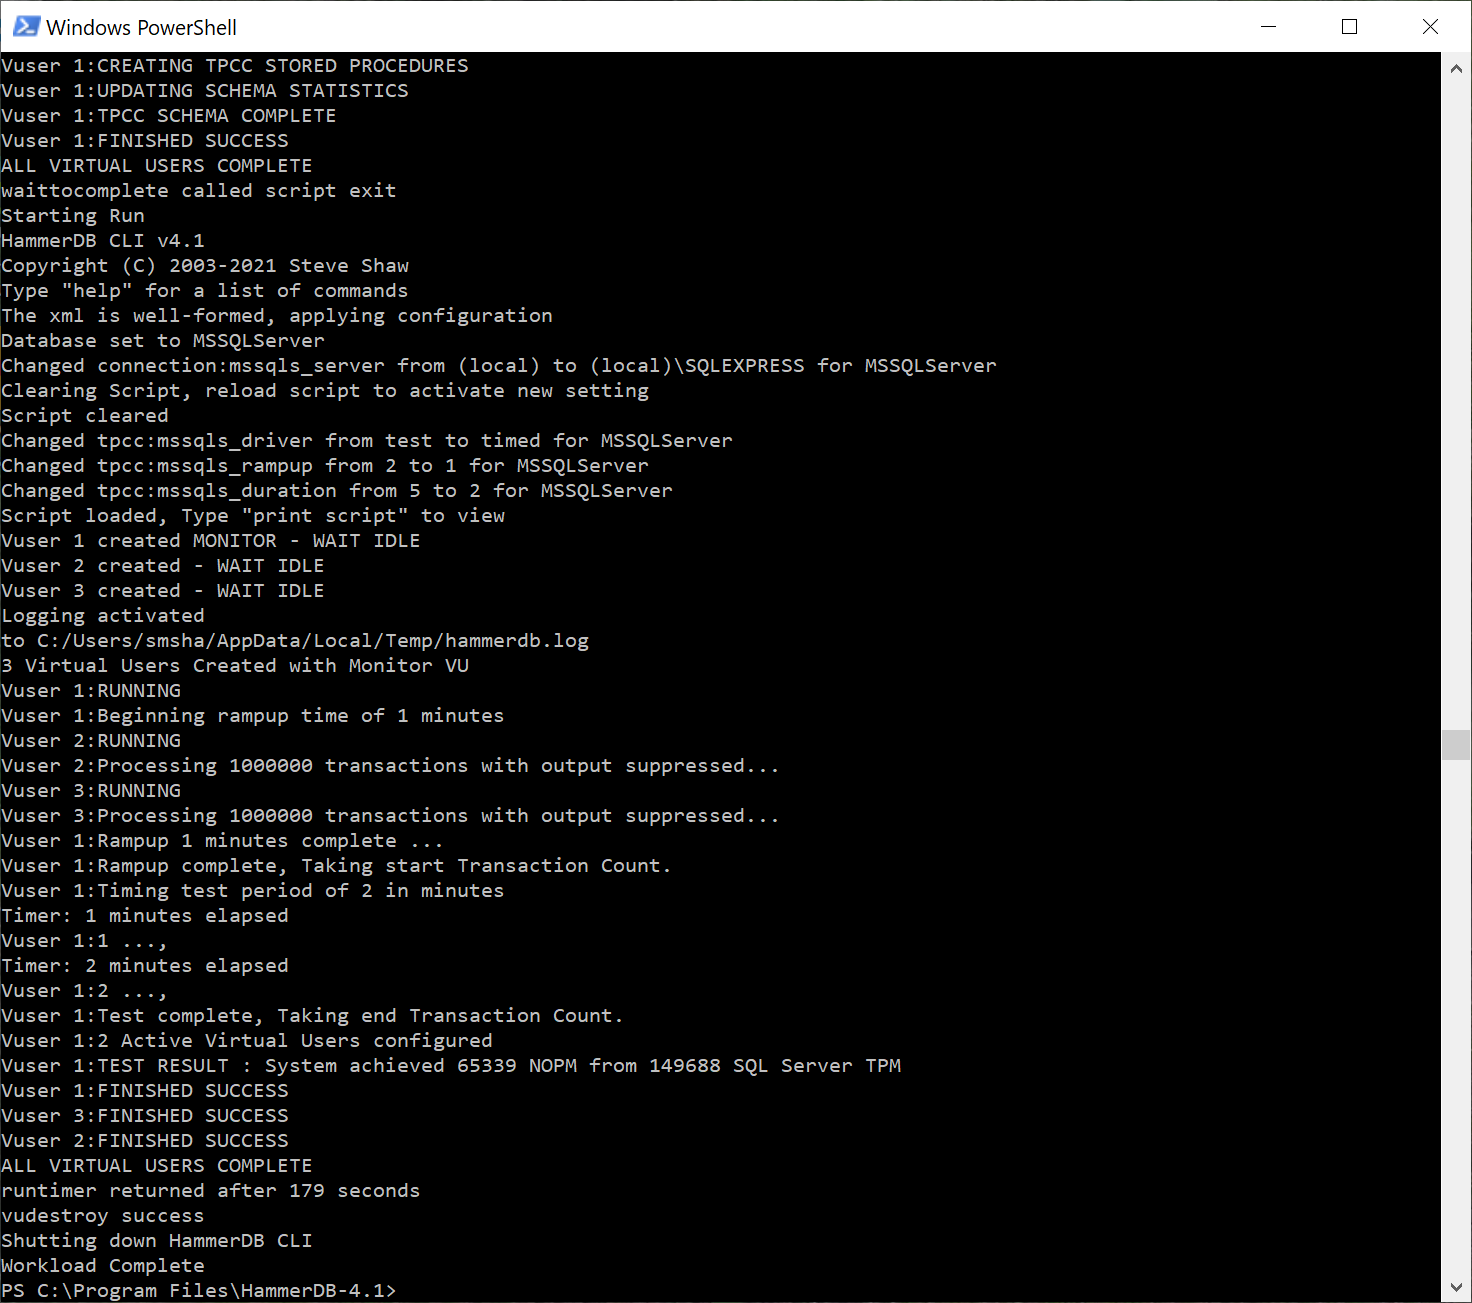
Once the build is complete the build script exits, the powershell takes over and follows it by running the driver script.
After the test is complete the powershell exits and returns to the command prompt.
Summary
Once you have an overview of the HammerDB workflow by following the GUI menu driven system using the CLI should be straightforward using the same approach. The key concept is to understand that both the GUI and the CLI are multithreaded and the Virtual Users themselves run entirely independently as operating system threads and therefore you interact with the Virtual Users by interacting with the main interface thread and passing messages to the VUs. This means if you exit too early from the main interface in either GUI or CLI the entire workload will be stopped.
Once you have familiarity with how the CLI works it is then not difficult to adapt this understanding to build complex automated workflows using TCL scripting, shell scripting or a combination of both.
HammerDB is a load testing and benchmarking application for relational databases. All the databases that HammerDB tests implement a form of MVCC (multi-version concurrency control). This helps to minimise locking allowing multiple sessions to access the same data at the same time. On high-performance multi-core systems all the supported databases can return performance in the many millions of transactions per minute. However, it is crucial that the benchmarking application does not have inherent bottlenecks that artificially limits the scalability of the database. This is why the choice of programming language is so important from the outset.
This post explains why HammerDB made the language decisions it made to make it the best performing and most usable database benchmarking software.
Basic Benchmarking Concepts
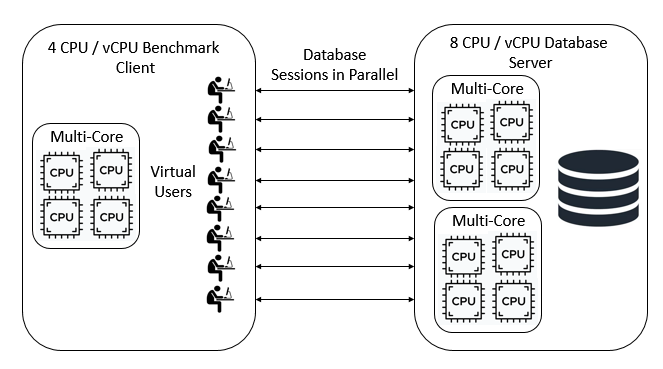
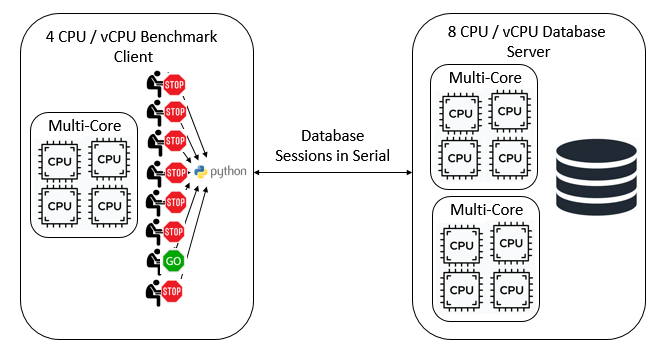
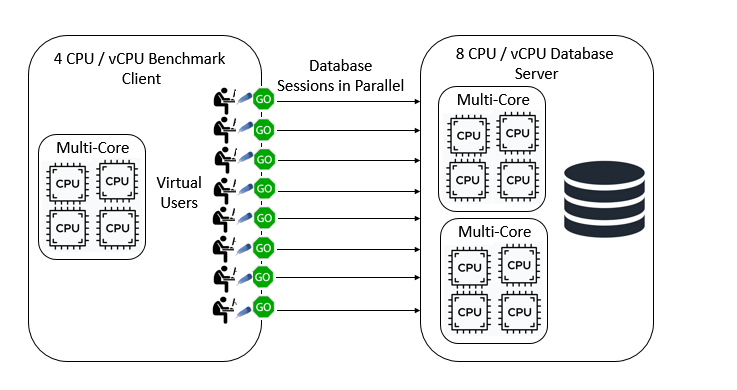
As we have seen databases are designed to handle multiple database sessions at the same time. To benchmark a database we introduce the concept of a Virtual User. The benchmarking software simulates the actions of multiple individual users and these users must run in parallel to test the MVCC (Multiversion Concurrency Control) capabilities of the database. There is a key distinction here between parallelism and concurrency. It is important that the concurrency between sessions is handled at the database not at the client because that is how databases are accessed in the real world. When we have multiple CPU cores on both the benchmark client and database server it is crucial that these database sessions run independently of each other at the same time, in parallel. For simplicity, we do not include networking or transaction management middleware in this discussion because although important in the real world they do not affect the key concepts.
Database benchmarking in parallel
SQL
Firstly, for a database benchmarking application it should not come as a huge surprise that the key language used for testing databases is Structured Query Language known as SQL. For HammerDB both TPROC-C and TPROC-H run all of their workloads on the database being tested in SQL. The following is an example from TPROC-C from SQL Server.
SELECT @st_o_id = district.d_next_o_id
FROM dbo.district
WHERE district.d_w_id = @st_w_id AND district.d_id = @st_d_id

SELECT @stock_count = count_big(DISTINCT stock.s_i_id)
FROM dbo.order_line
, dbo.stock
WHERE order_line.ol_w_id = @st_w_id
AND order_line.ol_d_id = @st_d_id
AND (order_line.ol_o_id < @st_o_id) AND order_line.ol_o_id >= (@st_o_id - 20)
AND stock.s_w_id = @st_w_id
AND stock.s_i_id = order_line.ol_i_id
AND stock.s_quantity < @threshold
OPTION (LOOP JOIN, MAXDOP 1)
and the following from TPROC-H
select top 100
s_acctbal, s_name, n_name, p_partkey, p_mfgr, s_address, s_phone, s_comment
from part, supplier, partsupp, nation, region
where p_partkey = ps_partkey
and s_suppkey = ps_suppkey
and p_size = 47
and p_type like '%COPPER'
and s_nationkey = n_nationkey
and n_regionkey = r_regionkey
and r_name = 'EUROPE'
and ps_supplycost = (
select min(ps_supplycost)
from partsupp, supplier, nation, region
where p_partkey = ps_partkey
and s_suppkey = ps_suppkey
and s_nationkey = n_nationkey
and n_regionkey = r_regionkey
and r_name = 'EUROPE'
)
order by s_acctbal desc, n_name, s_name, p_partkey option (maxdop 2)
Application Logic in Stored Procedures
So the interaction with the database is in SQL. For the TPROC-H workload this is all we need the queries are long-running analytics queries so once executed on the database do not need to wait for the benchmarking client. TPROC-C however is derived from the TPC-C specification and requires application logic around the SQL. HammerDB implements the TPROC-C application logic in the form of stored procedures for all the supported databases.
Database
Application Logic
Oracle
PL/SQL
SQL Server
T-SQL
Db2
SQL PL
PostgreSQL
PL/pgSQL
MySQL
stored program language
HammerDB Stored Procedures.
So now our TPROC-C example from the Stock Level stored procedure on SQL Server begins as follows.
CREATE PROCEDURE [dbo].[slev]
 @st_w_id int,
 @st_d_id int,
 @threshold int
 AS
 BEGIN
 DECLARE
 @st_o_id int,
 @stock_count int
 BEGIN TRANSACTION
 BEGIN TRY
 SELECT @st_o_id = district.d_next_o_id
 FROM dbo.district
 WHERE district.d_w_id = @st_w_id AND district.d_id = @st_d_id
 ....
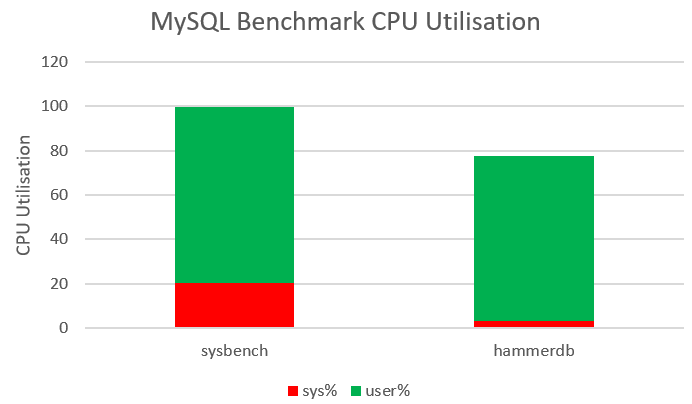
Why does it matter that we implement the application logic in the form of stored procedures? To prevent the roundtrip between the client and database becoming the bottleneck. As an illustration if we compare HammerDB with a sysbench workload both running on the same system and same MySQL database we can observe that both workloads are driving 75-80% of the CPU on database throughput however sysbench is utilising 20% system time compared to 3% for HammerDB. (The HammerDB workload shows that database locking prevents full CPU utilisation on the MySQL server).
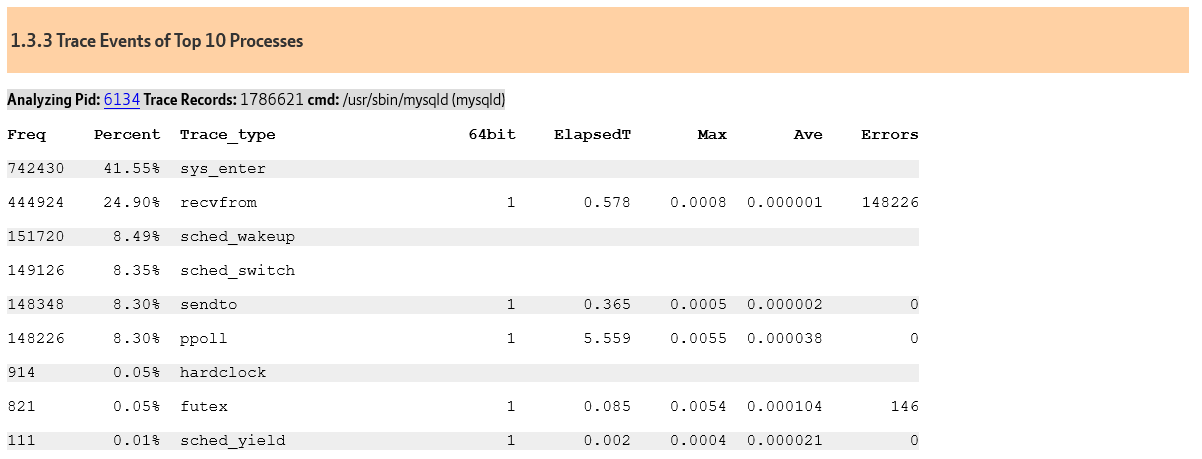
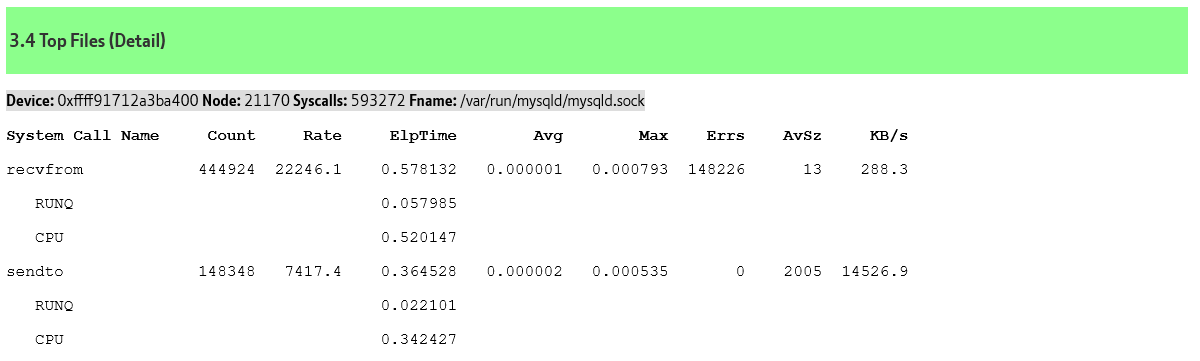
Why is this happening? sysbench has the application logic in the client and is therefore spending 6-7X of the time on socket communication because every single SQL statement requires a separate round trip to the client (recvfrom and sendto).
Top 10 ProcessesTop Files
However, having the application logic in the client is even worse because you are sacrificing key database efficiencies of prepared statements. Of course, you can prepare individual statements, however you can see major efficiency gains by using natively compiled stored procedures. With HammerDB the stored procedures are compiled (where supported by the database) at the time of schema creation by the HammerDB build. When the HammerDB driver is run we parse the statement to call the procedure once (and only once) per session. The example below is for the NEW ORDER stored procedure for the Oracle database.
We therefore don’t use CPU repeatedly parsing any of the SQL used for the workload. Instead, we are using bind variables and each time we call the stored procedure we bind the INPUT variables, execute the stored procedure and fetch the OUTPUT variables. The driver only needs to generate strings that correspond to the bind variables and therefore not only is it doing much more work per roundtrip it is sending and fetching a lot less data as well.
Database interfaces in C
So our application logic is in SQL and stored procedures and we are preparing once then binding and executing statements multiple times. So lets take a look at an extract of how this is done in HammerDB for Db2 and the language used.
If this looks like a lot like the C programming language, that is because it is or to be more precise it is a C program using the Db2 Call Level Interface (CLI) that is the ‘C’ ‘C++’ programming interface for Db2 ‘to pass dynamic SQL statements as function arguments’ which is exactly what we want to do. For all the databases supported we are using a compiled C interface on the client to use the lowest level of most efficient form of access possible.
Database
Programming Interface
Oracle
OCI
SQL Server
ODBC
Db2
CLI
PostgreSQL
Libpq
MySQL
MySQL Native Driver
HammerDB Database Interfaces
Glue language
So now we have all of our application logic in SQL and stored procedures, natively compiled that we can bind and execute. We also have our low-level C level interfaces that can run both SQL and stored procedures at high performance. The next thing we need is what is known as a Glue language. One that can stick all the components together in an application that we can use to run databases benchmarks.
Why not Python as a Glue Language
Surely we can just use any language that we are familiar with? Unfortunately it is not quite this simple. Let’s take a look at using Python as a language to build a driver for a workload derived from TPC-C. There are different language implementations of Python, as we have seen for our high performance benchmarking application our interfaces are written in C so CPython is our only choice. So lets take a look at how this would work in practice.
Referring back to our benchmarking basics we want to run database sessions in parallel. For this reason we need to implement our database sessions in the form of operating system threads. We could use processes, however given we may want to create hundreds or thousands of virtual users multithreading is the best approach to implement a Virtual User.
This is where we hit a roadblock with using Python as a glue language for a benchmarking application, the Python GIL. The GIL or Global Interpreter Lock is a mutex that stops multiple Python threads executing Python bytecodes at the same time.
The Python GIL
In other words our Virtual Users instead of executing in parallel are now effectively running their database sessions in serial and the more sessions we have the more performance will degrade as each session tries to acquire the GIL. As it says on the Python Wiki ‘it is only in multithreaded programs that spend a lot of time inside the GIL, interpreting CPython bytecode, that the GIL becomes a bottleneck.’ – this describes exactly the scenario that we use for database benchmarking and is discussed further in the section Bytecode Execution.
So having an application client mutex lock that artificially stalls our Virtual Users does not sound good. Unfortunately, however our glue language doesn’t know that we are testing a high performance database processing numerous databases sessions concurrently. Our sessions will also be taking out locks on the database itself meaning that blocked Virtual Users on the client could themselves be blocking running Virtual Users on the database. Conversely, if throughput is limited we could also be preventing the database from handling the database locking that results from running multiple sessions accessing the same data at the same time. In either scenario we are preventing the database from managing sessions concurrently when this is precisely the scenario we want to test.
Why Tcl as a Glue Language
HammerDB abandoned Python as a glue language at the design stage because of the lack of multithreading and parallel capabilities. The only language that met such specific requirements for high throughput database benchmarking was Tcl or Tool Command Language. Not only was it designed from the ground up to interface with applications built in C, but it also supports true multithreading enabling our Virtual Users to be implemented as an independent operating system thread and genuinely run in parallel.
Tcl Multithreading in parallel
How does Tcl do this if Python can’t? Whereas within Python all threads run in a single interpreter (after acquiring the GIL) in Tcl each thread has its own copy of the interpreter. This is possible because the Tcl interpreter is exceptionally compact and lightweight (Also for this reason Tcl is often used as an embedded language in hardware such as Cisco Routers). By default, there is no shared data between threads, instead each thread runs an event loop completely independently and communication is done by passing messages to run events in those threads.
So what if we pre-created a number of operating system threads, loaded a C level interface to communicate with a database and then passed a script for the threads to evaluate in their event loop. That script would create strings of data for parameters and then either run SQL statements or call databases stored procedures? That is exactly what HammerDB does. In this scenario we have true multithreading and linear scalability. When our benchmarking client has multiple cores and threads we can take advantage of them and run entirely in parallel ensuring a true concurrent workload on the database server. Of course if the threads need to communicate they can through messages in a thread safe way, so for example if you press the stop button in HammerDB you send a message to all Virtual Users to end the current running workload and exit the thread. When you create Virtual Users in HammerDB you can see that you have created threads as follows. (run this command in the console or in the CLI).
There is one small exception to this parallelism. Of course, you can only update a graphical user interface with the main application thread and therefore any output to be displayed must be sent via a message to this main application thread. Therefore, the Test workload in HammerDB that prints the output from all user sessions requires every session to pass its output to the main display. For this reason the Timed workload suppresses output unless there is an error.
Bytecode Execution
So as we saw in Python ‘it is only in multithreaded programs that spend a lot of time inside the GIL, interpreting CPython bytecode, that the GIL becomes a bottleneck.’ so lets see what happens in HammerDB. Running a performance profiling tool such as perf in Linux we can see that the top event is TEBCresume standing for Tcl Execute Byte Code.
It is not a coincidence that as a Tcl proc is compiled to bytecode, HammerDB implements the calling of the database stored procedures as procs. You can see the bytecode generated with a command such as follows.
So lets look at the slev proc before disassembly. We are calling the stored procedure with the warehouse id and stock level district id parameters, setting the threshold, executing the stored procedure on the database and fetching the results.
As seen before the application logic and our workload is on the database. Our Virtual User is generating and passing strings of data to call these stored procedures meaning the client logic is exceptionally lightweight. Not only is it lightweight but as we have seen each Virtual User is an operating system thread running compiled bytecode generating strings so not only is it lightweight and parallel it is also very fast. But let’s quantify fast by running the same calculation in SQL Server (see the HammerDB documentation for the Oracle example)
USE [tpcc]
 GO
 / Object:  StoredProcedure [dbo].[CPUSIMPLE]    Script Date: 25/02/2021 17:41:35 /
 SET ANSI_NULLS ON
 GO
 SET QUOTED_IDENTIFIER ON
 GO
 ALTER PROCEDURE [dbo].[CPUSIMPLE]
 AS
    BEGIN
       DECLARE
          @n numeric(16,6) = 0,
          @a DATETIME,
          @b DATETIME
       DECLARE
          @f int
       SET @f = 1
       SET @a = CURRENT_TIMESTAMP
       WHILE @f <= 10000000
          BEGIN
       SET @n = @n % 999999 + sqrt(@f)
             SET @f = @f + 1
          END
          SET @b = CURRENT_TIMESTAMP
 PRINT 'Timing = ' + ISNULL(CAST(DATEDIFF(MS, @a, @b)AS VARCHAR),'')
 PRINT 'Res = ' + ISNULL(CAST(@n AS VARCHAR),'')
    END

Timing = 7767
Res = 873729.721235
(1 row affected)
Completion time: 2021-02-25T17:40:16.1261747+00:00
and in Tcl Bytecode.
proc runcalc {} {
 set n 0
 for {set f 1} {$f <= 10000000} {incr f} {
 set n [ expr {[::tcl::mathfunc::fmod $n 999999] + sqrt($f)} ]
 }
 return $n
 }
 puts "bytecode:[::tcl::unsupported::disassemble proc runcalc]"
 set start [clock milliseconds]
 set output [ runcalc ]
 set end [ clock milliseconds]
 set duration [expr {($end - $start)}]
 puts "Res = [ format %.02f $output ]"
 puts "Time elapsed : [ format %.03f [ expr $duration/1000.0 ] ]"

hammerdb>source runcalc.tcl
Res = 873729.72
Time elapsed : 3.553
hammerdb>
So on the same test system SQL Server completed the T-SQL calculation in 7.7 secs and Tcl completed the calculation in 3.5 secs. So for this example the client language is 2X faster than one of the fastest server languages. Yet remember the client logic is only generating strings to call the server side stored procedures (or SQL statements for TPROC-H) and all the Virtual Users are running independently of each other meaning that the client side of the workload is minimal compared to the database side.
As HammerDB tests multiple databases we also have the insight into client performance from comparing and contrasting the throughput from both commercial and open source databases. Consequently, we know that when we see a result for a highly tuned commercial database that is more than 10X higher throughput than a comparative database on the same hardware system we have 100% confidence that the limitation does not reside in the HammerDB client side of the test but instead in the database.
What about Coroutines?
We have seen that for database benchmarking it is important that our Virtual Users run in parallel meaning that each Virtual User should operate as an operating system thread. However, there is one scenario where you could raise an objection. What about when we want to run thousands of database sessions? In this scenario it would not be possible to run thousands of operating system threads due to the overhead on system resources and therefore couldn’t we run an implementation using coroutines instead? The answer is yes and when we want to run thousands of database sessions this is exactly what HammerDB does.
proc promise::async {name paramdefs body} {
     # Defines an procedure that will run a script asynchronously as a coroutine.
This option is chosen when you select the Asynchronous Scaling checkbox. You define the number of Virtual Users (operating system threads) and the number of clients per Virtual User sessions managed with coroutines. However, when you select Asynchronous Scaling note that it also activates keying and thinking time for you, this is not coincidental.
A coroutine implementation is appropriate for managing many sessions concurrently (rather than in parallel) when there is a clear and defined time delay between transactions per session. This is why HammerDB uses threads for Virtual Users for maximum throughput and threads and coroutines for asynchronous scaling when sessions will sleep for keying and thinking time. Coroutines alone would not enable the parallelism required for maximum throughput.
Building a GUI with Tk
HammerDB can run in command line mode but has always had a GUI that runs on both Linux and Windows platforms. For most Python applications the graphical interface used is called Tkinter which is the Python interface to Tcl/Tk. HammerDB bypasses this interface and uses Tk directly meaning that all the features available to a Tkinter application are also available to HammerDB but also more as well, meaning for example that HammerDB could take advantage of SVG graphics for high definition displays before a Python Tkinter application could, creating a native display for both Linux and Windows.
HammerDB GUI
Summary
We have discussed why HammerDB is written in the programming languages it uses and why running the clients in parallel in operating system threads is so important when we want to test concurrency on the database being tested. We have seen that the workloads are written in SQL and stored procedures and the client logic is compiled into Bytecode for performance. All of this is wrapped in an application interface that is simple and intuitive so all you need to do is point HammerDB at your database and start testing.
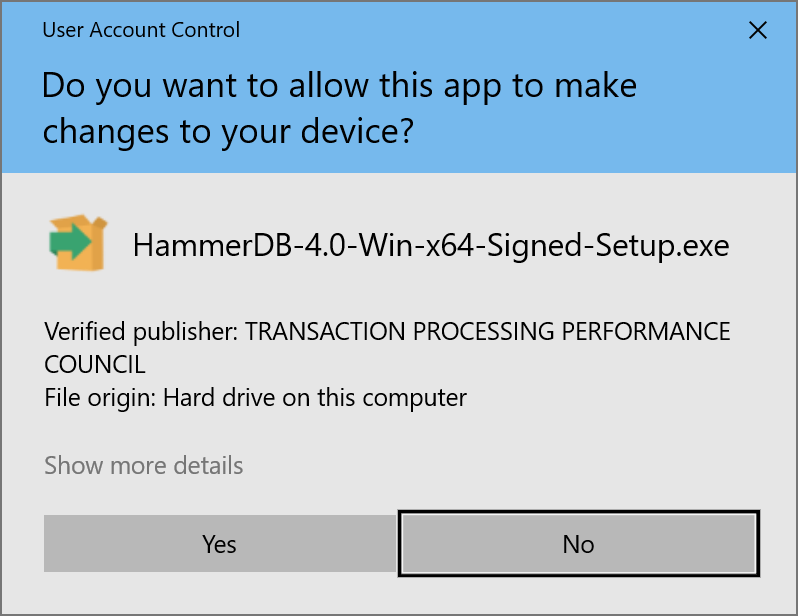
The key difference between the 2 installers is that the Signed Setup has been signed with a code signing certificate, whereas for the unsigned installer you can verify the installer itself manually with the provided checksums. When running the signed setup it will confirm the Verified publisher as the TPC Council as shown.
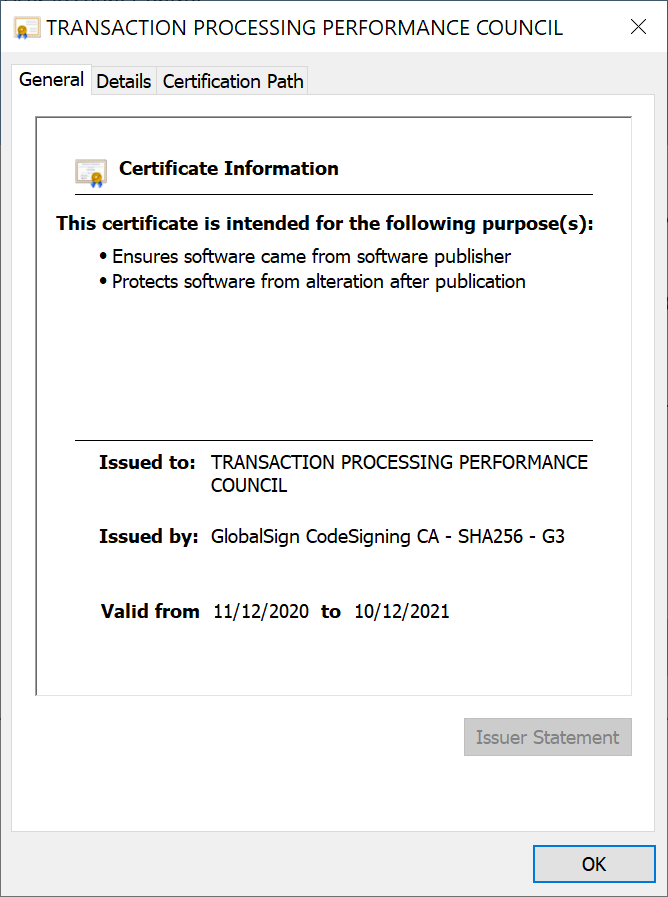
If you choose to Show more details you can view the Certificate Information from the TPC Council.
For Linux installations and the provided zip file for Windows, verification of the release files continues to be done through checksums.
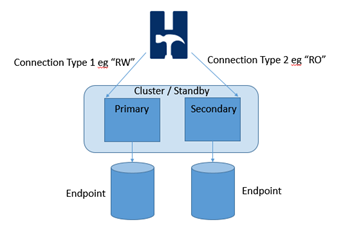
Prior to HammerDB v4.0 for the TPROC-C test there was the option to connect to one database instance only. If it was required to connect to multiple instances in a cluster then the Primary/Replica modes were used to create multiple HammerDB instances to connect to the separate database instances simultaneously. HammerDB has introduced a connect pool feature whereby a single instance of HammerDB can create a pool of multiple database instance connections with policies defined at the stored procedure level to determine how the individual stored procedures are run on which connections to the database instances. For example in an environment where there are primary read-write instances and secondary read-only it would be possible to define a policy whereby the neworder, payment and delivery stored procedures run against the read-write instance and stocklevel and orderstatus run against the read-only instance. Where there are multiple instances serving a similar purpose the policy can determine how an individual transaction is assigned. For example if there are three read write-instances then the neworder stored procedure can be defined to execute a transaction at each in a round-robin fashion or instead select an instance at random.
Connect Pool
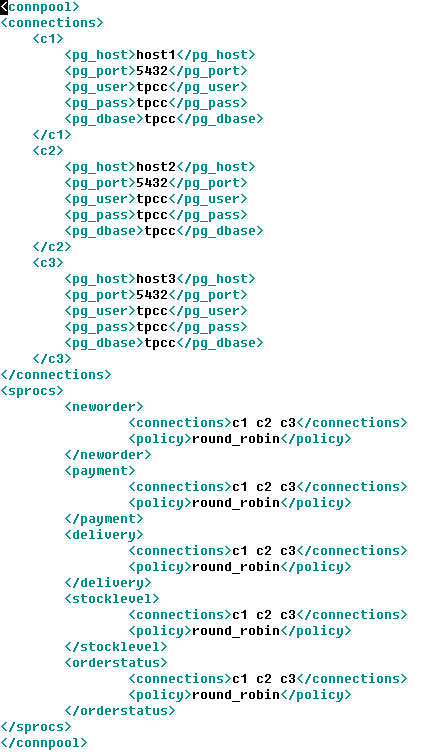
To define the connect pool there are new XML files in the config/connectpool directory. These provide a template for the multiple connections with the same connection options for the standard interface defined in the connections section. The connections are named c, c2, c3 and so on with no limit on the number of connections that you define. There is also an sprocs section where you define what connections each stored procedure should use and what policy to apply, the policy can be first_named, last_named, random or round_robin.
pgcpool.xml
When you have defined your configuration, select the XML Connect Pool option when loading the driver script. Your active Virtual Users will then use your XML defined connections and connect to each defined one thereby holding a pool of connections open to distribute the transactions to. For all databases the connect pool connections use prepared statements and once the connection is established will prepare statements for all of the stored procedures against each connection.
PostgreSQL XML Connect Pool
Within the driver script there is a commented line that can be uncommented to report details on all of the connections and prepared statements that are made.
postgresql connection information
Finally it is important to note that the main monitor connection continues to connect to the standard defined connection and reports NOPM and TPM from that single instance. Where a clustered environment such as Oracle RAC reports performance data for the entire cluster this will report cluster performance. If however you have defined connections to separate unrelated instances then this monitor connection will only report out for the instance it is connected to. For this reason where a database will not report performance data across the cluster the XML connect pool driver script will also report client side transactions for each Virtual User and in total to provide a guide to the workload directed to each instance.
Another key feature introduced with HammerDB v4.0 is the refactoring of the stored procedures for some of the TPROC-C workloads. This means that the performance metrics reported in NOPM/TPM could be different from previous releases as well as the ratio between NOPM and TPM for these workloads. Therefore results from v4.0 may not be directly comparable with the results from previous releases for your database. The reason for these changes is that over time for some databases more advanced features or drivers have been introduced that improve performance since the time that the original HammerDB transactions or interfaces were written. These changes were contributed and accepted into HammerDB v4.0.
NOPM vs TPM
Firstly it is important to understand the metrics NOPM, TPM and the difference between them. The TPROC-C workload is derived from the TPC-C workload, the primary metric for TPC-C is called tpmC, the number of new order transactions processed per minute. As HammerDB TPROC-C is a derived workload it is not permitted to use tpmC and therefore instead uses a metric called NOPM that records the number of new order transactions processed per minute. Although a similar metric to tpmC it is not considered to be directly comparable. From HammerDB v4.0 NOPM should be considered the primary metric and is the only one that should be used for a cross database comparison. For this reason from HammerDB v4.0 NOPM is printed first.
NOPM Primary Metric
However for backward compatibility the generic.xml configuration file contains an option called first_result, setting this to TPM will print the results in the same format as v3.3 and earlier.
So why not just print NOPM and report a single metric for TPROC-C as per the official TPC-C workloads? The key reason is that HammerDB is intended to give us more insights into database performance and whereas NOPM is a cross-database comparable metric TPM is a database specific metric that can give more details on the workload and be related to other database specific metrics but cannot be compared between different databases. For example for the Oracle database the TPM value is calculated from the number of user commits + user rollbacks and you can query these metrics in the v$sysstat table during the test. This metric is the same used in Oracle tools such as AWR reports and as shown the TPM metric captured by HammerDB is exactly the same as Transactions and Rollbacks in the Load Profile section when these values are multiplied by a value of 60. This can then be used to compare with other Oracle specific metrics such as redo size and logical reads.
Load Profile
Per Second
Per Transaction
Per Exec
Per Call
DB Time(s):
151.2
0.0
0.00
0.00
DB CPU(s):
124.9
0.0
0.00
0.00
Background CPU(s):
0.0
0.0
0.00
0.00
Redo size (bytes):
862,578,321.3
5,390.2
Logical read (blocks):
10,369,967.8
64.8
Block changes:
5,009,042.8
31.3
Physical read (blocks):
498.8
0.0
Physical write (blocks):
23.6
0.0
Read IO requests:
329.7
0.0
Write IO requests:
2.2
0.0
Read IO (MB):
6.8
0.0
Write IO (MB):
0.2
0.0
IM scan rows:
0.0
0.0
Session Logical Read IM:
0.0
0.0
User calls:
122,685.1
0.8
Parses (SQL):
74,085.2
0.5
Hard parses (SQL):
0.0
0.0
SQL Work Area (MB):
155.9
0.0
Logons:
0.0
0.0
User logons:
0.0
0.0
Executes (SQL):
3,303,622.1
20.6
Rollbacks:
270.4
0.0
Transactions:
160,026.2
Oracle AWR Report Load Profile
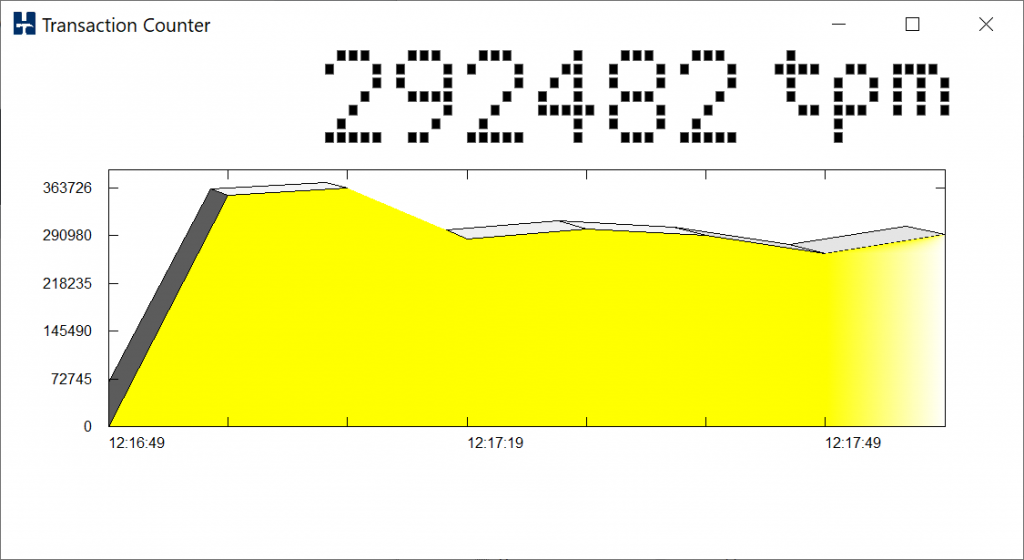
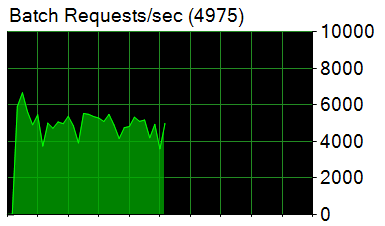
Similarly for SQL Server TPM records Batches/sec which is the same value seen in the Activity Monitor in SSMS. Using the database specific metric means that we can sample the transaction rate in real time for the HammerDB transaction counter whereas doing so for the NOPM value would impact the test by reading from a table being modified during the test. It can be seen from the example below that the HammerDB Transaction Counter
Transaction Counter
reports the same data per minute as Activity Monitor reports per second and can therefore be related directly to the other data that Activity Monitor provides such as Database I/O.
Activity Monitor
Refactoring Differences
When using HammerDB v4.0 the notable differences between TPM and NOPM rates than can be observed are as follows:
SQL Server
For SQL Server note that a change in the TPM metric was introduced at v3.3 and continues into v4.0. Initially these releases were planned close together however v4.0 was delayed to introduce UHD scalable graphics. The key difference is that in v3.2 the TPM value is reported as 2X the value of v4.0 (and v3.3) due to a change in the SQL Server driver interface used. The reason for the change was that there was a bug raised for the previous ODBC v1 interface tclodbc the bug meant that the 3rd party library would crash if SQL Server was shutdown during a test and then the Virtual Users subsequently closed after they had correctly reported the error. The fix to this was to move to a newer ODBCv3 interface called tdbc::odbc. The previous tclodbc interface required 2 commits per transaction one in the stored procedure and one outside in the driver script. If the external one was removed or commented then the driver would error saying that the connection was already in use by a previous command. Moving to the newer interface this external commit was no longer needed and was removed, as a result the TPM value has reduced however the NOPM value is exactly the same. (From tests it should be slightly higher with the newer ODBC v3 interface). It is important to note that as far as the HammerDB TPROC-C workload is concerned it is not doing any more work as such – just doing one less commit for the same work. If you compare the driver scripts for the different versions you can observe where the extra commit that was removed. For comparisons with previous releases NOPM can be used unmodified as the primary metric or the TPM value multiplied by 2X to account for the removed commit.
Oracle
For Oracle from v4.0 the stored procedures have been updated to use bulk processing features. As we are now doing bulk operations we are processing more changes per database commit and this can seen in an AWR report that the redo generated per transaction has also increased from v3.3 to v4.0. For this reason the NOPM value has increased whilst the TPM value has remained level, therefore the TPM to NOPM ratio has changed for Oracle between these releases. This has been measured at 3.0X TPM to NOPM for v3.3 and earlier but has reduced to 2.11X for v4.0. Therefore HammerDB v4.0 improves the Oracle performance by approximately 1.35-1.45X measured in NOPM for the same TPM. This improvement in NOPM is a recognition of actual improved TPROC-C transactional throughput by using advanced PL/SQL features.
PostgreSQL
The PostgreSQL stored procedures and functions have undergone similar changes as Oracle to take advantage of bulk processing features. These changes have improved NOPM and TPM by approximately 1.35X in HammerDB v4.0 compared to previous releases and is also a recognition of the use of more advanced features.
In conclusion in v4.0 HammerDB has undergone a number of evolutionary changes for some of the database workloads that impact performance results when compared to earlier versions. These differences should be accounted for when comparing results. Although the aim is to keep performance as consistent as possible between releases wherever possible as some databases had introduced new features or newer more advanced interfaces were available it was considered reasonable to modify the stored procedures or use these new interfaces to use available features even though reported results are different in the newer version.
It is also important to note that HammerDB is open source and therefore if it is considered that there are underused features in any of the supported databases then a pull request can be made to ensure that those features are fairly represented in the results reported by HammerDB. The overall goal is to remain consistent as possible whilst providing an accurate representation of the capabilities that each supported database provides as their features are updated and improved.