With pull requests Dependency build automation for Linux #323 and Dependency build automation for Windows #362 HammerDB has enabled the user to build their own full distribution of HammerDB from source on Linux x64 and Windows x64 with a single command. This post explains how you can build your own distribution.
Do you need to build from source?
Before building from source, the first question should be, do you need to? HammerDB already provides pre-compiled packages from the download page so if you want to run HammerDB without building it then these packages are all you need.
WHY build from source?
If you are not already familiar with the programming languages that HammerDB uses, then this earlier post serves as an ideal introduction to what makes up the highest performing GIL free database benchmarking application.
What programming languages does HammerDB use and why does it matter?
You may want to become familiar with all the underlying source code in C or wish to build a distribution where you can verify every single line of source code that goes into HammerDB. All of the source code and dependencies in HammerDB are open source right down to the layer above any 3rd party commercial database drivers for Oracle, SQL Server and Db2. Building from source also enables you to build a distribution right up to date with any of the latest pull requests not yet included in the most recent HammerDB release.
BAWT by Paul Obermeier
HammerDB build automation uses an adapted version of the BAWT package by Paul Obermeier . BAWT is copyrighted by Paul Obermeier and distributed under the 3-clause BSD license.
GETTING STARTED ON LINUX
If you have read what programming languages HammerDB uses, then you will not be too surprised that you will firstly need to install a development environment using the gcc compiler for Linux. You will also need the p7zip tool as well as the Xft font library development packages. The build has been tested on x64 Red Hat 8.X and Ubuntu 20.04.X Linux, with the following example from Red Hat Linux.
yum install p7zip-16.02-20.el8.x86_64.rpm
sudo yum install libXft-devel
yum group install "Development Tools"
The HammerDB Oracle and ODBC for SQL Server client libraries will build without the respective Oracle and SQL Server client libraries, but will need them at runtime. However, the client or server must be installed for all of Db2, MariaDB, PostgreSQL and MySQL for the HammerDB build to be successful. The database installation must include both the include and lib directories.
For Db2 either the server or client can be installed, for example v11.5.7_linuxx64_server_dec.tar.gz.
HammerDB build automation will look for the Db2 installation in the location of the environment variable IBM_DB_DIR set using db2profile tool. Verify that this has been set as follows:
$ echo $IBM_DB_DIR
/home/ibm/sqllib
On Linux MariaDB, PostgreSQL and MySQL include a config command in the bin directory that returns details of the configuration. HammerDB uses these commands to find the headers and libraries needed for the build.
Before running the build, environment variables MARIADB_CONFIG, PG_CONFIG and MYSQL_CONFIG must be set to the location of the respective config commands for each database in the terminal running the build.
$ export MARIADB_CONFIG=/opt/mariadb/mariadb-10.6.7-linux-systemd-x86_64/bin
$ export PG_CONFIG=/opt/postgresql/bin
$ export MYSQL_CONFIG=/opt/mysql/mysql-8.0.28-linux-glibc2.12-x86_64/bin
GETTING STARTED ON WINDOWS
On Windows, download and install Visual Studio 2022 , Visual Studio is free for open source developers. An additional gcc compiler will be downloaded and installed locally during the build. The build has been tested on x64 Windows 10 and 11.
As with Linux it is also mandatory to install a database server or client including the development environment of headers and libraries for MariaDB, Db2, MySQL and PostgreSQL.
For Db2 on Windows, there is no db2profile that sets the environment therefore the IBM_DB_DIR environment variable must be set to the location of the Db2 install. Similarly, the MariaDB and MySQL config commands are not available on Windows either and should also be set to the database or client installation directory rather than the bin directory. PostgreSQL for Windows does include the config command and therefore the environment configuration is the same as Linux.
set MARIADB_CONFIG=C:\Program Files\MariaDB\MariaDB Connector C 64-bit
set MYSQL_CONFIG=C:\Program Files\MySQL\MySQL Server 8.0
set PG_CONFIG=C:\Program Files\PostgreSQL\pgsql\bin
set IBM_DB_DIR=C:\Program Files\IBM\SQLLIB
For all database installations on Windows whether client or server verify that the installation has the include, bin and lib directories. On Windows in particular, some installations may not include all the required files for development.
Download HAMMERDB SOURCE
At this stage you will have installed the compiler you need and database client/server installations for MariaDB, Db2, MySQL and PostgreSQL. To reiterate, HammerDB will not build correctly unless you have installed ALL the required database environments.
Next download HammerDB from gitHub by either cloning or downloading. From the main HammerDB GitHub page use the clone URL or the Download Zip link from the master branch.
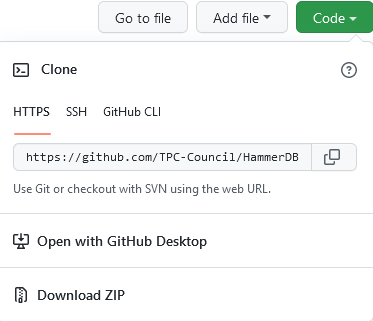
$ git clone https://github.com/TPC-Council/HammerDB.git
Cloning into 'HammerDB'...
remote: Enumerating objects: 8099, done.
remote: Total 8099 (delta 0), reused 0 (delta 0), pack-reused 8099
Receiving objects: 100% (8099/8099), 40.41 MiB | 8.39 MiB/s, done.
Resolving deltas: 100% (2564/2564), done.
If cloning you will have a directory called “HammerDB” or extracting the zipfile a directory called “HammerDB-master”.
RUNNING THE BUILD
Navigate to the Build\Bawt-2.1.0 directory with the command line for both Linux and Windows. Note that during the build an InputLibs directory will be created and all HammerDB libraries downloaded and under the Build directory a BawtBuild directory will be created where the installation will take place. Therefore, sufficient disk space and permissions must be available for the build to take place.
Within the command line you are running the build make sure that you have correctly set all the MARIADB_CONFIG, MYSQL_CONFIG, PG_CONFIG, and IBM_DB_DIR environment variables used during the build and run the Build-Linux.sh command for Linux ./Build-Linux.sh x64 Setup/HammerDB-Linux.bawt update and Build-Windows.bat commands for Windows ./Build-Windows.bat x64 vs2022+gcc Setup/HammerDB-Windows.bawt update, the command sequence will look similar to the following on Linux:
$ export MYSQL_CONFIG=/opt/mysql-8.0.20-linux-glibc2.12-x86_64/bin
$ export MARIADB_CONFIG=/opt/mariadb-10.8.1-linux-x86_64/bin/
$ export PG_CONFIG=/opt/postgresql-14.1/bin
$ echo $IBM_DB_DIR
/opt/ibm/sqllib
$ ./Build-Linux.sh x64 Setup/HammerDB-Linux.bawt update
and the following on Windows:
set MARIADB_CONFIG=C:\Program Files\MariaDB\MariaDB Connector C 64-bit
set MYSQL_CONFIG=C:\Program Files\MySQL\MySQL Server 8.0
set PG_CONFIG=C:\Program Files\PostgreSQL\pgsql\bin
set IBM_DB_DIR=C:\Program Files\IBM\SQLLIB
Build-Windows.bat x64 vs2022+gcc Setup\HammerDB-Windows.bawt update
The first step the build will take is to download the required packages and build instructions from www.hammerdb.com, On Windows the MYSYS/MinGW package will also be downloaded. These will be stored in the Bawt-2.1.0/InputLibs directory. Both checksums and modification times are verified with the remote packages. If a package is already present with the same checksum and modification time, it will not be downloaded again if already present. Also some packages such as Tcl have been modified from the original and therefore only the packages from www.hammerdb.com should be used.
awthemes-9.3.1.7z  libressl-2.6.4.7z  pgtcl-2.1.1.7z Tk-8.6.12.7z
awthemes.bawt      libressl.bawt      pgtcl.bawt        Tk.bawt
clearlooks-1.0.7z  mariatcl-0.1.7z    redis-0.1.7z tkblt-3.2.23.7z
clearlooks.bawt    mariatcl.bawt      redis.bawt        tkblt.bawt
db2tcl-2.0.1.7z    mysqltcl-3.052.7z  Tcl-8.6.12.7z tksvg-0.5.7z
db2tcl.bawt        mysqltcl.bawt      Tcl.bawt          tksvg.bawt
expect-5.45.4.7z   oratcl-4.6.7z      tcltls-1.7.22.7z
expect.bawt        oratcl.bawt        tcltls.bawt
Allow the build to complete. A summary will be given of the packages built and the location of the build given, for example for Linux as follows:
14:27:08 > Creating Distribution tar.gz in /opt/HammerDB/Build/BawtBuild/Linux/x64/Release/Distribution
14:27:08 >   TarGzip
               Source directory: /opt/HammerDB/Build/BawtBuild/Linux/x64/Release/Distribution/HammerDB-4.4
               Tar file        : /opt/HammerDB/Build/BawtBuild/Linux/x64/Release/Distribution/HammerDB-4.4-Linux.tar.gz
14:27:09 > End FinalizeStage

14:27:09 > Summary
           Setup file     : /opt/HammerDB/Build/Bawt-2.1.0/Setup/HammerDB-Linux.bawt
           Build directory: /opt/HammerDB/Build/BawtBuild/Linux/x64/Release/Build
           Architecture   : x64
           Compilers      : gcc
           Global stages  : Finalize
           #  : Library Name         Version    Build time Stages
----------------------------------------------------------------------
             1: Tcl                  8.6.12     1.52 minutes Clean Extract Configure Compile Distribute
             2: Tk                   8.6.12     0.36 minutes Clean Extract Configure Compile Distribute
             3: awthemes             9.3.1      0.00 minutes Clean Extract Configure Compile Distribute
             4: clearlooks           1.0        0.00 minutes Clean Extract Configure Compile Distribute
             5: db2tcl               2.0.1      0.10 minutes Clean Extract Configure Compile Distribute
             6: expect               5.45.4     0.12 minutes Clean Extract Configure Compile Distribute
             7: libressl             2.6.4      0.99 minutes Clean Extract Configure Compile Distribute
             8: mariatcl             0.1        0.04 minutes Clean Extract Configure Compile Distribute
             9: mysqltcl             3.052      0.04 minutes Clean Extract Configure Compile Distribute
            10: oratcl               4.6        0.05 minutes Clean Extract Configure Compile Distribute
            11: pgtcl                2.1.1      0.05 minutes Clean Extract Configure Compile Distribute
            12: redis                0.1        0.00 minutes Clean Extract Configure Compile Distribute
            13: tcltls               1.7.22     0.14 minutes Clean Extract Configure Compile Distribute
            14: tkblt                3.2.23     0.21 minutes Clean Extract Configure Compile Distribute
            15: tksvg                0.5        0.06 minutes Clean Extract Configure Compile Distribute
----------------------------------------------------------------------
           Total: 3.70 minutes
and for Windows:
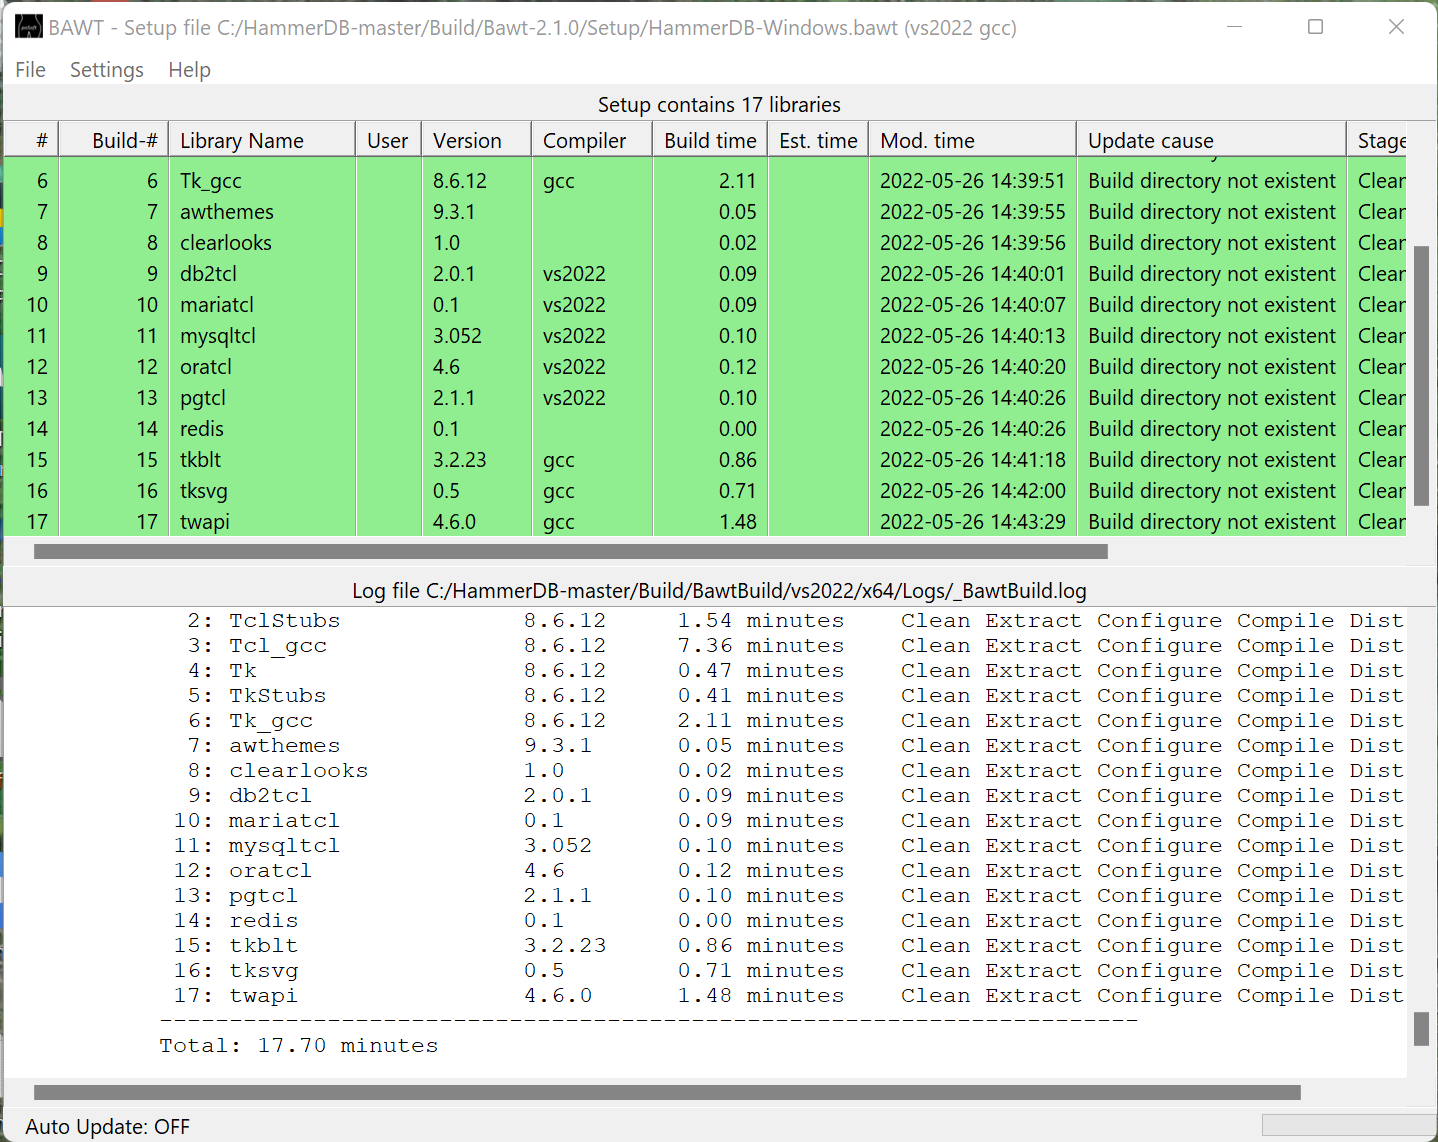
You now have your own distribution of HammerDB with the latest source code. You can run the hammerdbcli librarycheck command to verify that the libraries built correctly.
/opt/HammerDB/Build/BawtBuild/Linux/x64/Release/Distribution$ ls
HammerDB-4.4 HammerDB-4.4-Linux.tar.gz
$ cd HammerDB-4.4
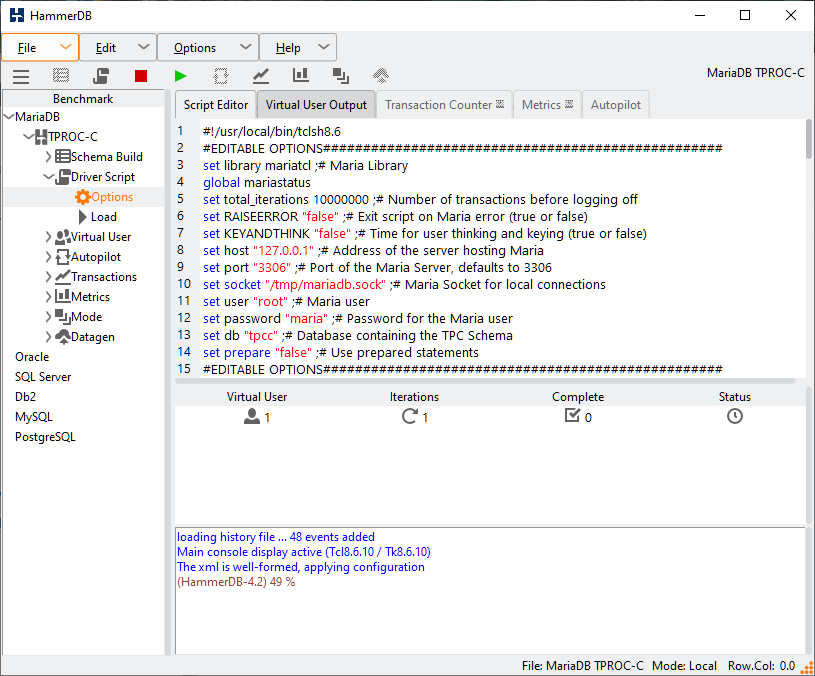
/opt/HammerDB/Build/BawtBuild/Linux/x64/Release/Distribution/HammerDB-4.4$ ./hammerdbcli
HammerDB CLI v4.4
Copyright (C) 2003-2022 Steve Shaw
Type "help" for a list of commands
hammerdb>librarycheck
Checking database library for Oracle
Success ... loaded library Oratcl for Oracle
Checking database library for MSSQLServer
Success ... loaded library tdbc::odbc for MSSQLServer
Checking database library for Db2
Success ... loaded library db2tcl for Db2
Checking database library for MySQL
Success ... loaded library mysqltcl for MySQL
Checking database library for PostgreSQL
Success ... loaded library Pgtcl for PostgreSQL
Checking database library for MariaDB
Success ... loaded library mariatcl for MariaDB
You can also browse all of the C source code for the libraries you have built in the Build directory.
/opt/HammerDB/Build/BawtBuild/Linux/x64/Release/Build
VERIFYING DEPENDENT LIBRARIES
Having built the distribution yourself it should be clear that as the database libraries are dynamically linked when you install the distribution on another system you will also need to install the database clients on that system.
For example on Linux we have a check that fails because the MariaDB libraries cannot be found and we can verify this with the ldd command.
hammerdb>librarycheck
...
Checking database library for MariaDB
Error: failed to load mariatcl - couldn't load file "/opt/HammerDB/Build/BawtBuild/Linux/x64/Release/Distribution/HammerDB-4.4/lib/mariatcl0.1/libmariatcl0.1.so": libmariadb.so.3: cannot open shared object file: No such file or directory
Ensure that MariaDB client libraries are installed and the location in the LD_LIBRARY_PATH environment variable

$ ldd libmariatcl0.1.so
    linux-vdso.so.1 (0x00007ffd534db000)
    libmariadb.so.3 => not found
    libc.so.6 => /lib/x86_64-linux-gnu/libc.so.6 (0x00007f259d2f9000)
    /lib64/ld-linux-x86-64.so.2 (0x00007f259d513000)
When we install this dependent library and tell HammerDB where to find it:
export LD_LIBRARY_PATH=/opt/mariadb-10.2.34-linux-x86_64/lib:$LD_LIBRARY_PATH
HammerDB will correctly load the MariaDB package.
$ ldd libmariatcl0.1.so
    linux-vdso.so.1 (0x00007ffc6214d000)
    libmariadb.so.3 => /opt/mariadb-10.2.34-linux-x86_64/lib/libmariadb.so.3 (0x00007f3e028c9000)
    libc.so.6 => /lib/x86_64-linux-gnu/libc.so.6 (0x00007f3e026bd000)
    libpthread.so.0 => /lib/x86_64-linux-gnu/libpthread.so.0 (0x00007f3e0269a000)
    libdl.so.2 => /lib/x86_64-linux-gnu/libdl.so.2 (0x00007f3e02694000)
    libm.so.6 => /lib/x86_64-linux-gnu/libm.so.6 (0x00007f3e02545000)
    /lib64/ld-linux-x86-64.so.2 (0x00007f3e02cd2000)

hammerdb>librarycheck
...
Checking database library for MariaDB
Success ... loaded library mariatcl for MariaDB
For an example Windows this time we cannot load the MySQL library.
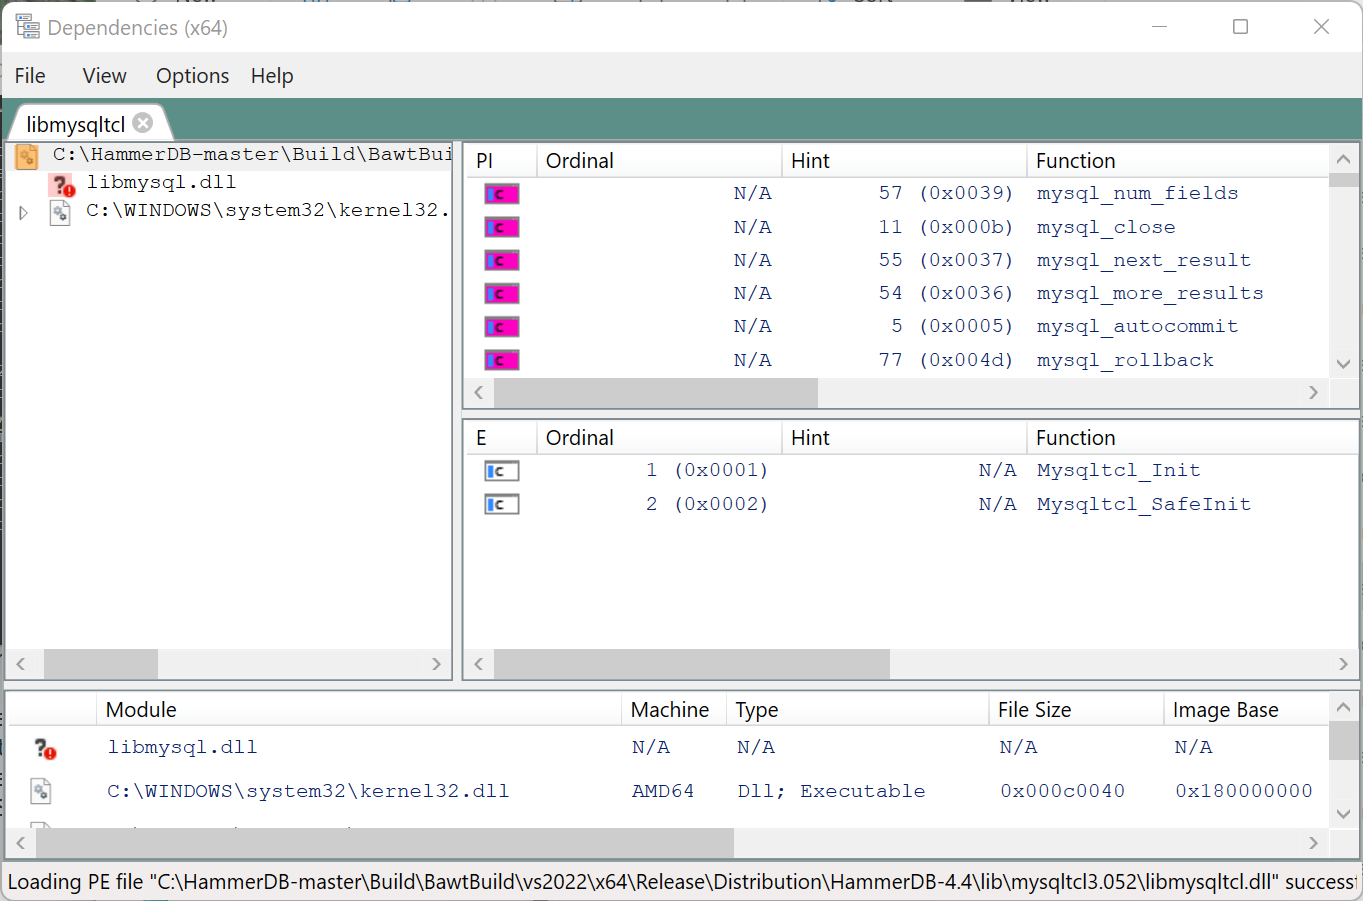
HammerDB CLI v4.4
Copyright (C) 2003-2022 Steve Shaw
Type "help" for a list of commands
hammerdb>librarycheck
...
Checking database library for MySQL
Error: failed to load mysqltcl - couldn't load library "C:/HammerDB-master/Build/BawtBuild/vs2022/x64/Release/Distribution/HammerDB-4.4/lib/mysqltcl3.052/libmysqltcl.dll": No error
Ensure that MySQL client libraries are installed and the location in the PATH environment variable
hammerdb>
We run the DependenciesGui from the dependencies tool, load libmysqltcl.dll and it shows we cannot find libmysql.dll.
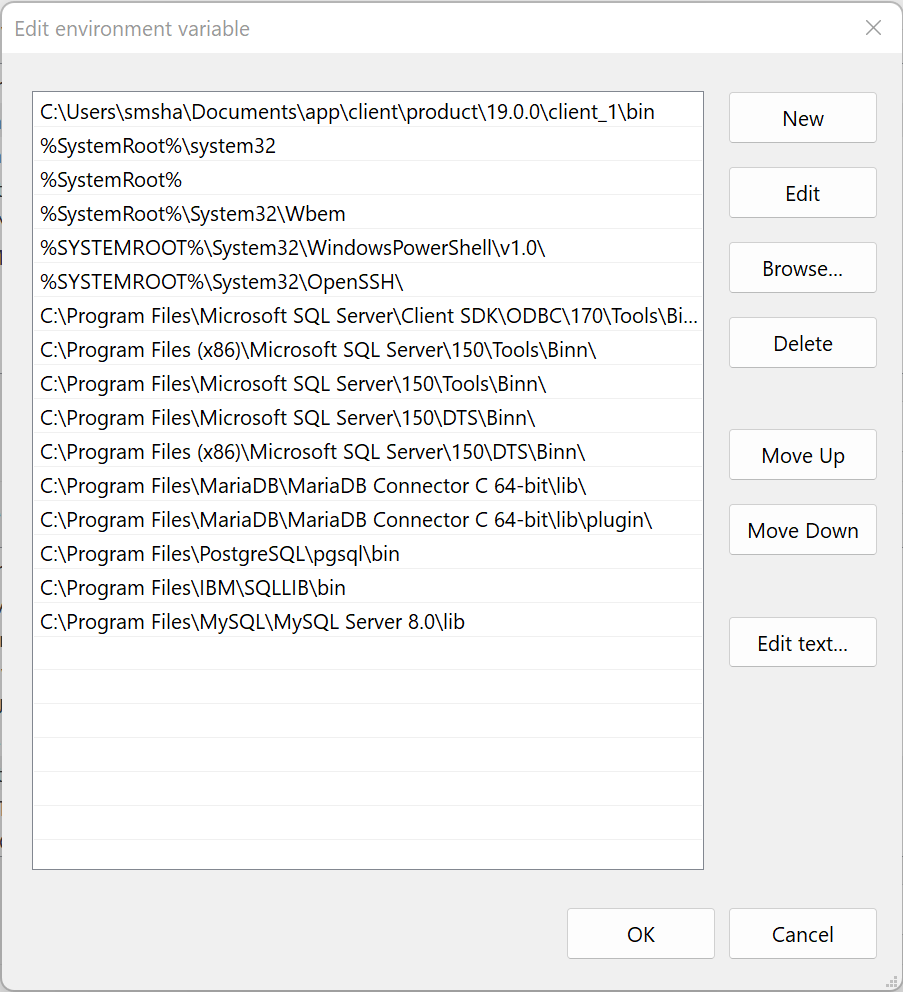
After installing MySQL we set the environment variable to find the library.
and verify with the Dependencies GUI that now all dependencies can be found.
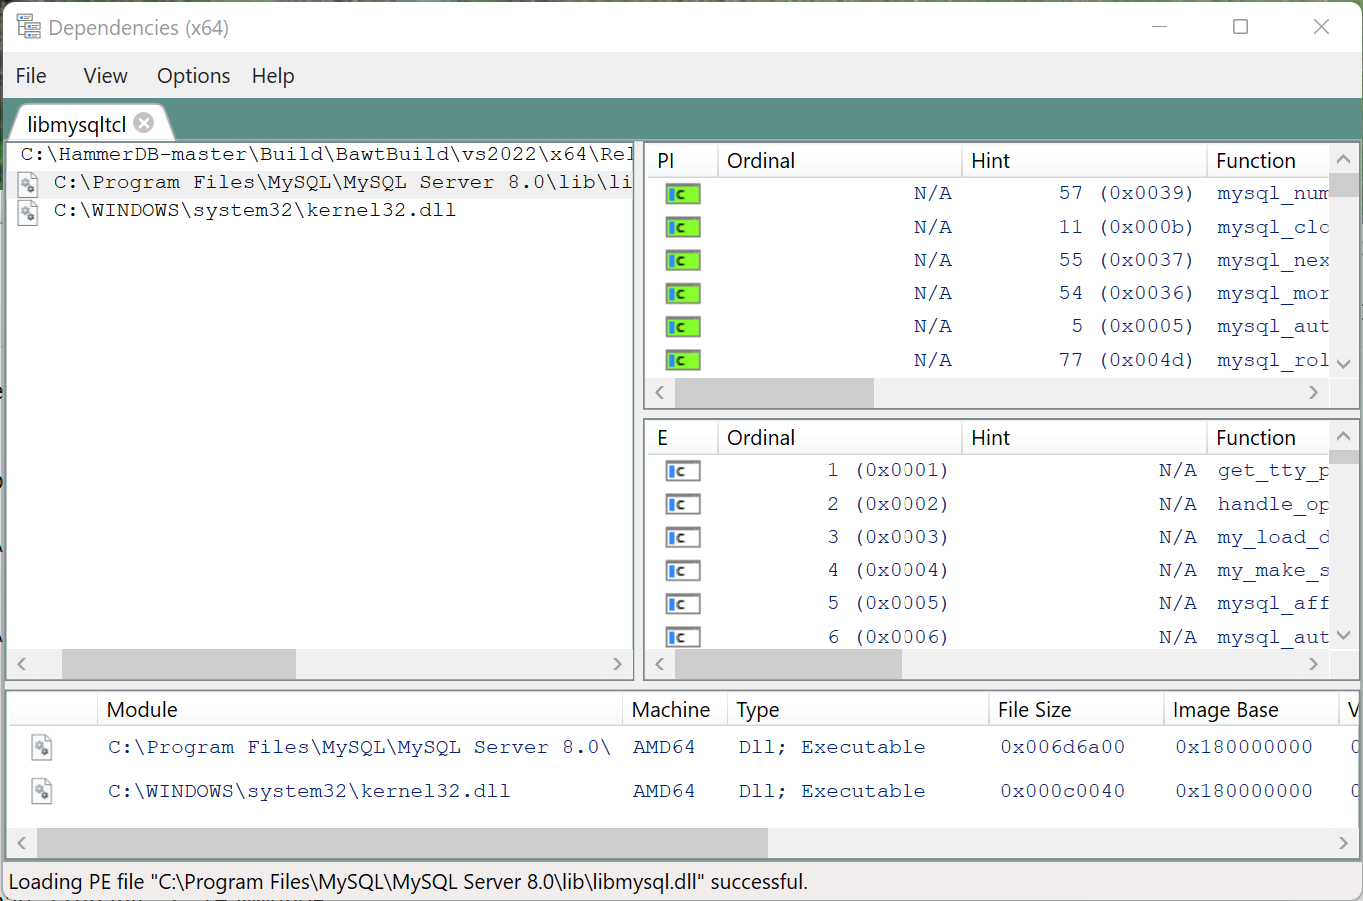
We can now confirm that the MySQL package can be correctly loaded.
HammerDB CLI v4.4
Copyright (C) 2003-2022 Steve Shaw
Type "help" for a list of commands
hammerdb>librarycheck
Checking database library for Oracle
Success ... loaded library Oratcl for Oracle
Checking database library for MSSQLServer
Success ... loaded library tdbc::odbc for MSSQLServer
Checking database library for Db2
Success ... loaded library db2tcl for Db2
Checking database library for MySQL
Success ... loaded library mysqltcl for MySQL
Checking database library for PostgreSQL
Success ... loaded library Pgtcl for PostgreSQL
Checking database library for MariaDB
Success ... loaded library mariatcl for MariaDB
hammerdb>
SUMMARY
You have now learnt how to build your own HammerDB from source. This gives you access to all of the source code and see how HammerDB is built for a released distribution to enable you to build your own.