HammerDB doesn’t publish competitive database benchmarks, instead we always encourage people to be better informed by running their own. Nevertheless in this blog sometimes we do publish performance data to highlight best practices or potential configuration pitfalls and although we’ve mentioned this one before it is worth dedicating an entire post to it as this issue seems to appear numerous times running database workloads on Linux.
As noted previously the main developer of HammerDB is an Intel employee (#IAMINTEL) however HammerDB is a personal open source project and any opinions are my own, specific to the context of HammerDB as an independent personal project and not representing Intel.
So over at Phoronix some database benchmarks were published showing PostgreSQL 12 Performance With AMD EPYC 7742 vs. Intel Xeon Platinum 8280 Benchmarks
So what jumps out immediately here is the comment “The single-threaded PostgreSQL 12 performance was most surprising.” Usually when benchmark results are surprising it is a major hint that something could be misconfigured and that certainly seems the case here, so what could it be? Well its difficult to be entirely sure however the tests have all the characteristics of tests observed previously where the CPUs are running in powersave mode.
So lets take an Ubuntu system with Platinum 8280 CPUs with the following Ubuntu OS, reboot and check the CPU configuration before running any tests.
# uname -a
Linux ubuntu19 5.3.0-rc3-custom #1 SMP Mon Aug 12 14:07:33 UTC 2019 x86_64 x86_64 x86_64 GNU/Linux

Welcome to Ubuntu 19.04 (GNU/Linux 5.3.0-rc3-custom x86_64)
So by default, the system boots into powersave. You can see this by running the “cpupower frequency-info” command and checking the governor line. Note that this is also the case on the developer’s Ubuntu based laptop and therefore is a logical default where systems may be running on battery power. it is also extremely important to note that for Intel CPUs the driver must show “intel_pstate” if it doesn’t then either your kernel does not support the CPU or you have misconfigured BIOS settings. (Yes it is worth reiterating that for Intel CPUs the driver MUST show intel_pstate, if it doesn’t then something is set up wrong)
cpupower frequency-info
analyzing CPU 0:
driver: intel_pstate
CPUs which run at the same hardware frequency: 0
CPUs which need to have their frequency coordinated by software: 0
maximum transition latency: Cannot determine or is not supported.
hardware limits: 1000 MHz - 4.00 GHz
available cpufreq governors: performance powersave
current policy: frequency should be within 1000 MHz and 4.00 GHz.
The governor "powersave" may decide which speed to use
within this range.
current CPU frequency: Unable to call hardware
current CPU frequency: 1.00 GHz (asserted by call to kernel)
boost state support:
Supported: yes
Active: yes
So after installing PostgreSQL 12.0 we can install and run the single-threaded pgbench fairly simply (as a single threaded test we verified that the scale factor does not impact the result).
./bin/createdb pgbench
./bin/pgbench -i -s \$SCALING_FACTOR pgbench
./bin/pgbench -c 1 -S -T 60 pgbench
starting vacuum...end.
transaction type: <builtin: select only>
scaling factor: 1000
query mode: simple
number of clients: 1
number of threads: 1
duration: 60 s
number of transactions actually processed: 1377426
latency average = 0.044 ms
tps = 22957.058444 (including connections establishing)
tps = 22957.628615 (excluding connections establishing)
As this result is pretty lacklustre, lets check the frequency that the CPU is running at using the turbostat command. Note that turbostat will show you the maximum frequency your system can run out depending on how many cores are utilised. Therefore in this case for a single-threaded workload we should be able to run up to 4GHz depending on what else is running at the time.
# ./turbostat
turbostat version 18.07.27 - Len Brown <lenb@kernel.org></lenb@kernel.org>
CPUID(0): GenuineIntel 0x16 CPUID levels; 0x80000008 xlevels;
...
33 * 100.0 = 3300.0 MHz max turbo 28 active cores
35 * 100.0 = 3500.0 MHz max turbo 24 active cores
37 * 100.0 = 3700.0 MHz max turbo 20 active cores
37 * 100.0 = 3700.0 MHz max turbo 16 active cores
37 * 100.0 = 3700.0 MHz max turbo 12 active cores
37 * 100.0 = 3700.0 MHz max turbo 8 active cores
38 * 100.0 = 3800.0 MHz max turbo 4 active cores
40 * 100.0 = 4000.0 MHz max turbo 2 active cores
...
Now running turbostat while pgbench is running we can see one core is busy, however it is only running at an average of 2.7 – 2.8 GHz over the snapshot time with a couple of examples below.
Package Core CPU Avg_MHz Busy% Bzy_MHz TSC_MHz
      0    1   1    2784 73.00    3823    2694
--
      0    4   4    2864 74.83    3834    2696
Remember that you have configured the system to save power rather than performance so it will not be running anywhere near full potential. So lets switch the system to performance mode with one command.
./cpupower frequency-set --governor=performance
Setting cpu: 0
Setting cpu: 1
Setting cpu: 2
Setting cpu: 3
Setting cpu: 4
Setting cpu: 5
Setting cpu: 6
Setting cpu: 7
Setting cpu: 8
Setting cpu: 9
...
We can now see that the CPUs are set to performance mode.
./cpupower frequency-info
analyzing CPU 0:
driver: intel_pstate
CPUs which run at the same hardware frequency: 0
CPUs which need to have their frequency coordinated by software: 0
maximum transition latency: Cannot determine or is not supported.
hardware limits: 1000 MHz - 4.00 GHz
available cpufreq governors: performance powersave
current policy: frequency should be within 1000 MHz and 4.00 GHz.
The governor "performance" may decide which speed to use
within this range.
current CPU frequency: Unable to call hardware
current CPU frequency: 3.52 GHz (asserted by call to kernel)
boost state support:
Supported: yes
Active: yes
We don’t have to stop there, we can also change the energy performance bias setting to performance as well.
./x86_energy_perf_policy
cpu0: EPB 7
cpu0: HWP_REQ: min 10 max 40 des 0 epp 128 window 0x0 (0*10^0us) use_pkg 0
cpu0: HWP_CAP: low 7 eff 10 guar 27 high 40
cpu1: EPB 7
cpu1: HWP_REQ: min 10 max 40 des 0 epp 128 window 0x0 (0*10^0us) use_pkg 0
cpu1: HWP_CAP: low 7 eff 10 guar 27 high 40
cpu2: EPB 7
...

./x86_energy_perf_policy performance

./x86_energy_perf_policy
cpu0: EPB 0
cpu0: HWP_REQ: min 10 max 40 des 0 epp 128 window 0x0 (0*10^0us) use_pkg 0
cpu0: HWP_CAP: low 7 eff 10 guar 27 high 40
cpu1: EPB 0
cpu1: HWP_REQ: min 10 max 40 des 0 epp 128 window 0x0 (0*10^0us) use_pkg 0
cpu1: HWP_CAP: low 7 eff 10 guar 27 high 40
cpu2: EPB 0
cpu2: HWP_REQ: min 10 max 40 des 0 epp 128 window 0x0 (0*10^0us) use_pkg 0
cpu2: HWP_CAP: low 7 eff 10 guar 27 high 40
cpu3: EPB 0
Note how the EPB value changed from 7 to 0 to change the balance towards performance. It is also worth noting that C-states are an important part of balancing power and performance and in this case we leave them enabled.
./cpupower idle-info
CPUidle driver: intel_idle
CPUidle governor: menu
analyzing CPU 0:
Number of idle states: 4
Available idle states: POLL C1 C1E C6
So now lets see what we get in performance mode, an almost 32% improvement (and 53% higher than the published benchmarks).
./bin/pgbench -c 1 -S -T 60 pgbench
starting vacuum...end.
transaction type: <builtin: select only>
scaling factor: 1000
query mode: simple
number of clients: 1
number of threads: 1
duration: 60 s
number of transactions actually processed: 1815653
latency average = 0.033 ms
tps = 30260.836480 (including connections establishing)
tps = 30261.819189 (excluding connections establishing)
and turbostat tells us that we are running at almost 3.8GHz making it clear the reason for the performance gain. We asked the system to emphasise performance over power.
Package Core CPU Avg_MHz Busy% Bzy_MHz TSC_MHz
      0    0  56    3779 98.12    3860    2694
--
      0   25  22    3755 97.88    3846    2694
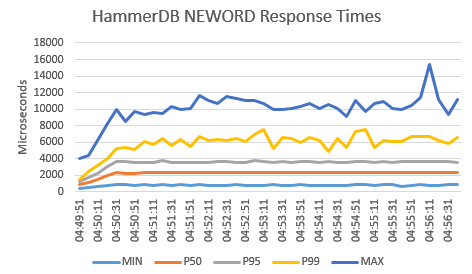
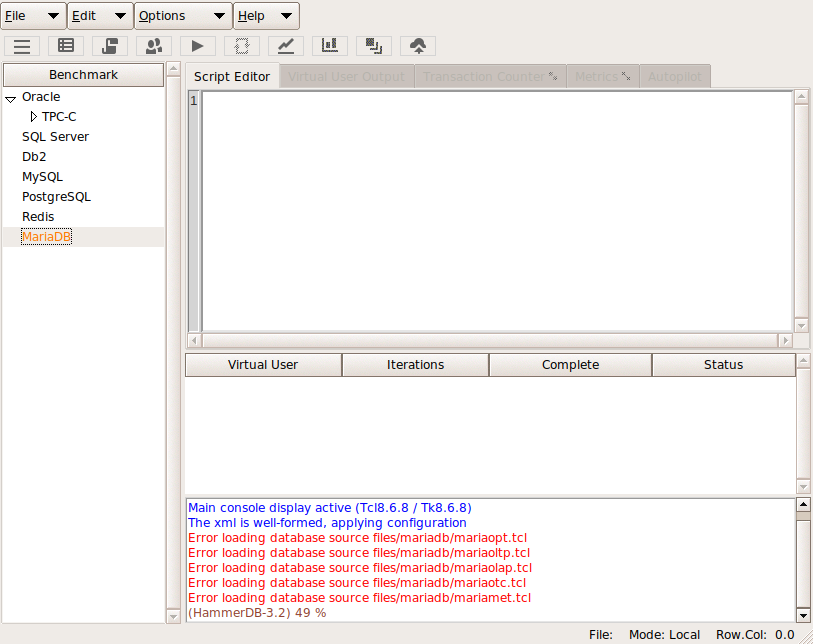
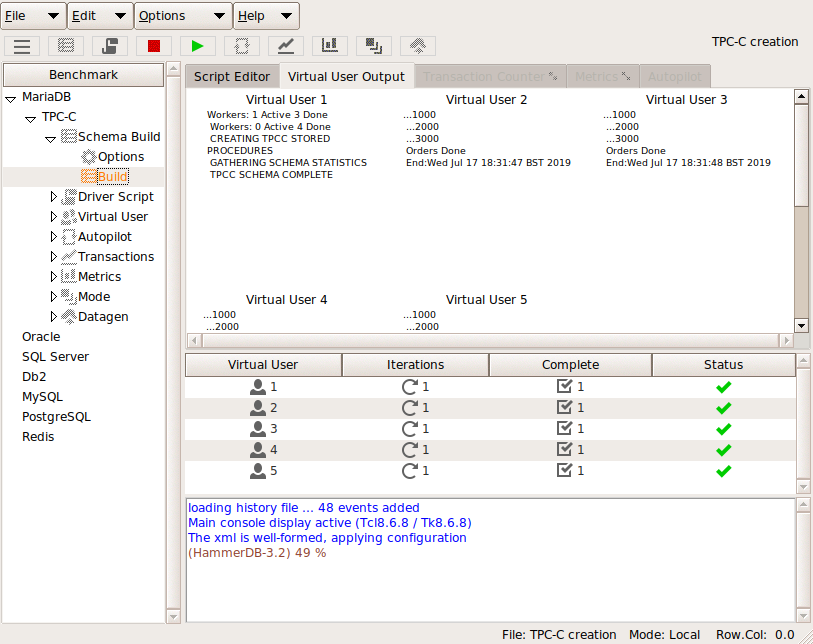
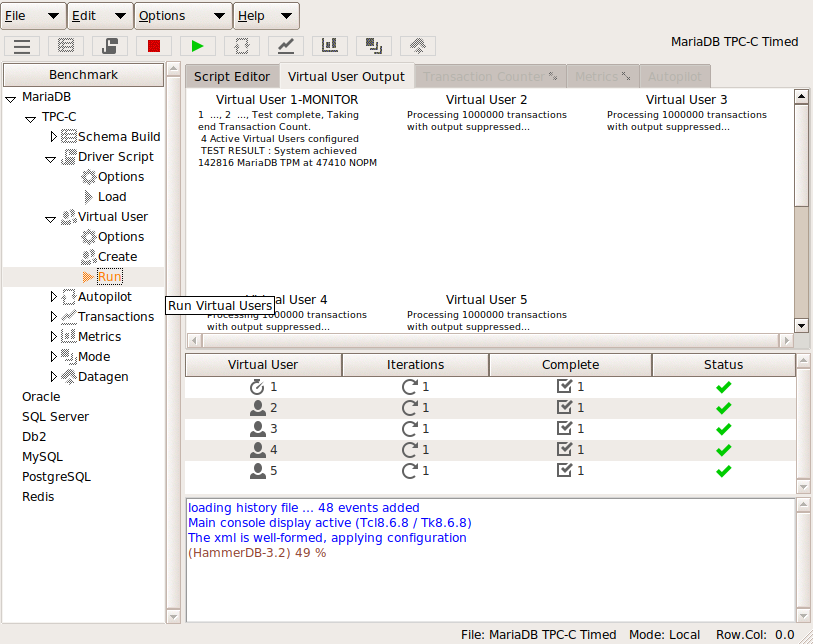
PgBench is based on TPC-B and there is an excellent post on what it is running here Do you know what you are measuring with pgbench? so instead to run a more enterprise based transactional workload we will run the HammerDB OLTP workload that is derived from TPC-C to see the overall impact of running transactional benchmarks in powersave mode.
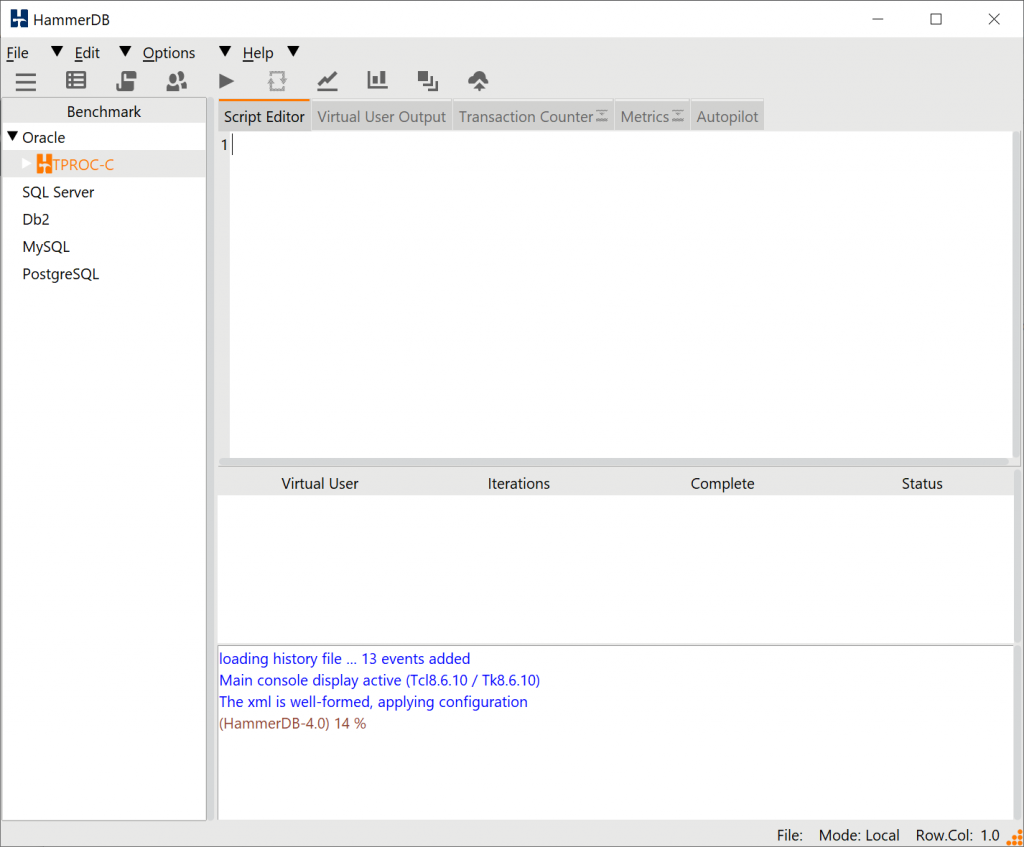
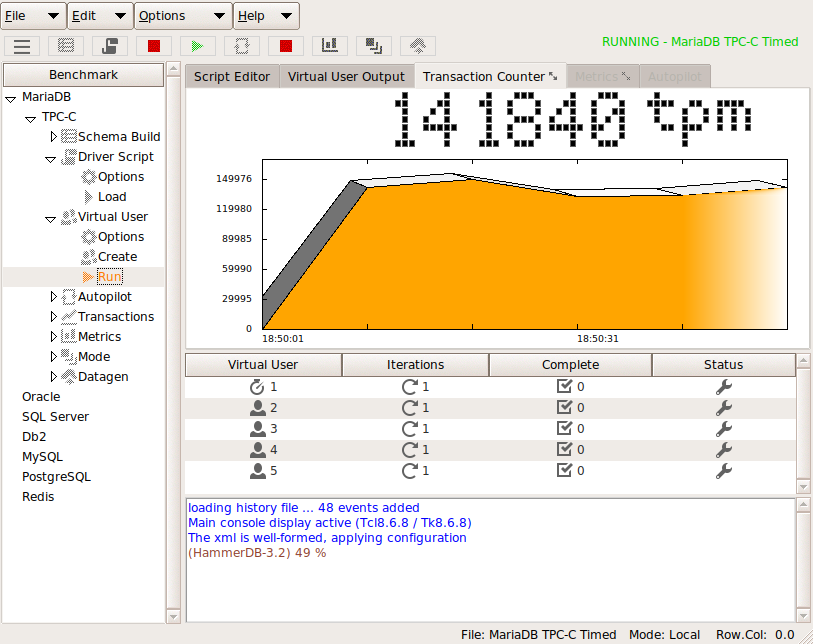
One of the most important aspects of running your own database benchmarks is that you can generate a performance profile this means that instead of taking a single data point as a measure of database performance you run a series of tests back-to-back increasing the virtual user count each time until you have reached maximum performance. HammerDB has the autopilot feature in the GUI or scripting in the command line to run these profiles unattended. So in this case we will do just that once in performance mode and once in powersave mode with the results shown below.
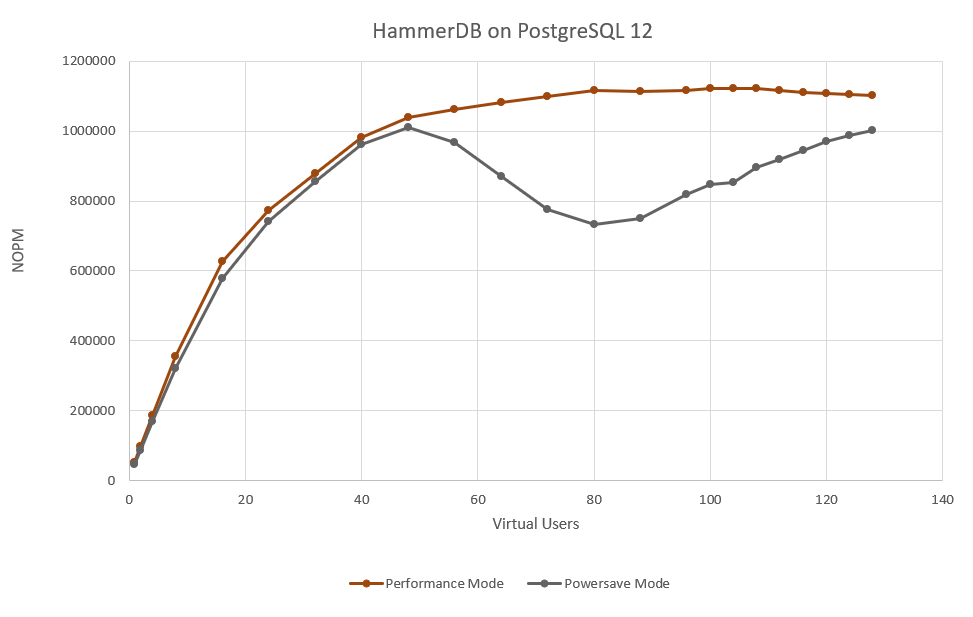
Clearly it is a good job we took the time to measure the full performance profile. Whereas in performance mode the results measured in NOPM reach a peak and then remain fairly constant in powersave mode we see the system throttle back performance with the balance towards saving power, exactly as the setting has asked it to do. Also note that this is not an either/or scenario and you can have multiple configurations in-between, however by default powersave is chosen.
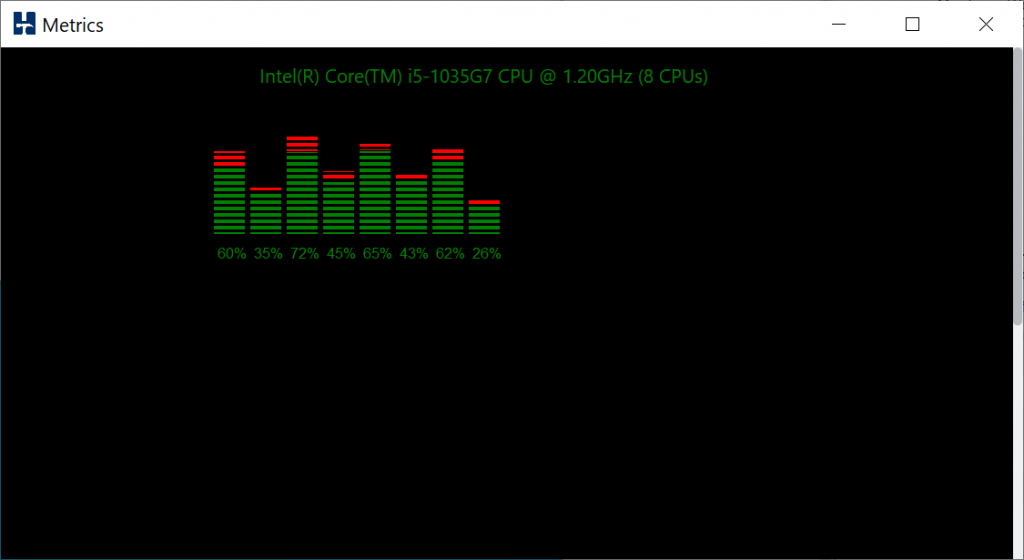
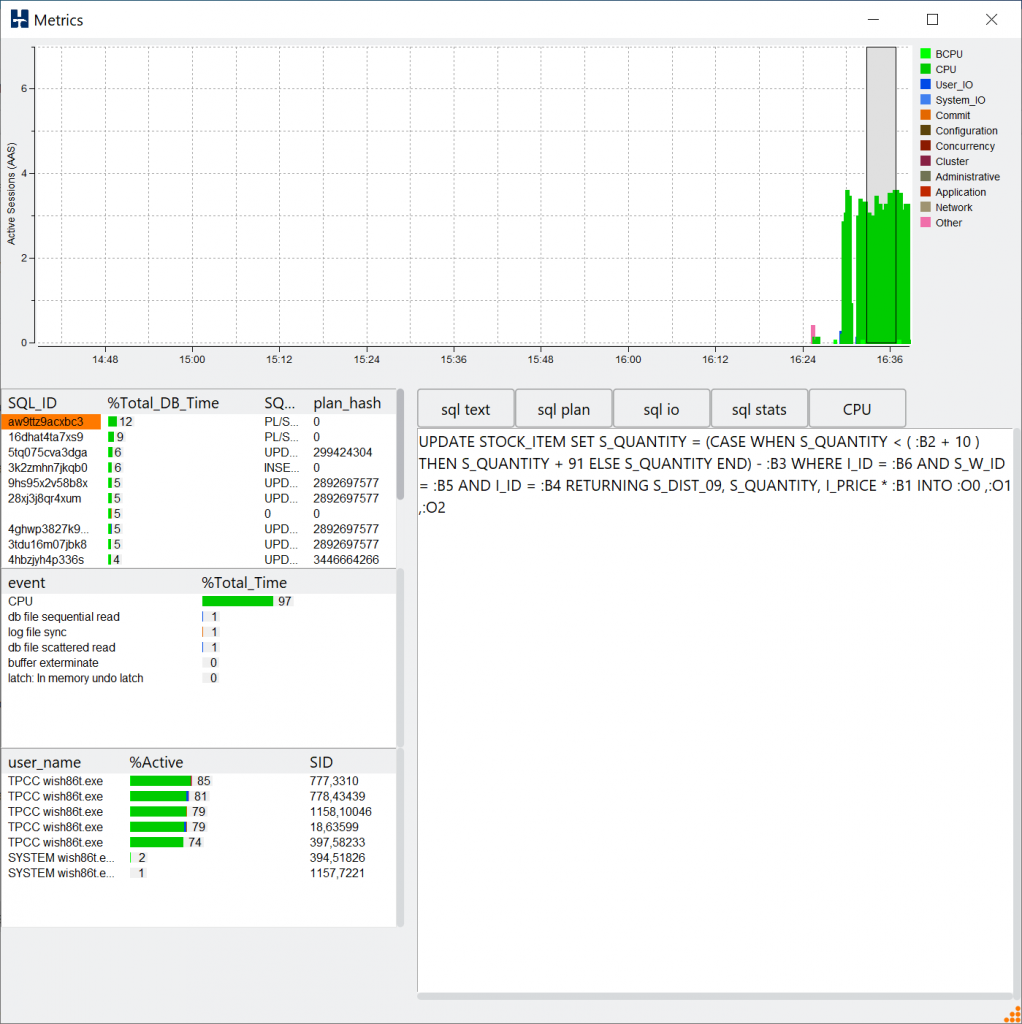
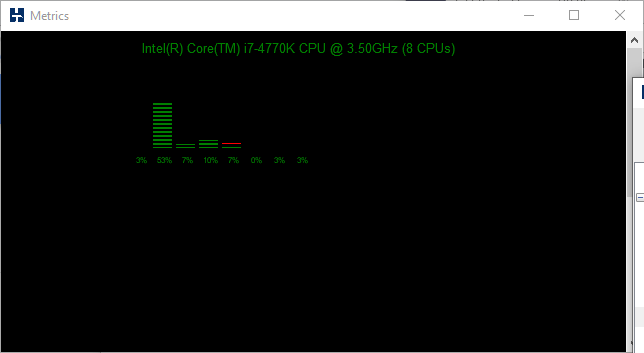
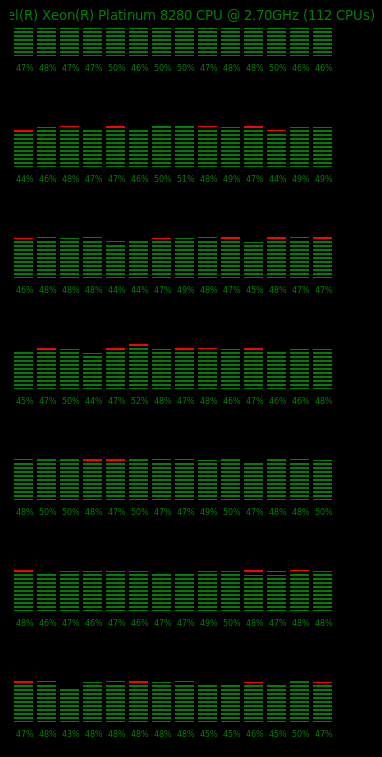
It is also important to note however that at the level of peak performance approached at 80 virtual users in this case. We are only seeing around 50% utilization across all of the CPUs in the system. The screenshot below of a subsection of the CPUs in the system (using the HammerDB metrics option in the GUI) shows that this is evenly distributed across all of the cores. As you increase the number of virtual users you increase the CPU utilization but don’t increase the throughput (NOPM), why is this?
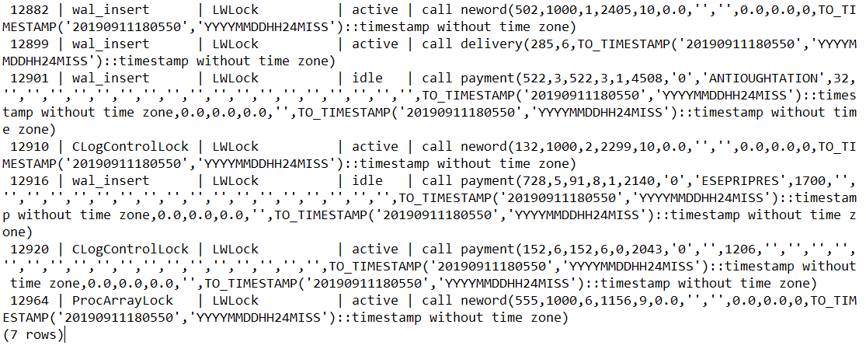
So is there a bottleneck in HammerDB or the TPC-C workload? The answer is no. HammerDB has a signficant advantage of being able to run on multiple databases allowing this sort of question again to be answered from your running your own tests. HammerDB and the TPC-C derived workload can achieve signficantly higher levels of throughput running at 95%+ CPU utilization with some of the commercial database software offerings. Instead in this case we are hitting the ceiling of PostgreSQL scalability for this type of transactional workload. There is also an excellent presentation on exactly this topic called Don’t Stop the World which is well worth reviewing to understand the limitations. If we review the workload we can see that PostgreSQL is spending most of its time in locking.
and at the CPU level we can see PostgreSQL is using the atomic operation cmpxchg

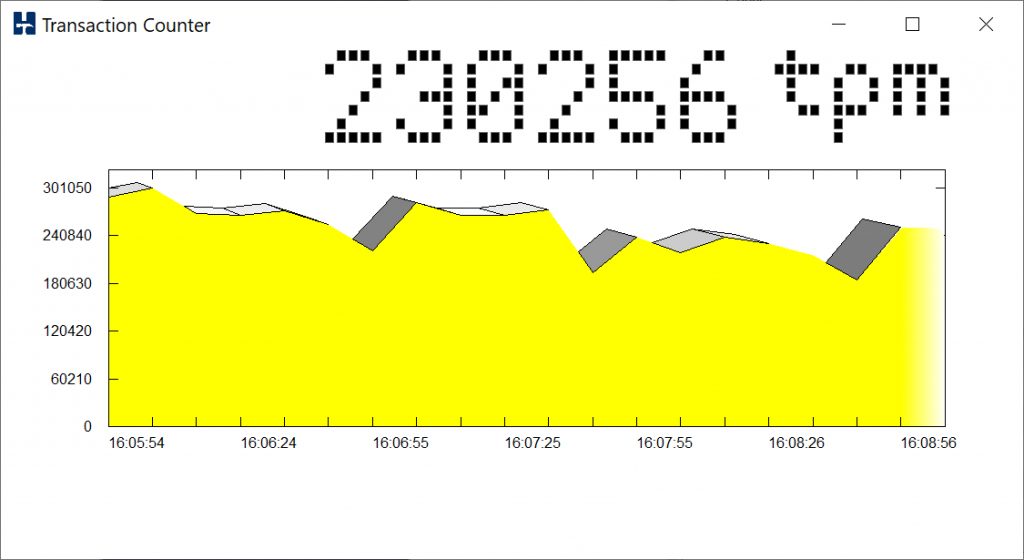
At this point PostgreSQL is already doing considerably more than 2M PostgreSQL TPM and 1M NOPM so the scability is already incredibly good. However it is clear that adding CPU resource beyond this point will only result in more time spent waiting in locking and will not improve performance for this intensive OLTP workload beyond a certain point. (It is always accepted that there may be options to tune the stored procedures or postgresql.conf for some gains, however this does impact the core argument around database scalability). Therefore it is especially important that you ensure that your CPUs are not running in powersave mode to see the maximum return on your configuration.
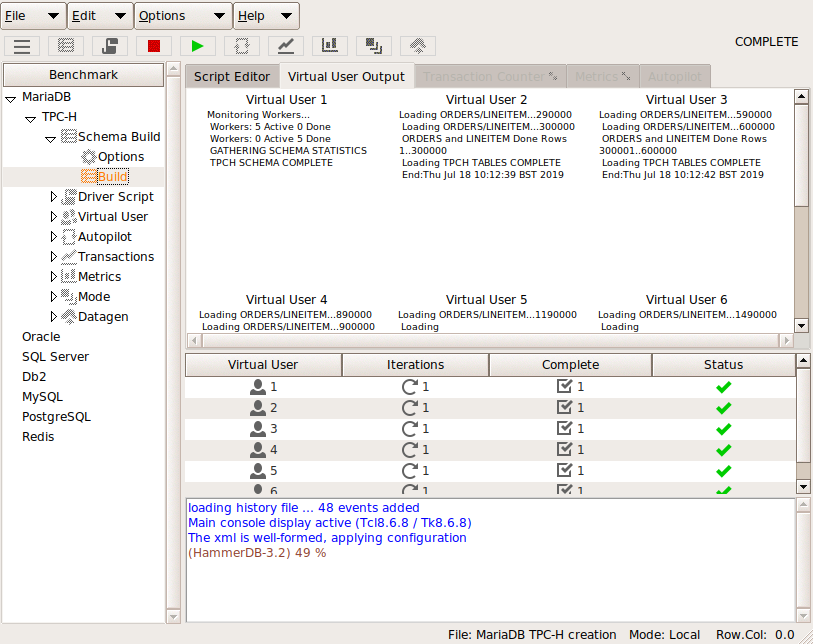
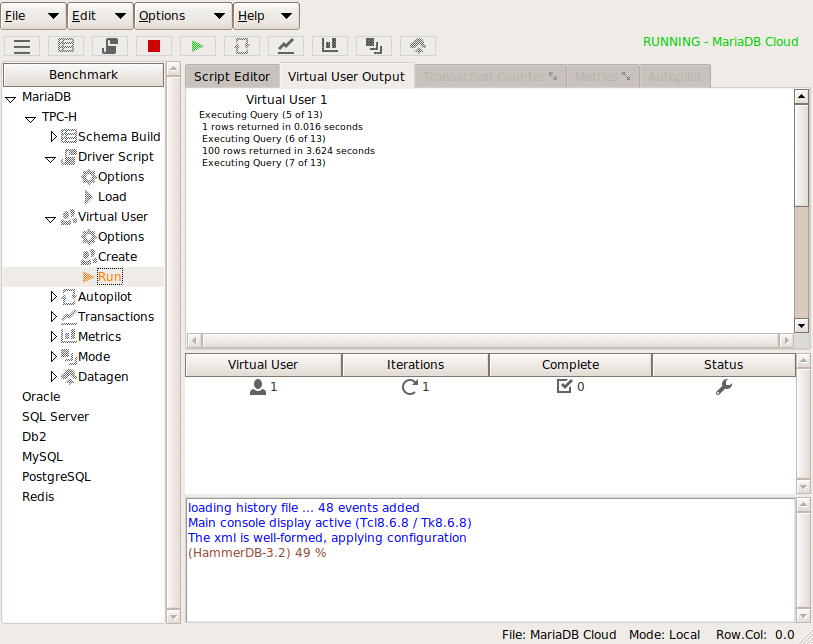
Finally it is worth noting that our focus has been on OLTP transactional workloads. However the CPU configuration advice applies equally to OLAP read only workloads. For these workloads HammerDB includes an implementation derived from the TPC-H benchmark to run complex ad-hoc analytic queries against a PostgreSQL database. In particular this is ideally suited to testing the PostgreSQL Parallel Query feature utilizing multiple cores for a single query and there is an example of this type of parallel query test here.
Benchmark on a Parallel Processing Monster!
But If we haven’t emphasised it enough, firstly whatever database benchmark you are running make sure that your CPUs are not configured to run in powersave mode.