HammerDB v4.0 New Features Pt3: Refactored Stored Procedures

Another key feature introduced with HammerDB v4.0 is the refactoring of the stored procedures for some of the TPROC-C workloads. This means that the performance metrics reported in NOPM/TPM could be different from previous releases as well as the ratio between NOPM and TPM for these workloads. Therefore results from v4.0 may not be directly comparable with the results from previous releases for your database. The reason for these changes is that over time for some databases more advanced features or drivers have been introduced that improve performance since the time that the original HammerDB transactions or interfaces were written. These changes were contributed and accepted into HammerDB v4.0.

NOPM vs TPM

Firstly it is important to understand the metrics NOPM, TPM and the difference between them. The TPROC-C workload is derived from the TPC-C workload, the primary metric for TPC-C is called tpmC, the number of new order transactions processed per minute. As HammerDB TPROC-C is a derived workload it is not permitted to use tpmC and therefore instead uses a metric called NOPM that records the number of new order transactions processed per minute. Although a similar metric to tpmC it is not considered to be directly comparable. From HammerDB v4.0 NOPM should be considered the primary metric and is the only one that should be used for a cross database comparison. For this reason from HammerDB v4.0 NOPM is printed first.

NOPM Primary Metric

However for backward compatibility the generic.xml configuration file contains an option called first_result, setting this to TPM will print the results in the same format as v3.3 and earlier.

<benchmark>
...
<first_result>TPM</first_result>
...
</benchmark>

So why not just print NOPM and report a single metric for TPROC-C as per the official TPC-C workloads? The key reason is that HammerDB is intended to give us more insights into database performance and whereas NOPM is a cross-database comparable metric TPM is a database specific metric that can give more details on the workload and be related to other database specific metrics but cannot be compared between different databases. For example for the Oracle database the TPM value is calculated from the number of user commits + user rollbacks and you can query these metrics in the v$sysstat table during the test. This metric is the same used in Oracle tools such as AWR reports and as shown the TPM metric captured by HammerDB is exactly the same as Transactions and Rollbacks in the Load Profile section when these values are multiplied by a value of 60. This can then be used to compare with other Oracle specific metrics such as redo size and logical reads.

Load Profile

Per SecondPer TransactionPer ExecPer Call
DB Time(s):151.20.00.000.00
DB CPU(s):124.90.00.000.00
Background CPU(s):0.00.00.000.00
Redo size (bytes):862,578,321.35,390.2  
Logical read (blocks):10,369,967.864.8  
Block changes:5,009,042.831.3  
Physical read (blocks):498.80.0  
Physical write (blocks):23.60.0  
Read IO requests:329.70.0  
Write IO requests:2.20.0  
Read IO (MB):6.80.0  
Write IO (MB):0.20.0  
IM scan rows:0.00.0  
Session Logical Read IM:0.00.0  
User calls:122,685.10.8  
Parses (SQL):74,085.20.5  
Hard parses (SQL):0.00.0  
SQL Work Area (MB):155.90.0  
Logons:0.00.0  
User logons:0.00.0  
Executes (SQL):3,303,622.120.6  
Rollbacks:270.40.0  
Transactions:160,026.2 
Oracle AWR Report Load Profile

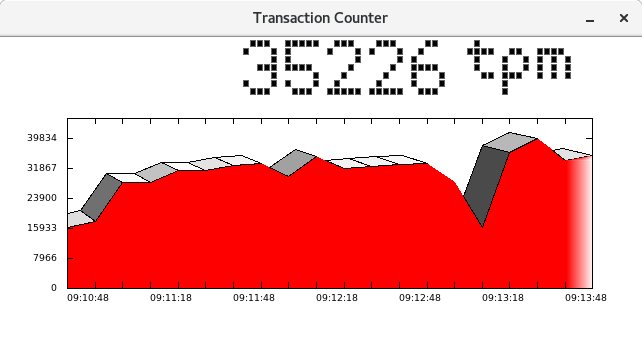
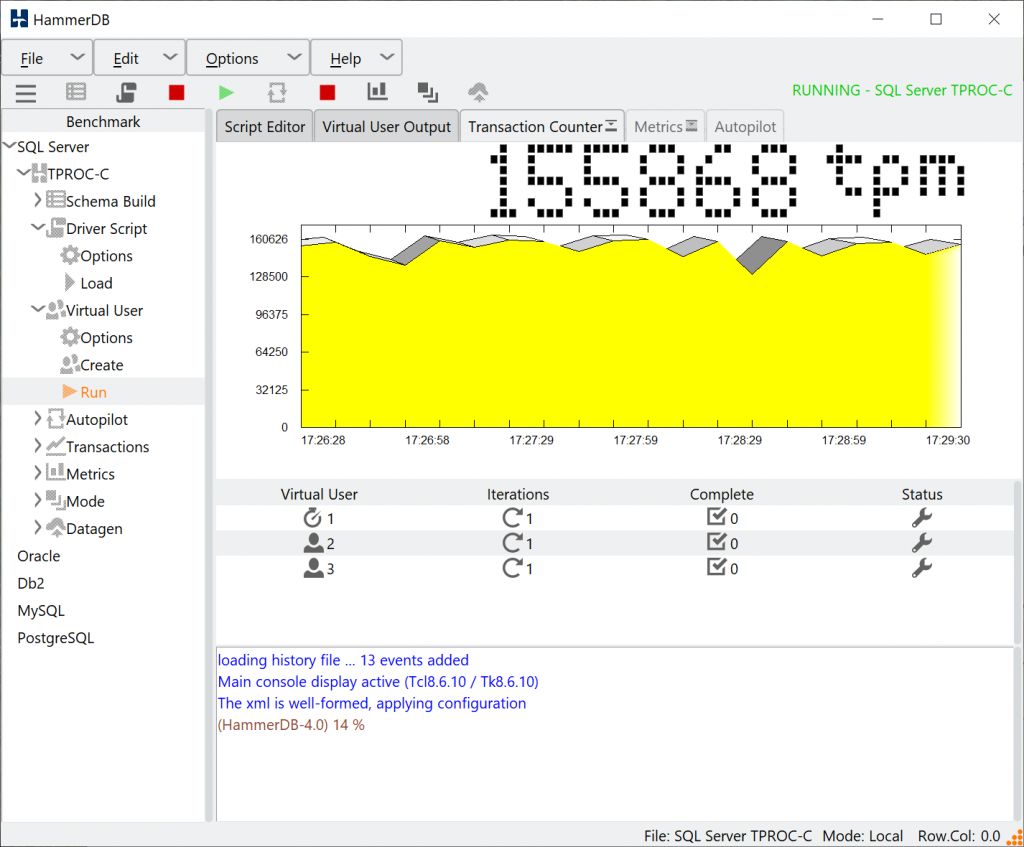
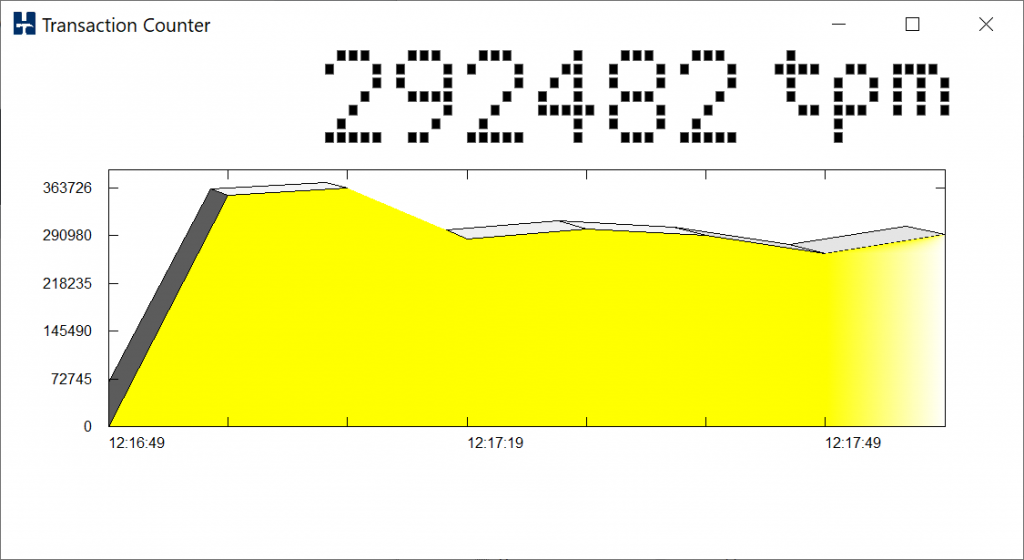
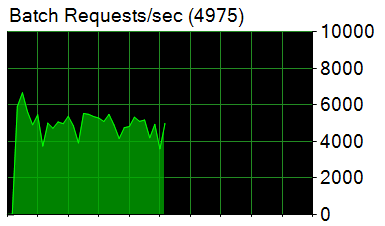
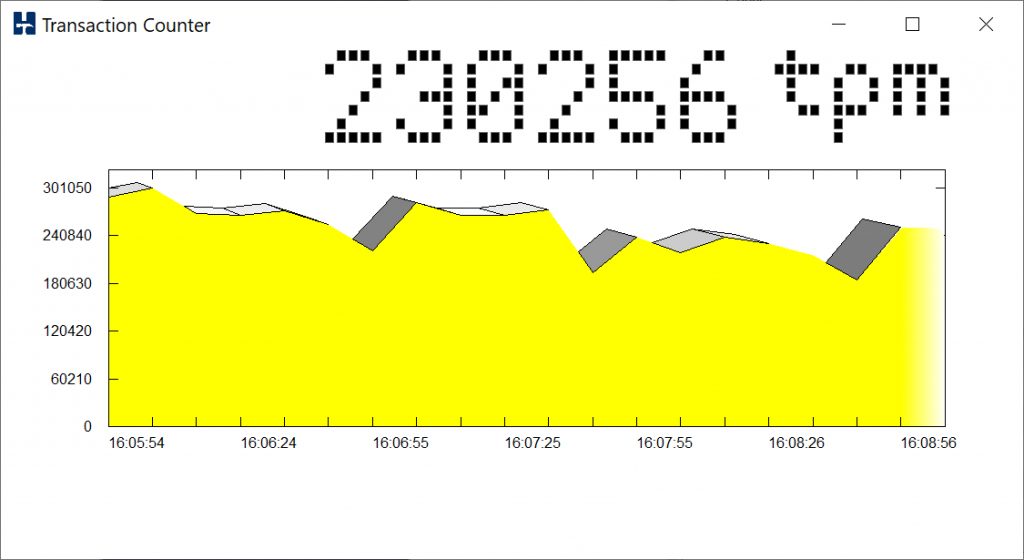
Similarly for SQL Server TPM records Batches/sec which is the same value seen in the Activity Monitor in SSMS. Using the database specific metric means that we can sample the transaction rate in real time for the HammerDB transaction counter whereas doing so for the NOPM value would impact the test by reading from a table being modified during the test. It can be seen from the example below that the HammerDB Transaction Counter

Transaction Counter

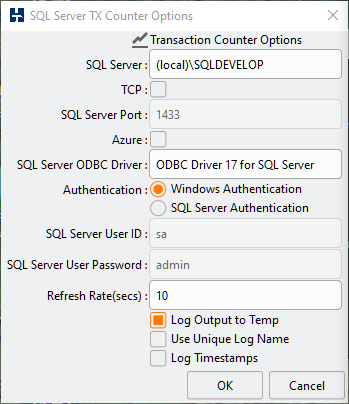
reports the same data per minute as Activity Monitor reports per second and can therefore be related directly to the other data that Activity Monitor provides such as Database I/O.

Activity Monitor

Refactoring Differences

When using HammerDB v4.0 the notable differences between TPM and NOPM rates than can be observed are as follows:

SQL Server

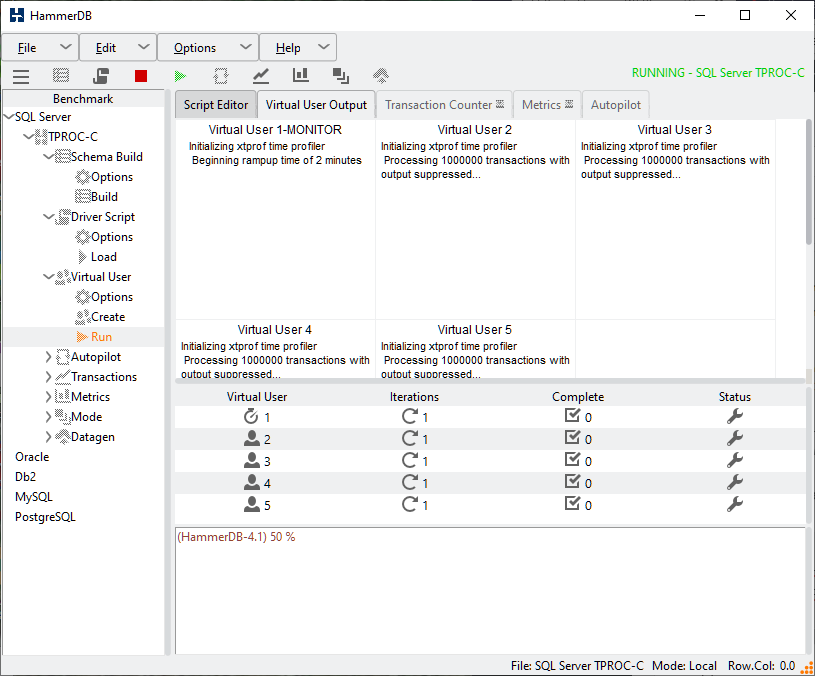
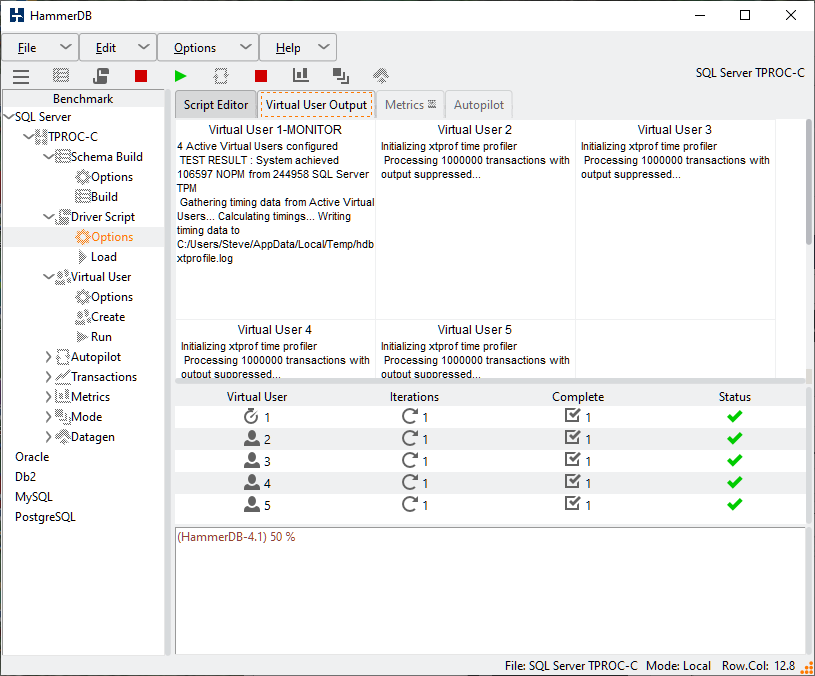
For SQL Server note that a change in the TPM metric was introduced at v3.3 and continues into v4.0. Initially these releases were planned close together however v4.0 was delayed to introduce UHD scalable graphics. The key difference is that in v3.2 the TPM value is reported as 2X the value of v4.0 (and v3.3) due to a change in the SQL Server driver interface used. The reason for the change was that there was a bug raised for the previous ODBC v1 interface tclodbc the bug meant that the 3rd party library would crash if SQL Server was shutdown during a test and then the Virtual Users subsequently closed after they had correctly reported the error. The fix to this was to move to a newer ODBCv3 interface called tdbc::odbc. The previous tclodbc interface required 2 commits per transaction one in the stored procedure and one outside in the driver script. If the external one was removed or commented then the driver would error saying that the connection was already in use by a previous command. Moving to the newer interface this external commit was no longer needed and was removed, as a result the TPM value has reduced however the NOPM value is exactly the same. (From tests it should be slightly higher with the newer ODBC v3 interface). It is important to note that as far as the HammerDB TPROC-C workload is concerned it is not doing any more work as such – just doing one less commit for the same work. If you compare the driver scripts for the different versions you can observe where the extra commit that was removed. For comparisons with previous releases NOPM can be used unmodified as the primary metric or the TPM value multiplied by 2X to account for the removed commit.

Oracle

For Oracle from v4.0 the stored procedures have been updated to use bulk processing features. As we are now doing bulk operations  we are processing more changes per database commit and this can seen in an AWR report that the redo generated per transaction has also increased from v3.3 to v4.0.  For this reason the NOPM value has increased whilst the TPM value has remained level, therefore the TPM to NOPM ratio has changed for Oracle between these releases. This has been measured at 3.0X TPM to NOPM for v3.3 and earlier but has reduced to 2.11X for v4.0. Therefore HammerDB v4.0 improves the Oracle performance by approximately 1.35-1.45X measured in NOPM for the same TPM. This improvement in NOPM is a recognition of actual improved TPROC-C transactional throughput by using advanced PL/SQL features.

PostgreSQL

The PostgreSQL stored procedures and functions have undergone similar changes as Oracle to take advantage of bulk processing features. These changes have improved NOPM and TPM by approximately 1.35X in HammerDB v4.0 compared to previous releases and is also a recognition of the use of more advanced features.

In conclusion in v4.0 HammerDB has undergone a number of evolutionary changes for some of the database workloads that impact performance results when compared to earlier versions. These differences should be accounted for when comparing results. Although the aim is to keep performance as consistent as possible between releases wherever possible as some databases had introduced new features or newer more advanced interfaces were available it was considered reasonable to modify the stored procedures or use these new interfaces to use available features even though reported results are different in the newer version.

It is also important to note that HammerDB is open source and therefore if it is considered that there are underused features in any of the supported databases then a pull request can be made to ensure that those features are fairly represented in the results reported by HammerDB. The overall goal is to remain consistent as possible whilst providing an accurate representation of the capabilities that each supported database provides as their features are updated and improved.

HammerDB v4.0 New Features Pt2: Scalable UHD Graphics

Up to version 3.3 the HammerDB GUI operated with a fixed scaling factor of 1.33 pixels per point. That means regardless of monitor resolution HammerDB was set to use a fixed number of pixels. Therefore on a higher resolution screen as shown the HammerDB GUI would appear smaller than on a standard DPI display.

HammerDB v3.3 on UHD

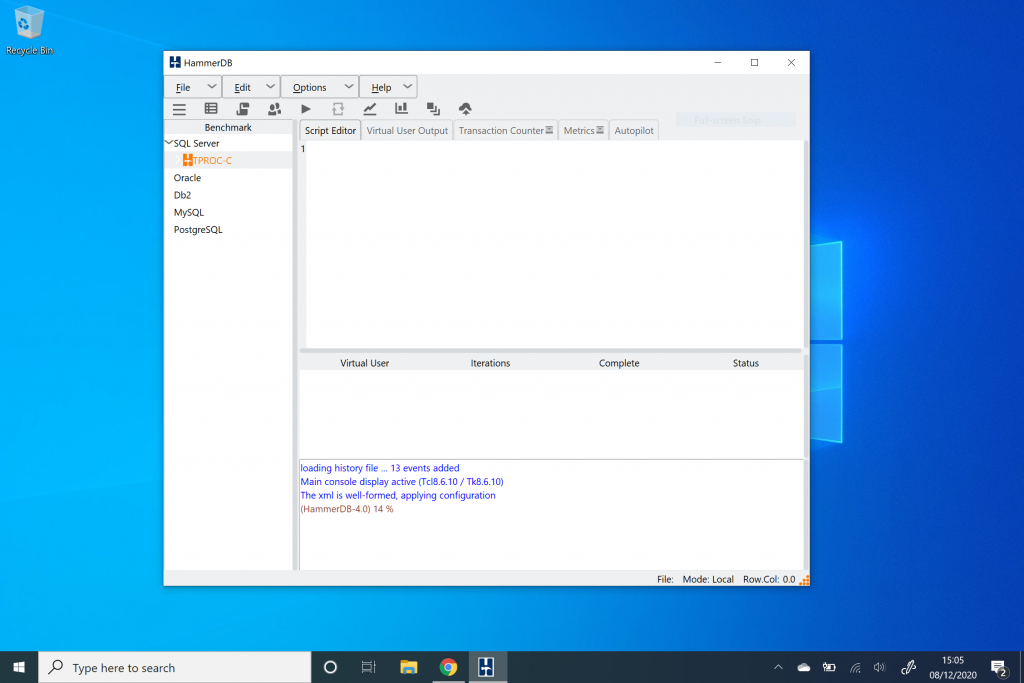
For most purposes this did not present an Issue and the HammerDB display rendered correctly up to 1920 x 1080 Full HD displays. However a GitHub Issue was raised because once moving to UHD displays with a pixel density beyond 1920×1080 the HammerDB interface became too small for use. Additionally these type of displays on devices such as PixelSense on Microsoft Surface Book were popular for presentations and demos and therefore the task was to update the HammerDB display to support scalable graphics. This meant that HammerDB would detect the display density and size the application interface accordingly. At HammerDB v4.0 the graphical interface has been extensively updated as shown to support UHD displays with pixel densities beyond 1920 x 1080 on both Windows and Linux.

HammerDB v4.0 on UHD

To achieve this scaling it was necessary to move from fixed PNG based graphics to SVG requiring all graphics and icons to be regenerated in the updated format and the interface rewritten to use SVG. Similarly it was necessary to use scalable fonts to ensure that the text scaled alongside the graphics. It was also needed to move to updated themes so that all dialogs and options scaled alongside the main display. With the move to the updated nomenclature of TPROC-C and TPROC-H already needing extensive re-documentation it was decided to delay the release of v4.0 in summer 2020 to invest the time in rewriting the interface to ensure usability on devices such as PixelSense displays.

Once the main interface was updated it was also necessary to update the transaction counter, otherwise the fixed display would have continue to render at a smaller size within the updated interface.

Transaction Counter

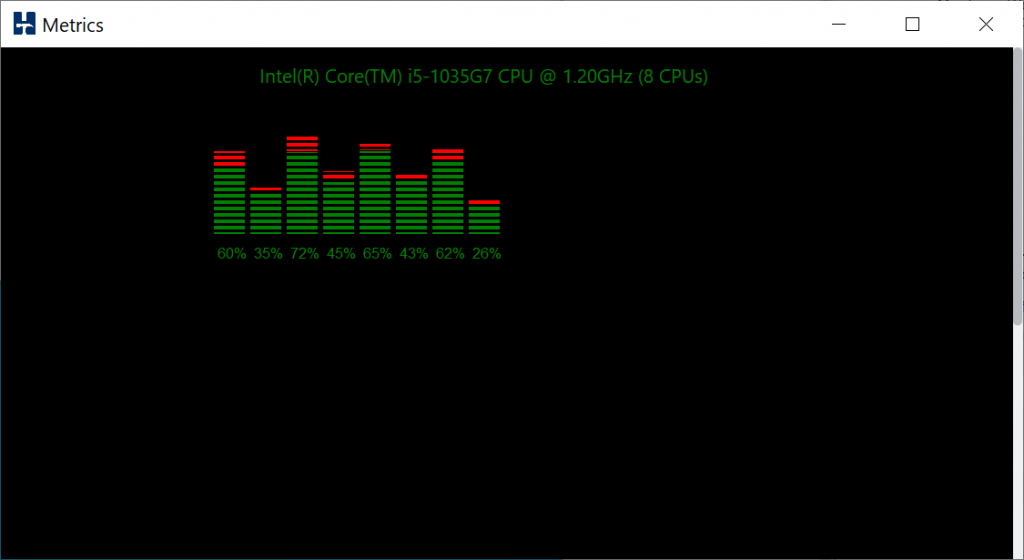
Similarly the CPU Metrics display was modified to scale in proportion to the main interface.

CPU Metrics

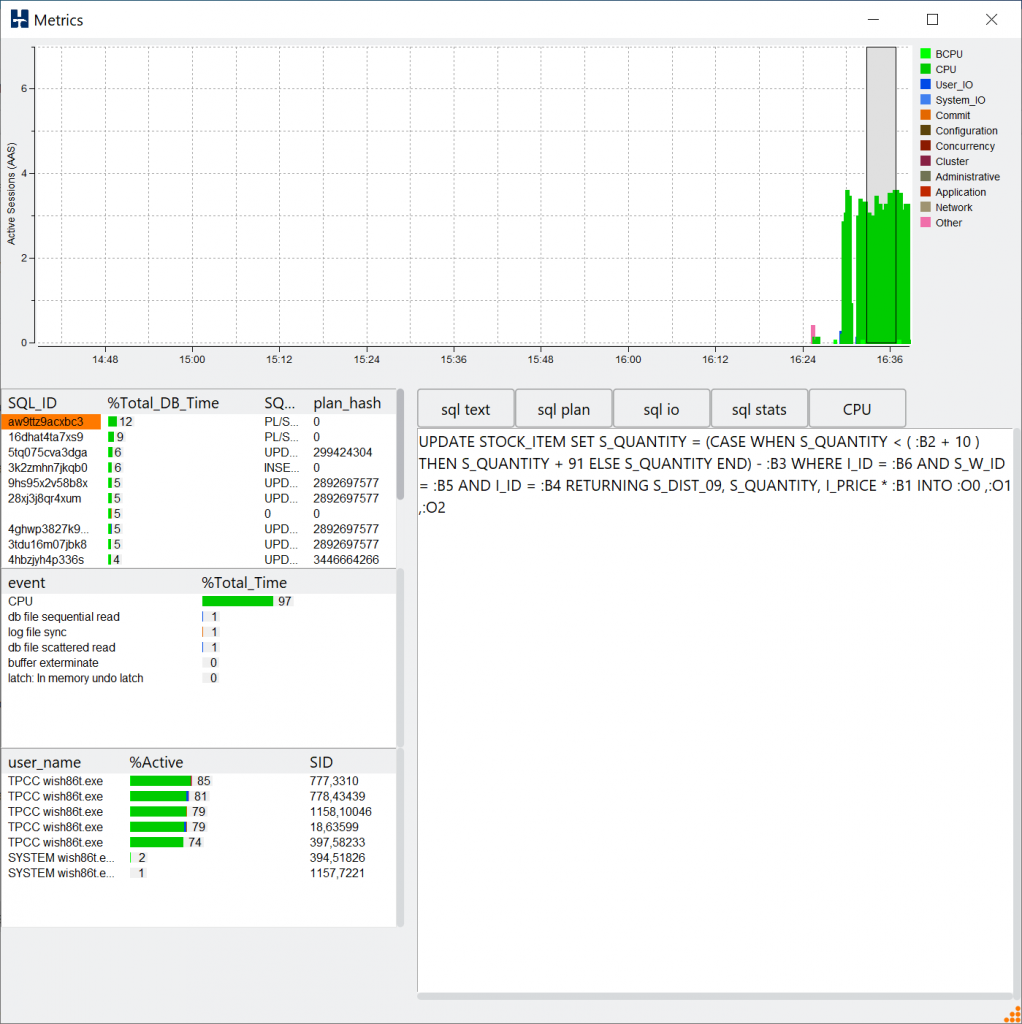
Finally it was needed to update the graphical Oracle metrics with the same scalability settings. Although this feature is only available for Oracle at v4.0 the plan is to make it available for other databases with future releases.

Oracle Metrics

With these changes the entire HammerDB application supports scalable graphics with the feature tuneable by the settings in the generic.xml file in the config directory.

<theme>
<scaling>auto</scaling>
<scaletheme>auto</scaletheme>
<pixelsperpoint>auto</pixelsperpoint>
</theme>

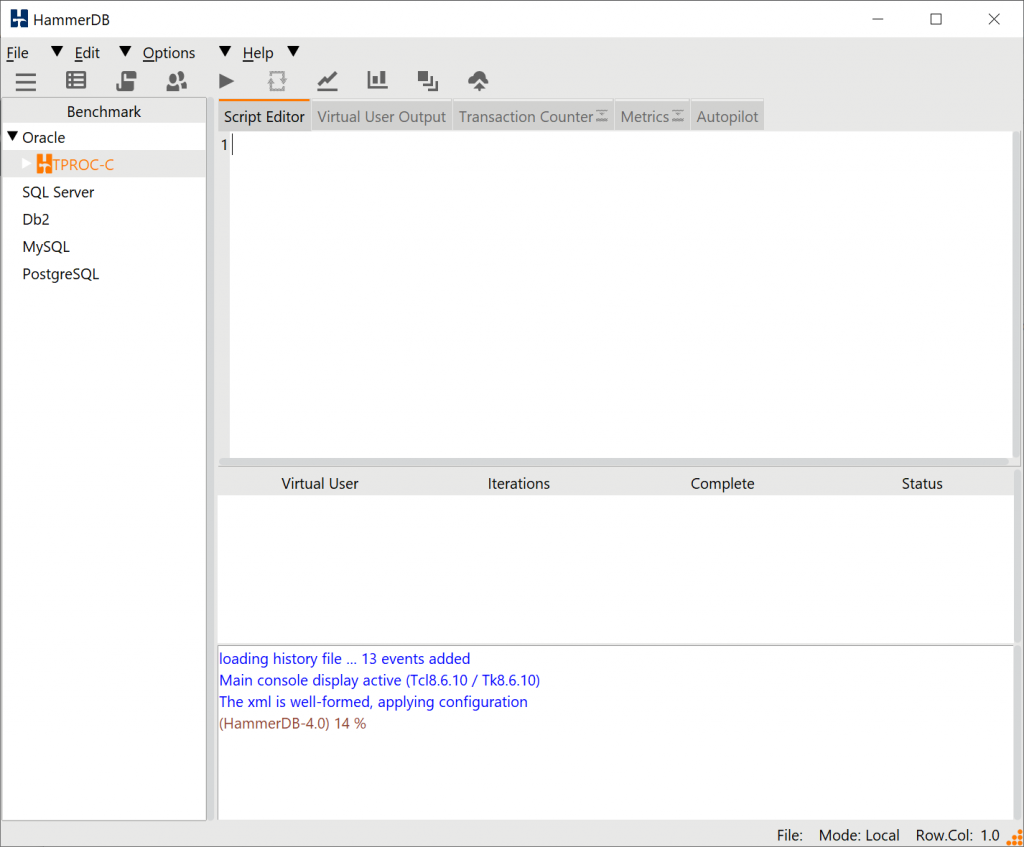
By default all of the theme settings are set to auto and this is the recommended configuration. However they can be modified if required. Firstly the scaling setting can be changed to fixed to revert to the previous fixed non-scaling graphics. This could for example be used when using a remote X-windows display for faster graphics rendering when a faster alternative such as VNC is not available. For the scaletheme you can use settings of “auto”, “awlight”, “arc” or “breeze”, with “awlight” the default on Linux and “breeze” the default on Windows, with the plan to introduce more theme options over time.
awlight theme

Finally pixelsperpoint is for expert usage to fine tune the scaling of HammerDB according to different screen settings.

Now that HammerDB is available with scalable graphics from v4.0 there is no longer any barrier to running database performance presentations and demos from devices with UHD displays.

HammerDB v4.0 New Features Pt1: TPROC-C & TPROC-H

One of the key differences that stands out with HammerDB v4.0 compared to previous releases is that the workload names have changed from TPC-C and TPC-H to TPROC-C and TPROC-H respectively and therefore a key question is how are the v4.0 workloads different from the previous releases of v3.3 and earlier, what has changed and how does this impact interpreting results? The simple answer is nothing, the workloads are exactly the same workloads derived from the TPC-C and TPC-H specifications and HammerDB v4.0 can be seen as a continuation and enhancement from previous releases, only the name has changed, not the workload itself.  From an engineering perspective this may be all that you need to know. However a reasonable follow-on question is then why change the name at all? This post aims to give some of the background to the change and provide you with the information of where and how the TPROC-C and TPROC-H differ from a ‘real’ TPC-C and TPC-H respectively.

First of all it has always been clear in the HammerDB documentation that the TPROC-C/TPC-C and TPROC-H/TPC-H workloads have not been ‘real’ audited and published TPC results instead providing a tool to run workloads based on these specifications.  For example HammerDB has not used tpmC terminology to report TPC-C based metrics instead using TPM and NOPM nomenclature.  Initially from TPC documentation it was not specified whether using TPC-C and TPC-H terminology for derived workloads was permitted. Additionally both commercial and open source tools based on the specifications also continued to use TPC-C and TPC-H to describe these workloads.  This has now been made explicitly clear, using TPC-C or TPC-H for a non-compliant workload to the full specification is a trademark violation.  For this reason HammerDB has changed the workload names to be legally compliant.  Any tools using TPC-C, TPC-H (or other trademarked TPC workload names) for tools or workloads both commercial and open source should also consider renaming for trademark compliance purposes or take legal guidance.

But why is this important? Surely it was clear that as a derived workload HammerDB results were not actual fully audited TPC results so that this non-compliance was implicit? In the vast majority of cases this was the case and even when using TPC terminology it was clear that using for example TPC-C meant “derived from TPC-C”. However there were cases where intermediate understanding based on some familiarity with the specifications (but without the implicit understanding that the difference was already clear) have questioned the validity of published performance data by users based on this implicit understanding. This change makes that difference explicit and puts everyone on the same page, TPROC-C means derived from TPC-C.

So why derive a workload from TPC-C or TPC-H at all and instead just rely on vendor published and fully audited results? This question is the very essence of what HammerDB is, a tool that takes the well designed and scalable TPC-C and TPC-H specifications and implements a workload derived from them that is accurate and repeatable yet tests database capabilities to the full (compared to alternative simple 1-table no contention workloads) so that running database performance benchmarks becomes fast, low cost and accessible to all, making database benchmarks open source thereby allowing anyone to compare the performance of their databases.

A full understanding of why this is important requires some knowledge of the evolution of database hardware and software.  The HammerDB TPROC-C workload by design intended as CPU and memory intensive workload derived from TPC-C – so that we get to benchmark at maximum CPU performance at a much smaller database footprint.  In the days before highly performant SSDs and persistent memory, database benchmarks had a significant challenge in comparing performance due to the available I/O performance.  For TPC-C this meant enough available spindles to reduce I/O latency and for TPC-H enough bandwidth for data throughput.  Fully audited configurations would require multiple racks of I/O capacity to reach maximum CPU performance. This was both expensive and time consuming to configure.  Even with superior I/O performance today the I/O configuration required on-premise or in the cloud remains costly.

Additionally a fully audited benchmark requires multiple client servers to sustain the large volume of clients as well as a TP Monitor (Transaction Processing Monitor) This TP monitor acts as middleware transferring the transactions between the clients and the database server.  The challenge was how to take the essence of the TPC specifications that are made available for free and implement the workloads in a method that maximises CPU performance and can be run on anything from laptops to servers without the significant expense of I/O capacity and multiple client servers to run the workloads.  Therefore for HammerDB TPROC-C we eliminated keying and thinking time and eliminated the requirement for terminals. This meant we could dispense with the TP-monitor, reduce the number of clients, reduce the storage and the schema size but still run similar transactions to the TPC-C specification so that it was running a scalable and repeatable workload in a CPU and memory intensive manner.

Over time since we first ran HammerDB workloads we noticed that the CPU generation to generation performance ratios between systems was the same with this CPU intensive default mode as the official published TPC-C benchmarks. I.e. if system A generated 1.5X more transactions than system B in the fully audited benchmark then the HammerDB result was also 1.5X better.  Consequently we were getting very similar insights both faster and cheaper meaning we could test orders of magnitude more configurations in the same amount of time generating relative performance ratios.

Why would this be the case?  Surely if the database schema is smaller, the workload more intensive, and there is not the same I/O capacity demands then the results would be different. The key aspect is the presence of the TP Monitor and this is arguably the area where the most confusion arose in stating that a HammerDB TPC-C workload was not an actual TPC-C workload which should have already been clear. Typically in a fully audited TPC-C the client sessions are not connecting directly to the database with many 1000’s of sessions. Instead all of the client servers are connecting to the TP monitor.  This is not a new concept, as given in the description for the earlier TPC-B workload  “a transaction monitor can multiplex transaction streams to match the processing profile of the database subsystem. For example, 1000 user terminals would present transactions with human think times and delays, and the transaction monitor will concentrate them down to a steady stream of, say, 50 concurrent processes.”   Therefore the actual database server workload is both CPU and memory intensive with actual connections typically numbered in the hundreds processing transactions for the clients managed by the TP monitor.  HammerDB eliminates this stage instead implementing a workload that connects the steady stream of transactions directly to the database.  Additionally because the number of Virtual Users is lower for the HammerDB   default mode (see below for alternatives) each Virtual User will choose a home warehouse at random. Once that home warehouse is chosen then most of the work takes place against that warehouse – therefore for example you hit max CPU at 200 VUsers then most of the work is on 200 warehouses regardless of how many you have created.  As the home warehouse is chosen at random however you want enough to ensure an even spread of Virtual Users across the warehouses. Therefore the general advice is 250-500 warehouse per socket and for example a starting point of 1000 warehouses for a 2 socket server regardless of the database is a good starting point. This is also the reason why the default maximum number of warehouses is 5000. You can change this if you wish, however this limit is set to prevent a typical error of over configuring the database size in the expectation that it will improve performance.

Nevertheless more recently SSDs and persistent memory are lowering the price points for high performance I/O increasing the desire to test more I/O that wasn’t there when people needed to buy a dedicated storage array to do so. For this reason beyond the default mode there are the 3 more advanced features:

  1. Use All Warehouses (Choose a new warehouse per transaction)
  2. Event driven scaling (asynchronous clients with keying and thinking time)
  3. XML Connect Pooling (test distributed clusters)

These can be used separately or together for the sort of scenarios where it is desired to increase the I/O load, the number of Virtual Users or to test a distributed environment.  However to test a large number of Virtual Users with event driven scaling will need increasing the number of HammerDB clients with primary and replica modes and you will also need to implement a form of middleware to concentrate these connections. Therefore you are moving away from a more agile and rapid form of testing to more complex configurations.  You are entirely in control of your test environment and therefore the choice is yours dependent on the scenarios you wish to test rather than being bound by a more rigid specification.

In terms of analytics and the TPROC-H workload derived from TPC-H, this specification  does not require middleware so when running TPROC-H you are close to the specification,  however there remain differences.  For example the TPC-H specification includes measuring database load times that is beyond the scope of HammerDB and you may wish to implement features such as in-memory column stores, partitioning and compression to improve performance. HammerDB cannot implement advanced features that may not be available in all test environments and therefore builds a base configuration that would be available to all. The user can then modify the schema as they wish. For this reason TPROC-H is also a workload derived from TPC-H and has moved away from providing information on calculating the QphH figure to focusing on actual query times for power and throughput tests and a total geometric mean of query times.

In conclusion, TPROC-C and TPROC-H are the new names for the same HammerDB specific workloads that mean “derived from TPC-C” and “derived from TPC-H” respectively to make running workloads based on these specification both faster and cheaper and available to all.  Official TPC-C and TPC-H compliant results can as has always been the case only be found on the official TPC website.


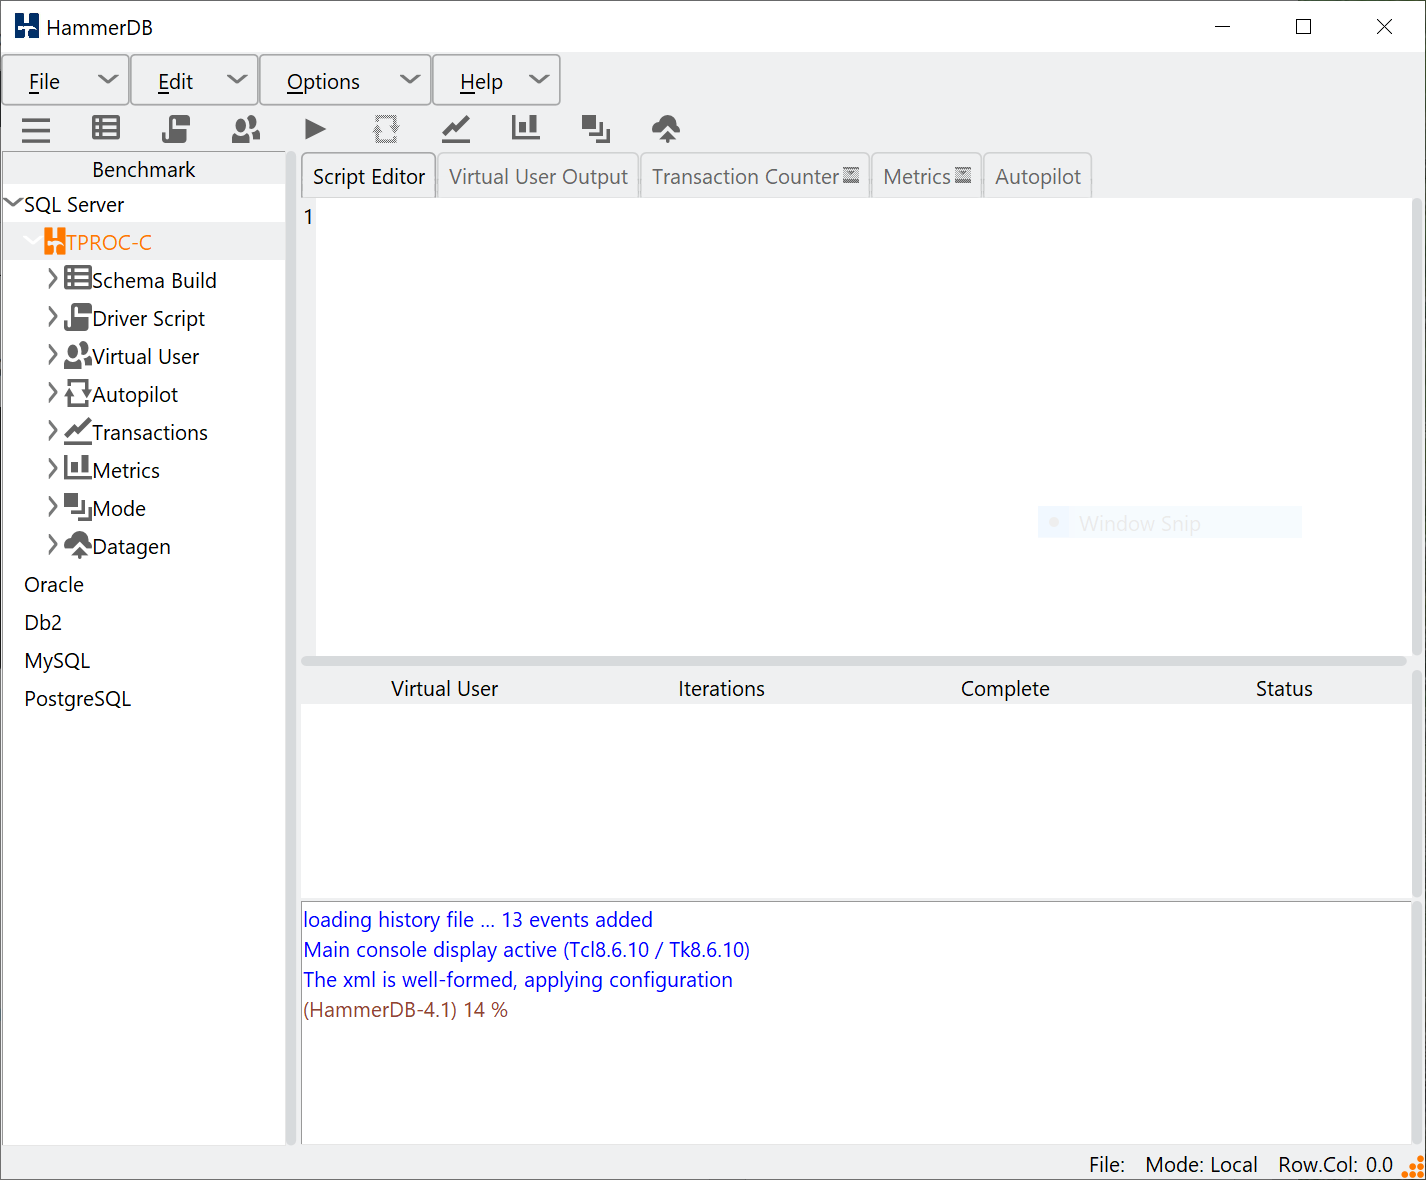
Automating CLI Tests on Windows

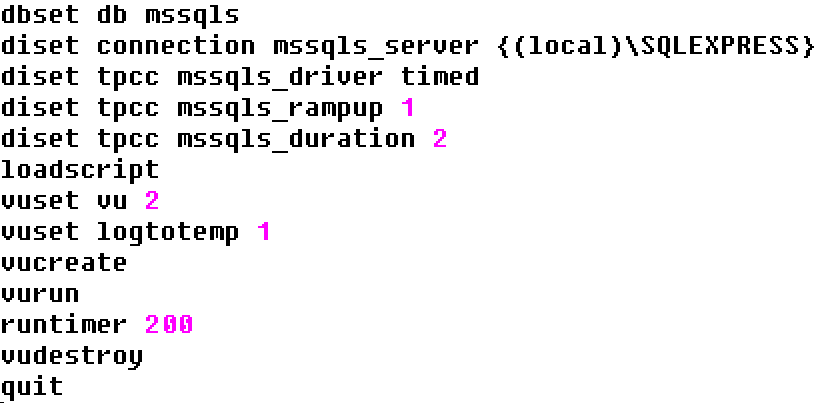
The information in this post is a duplicate of this GitHub Issue https://github.com/TPC-Council/HammerDB/issues/84. The issue regards running build and driver scripts automatically in Windows.  As both build and driver examples are not given together in previous posts, the examples are copied here. This is intended as a template that you can take and modify for your own needs.

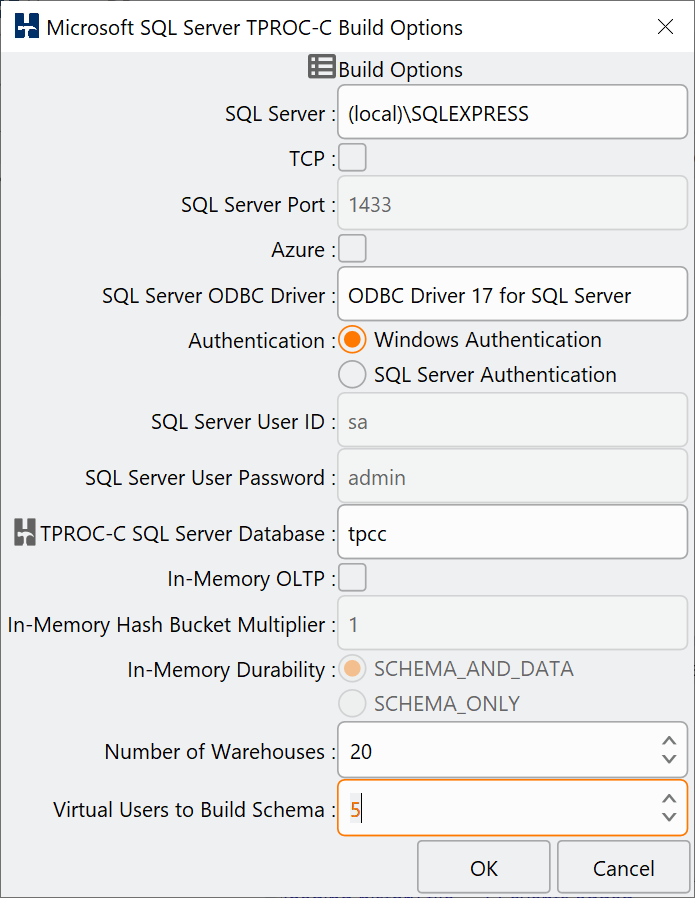
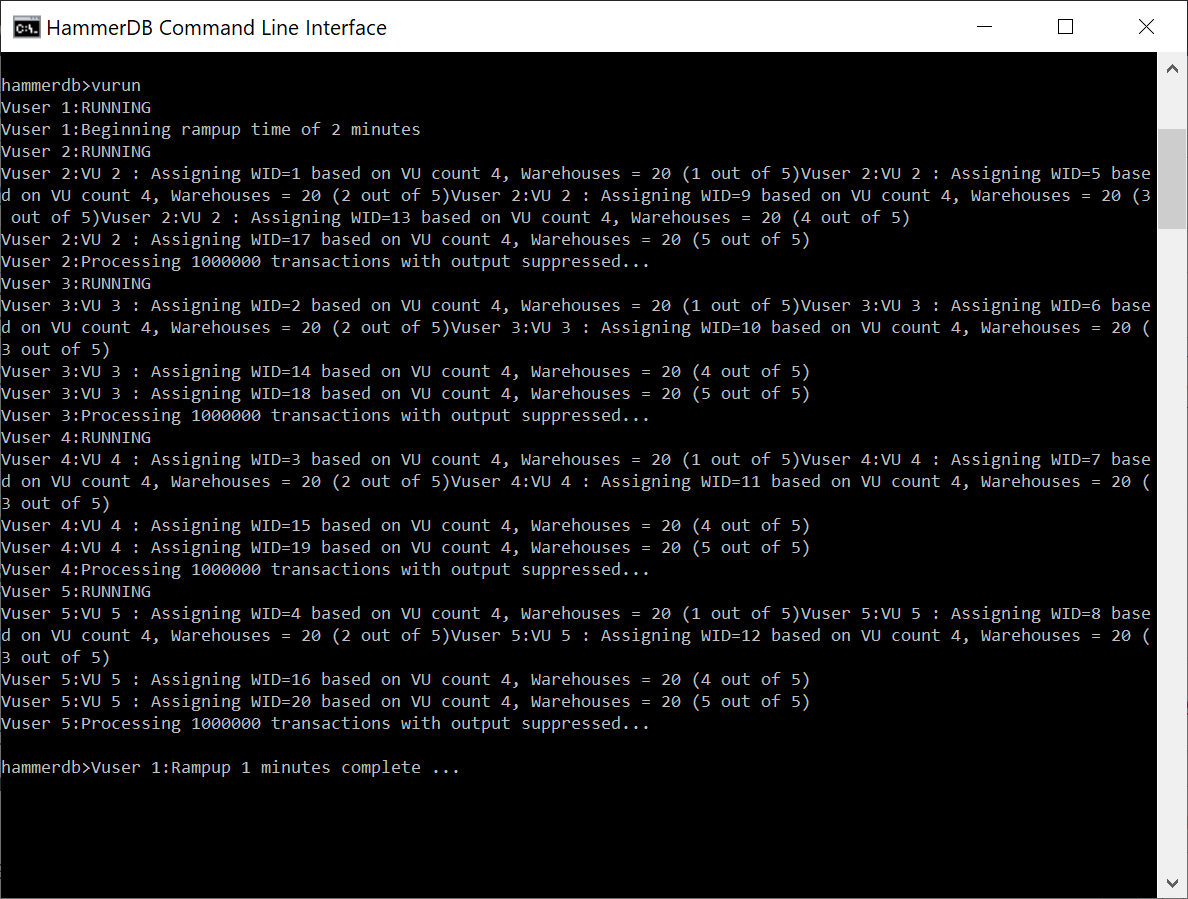
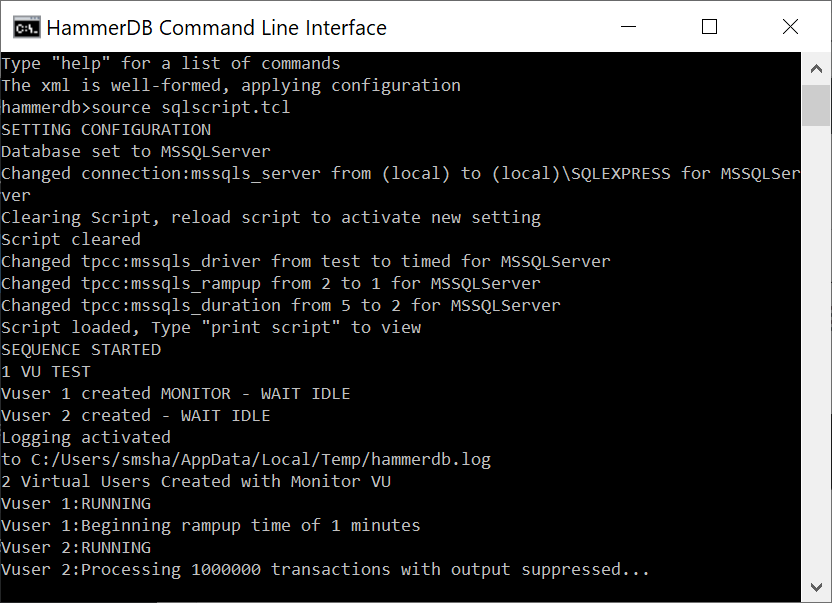
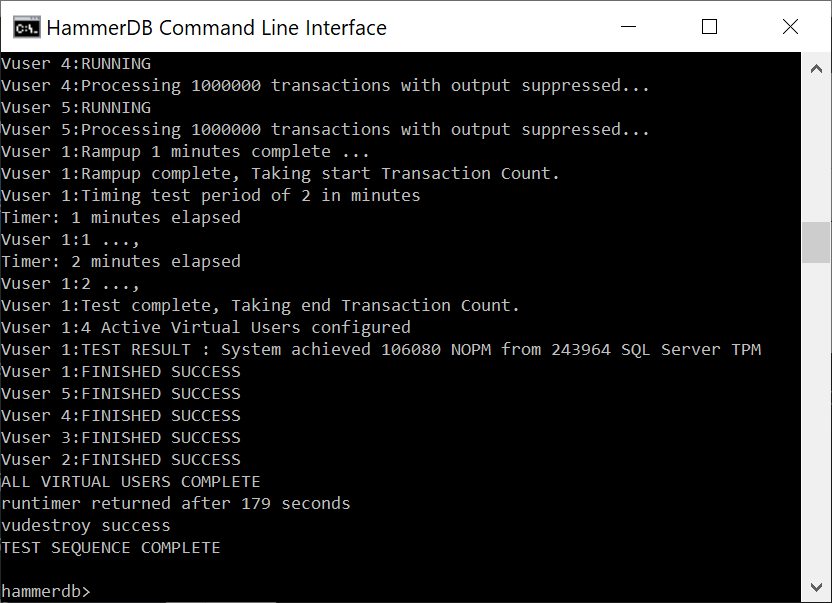
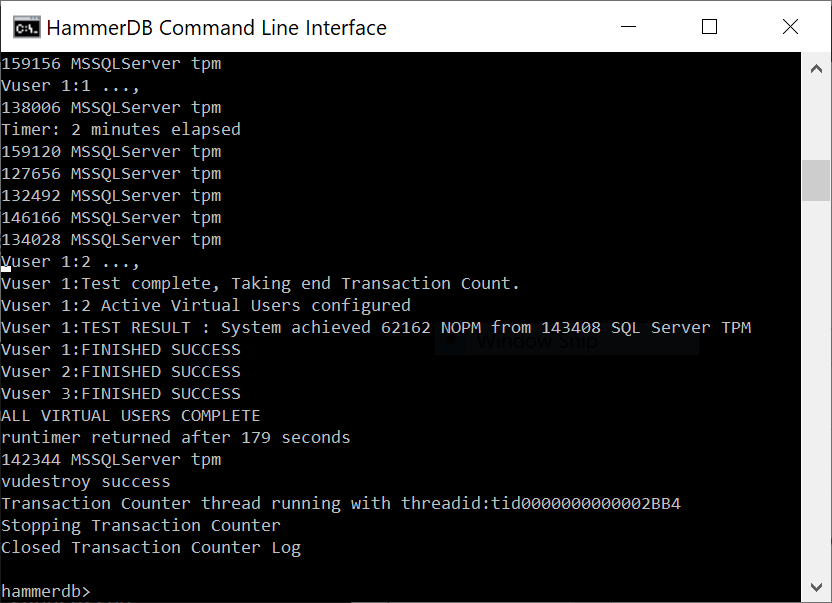
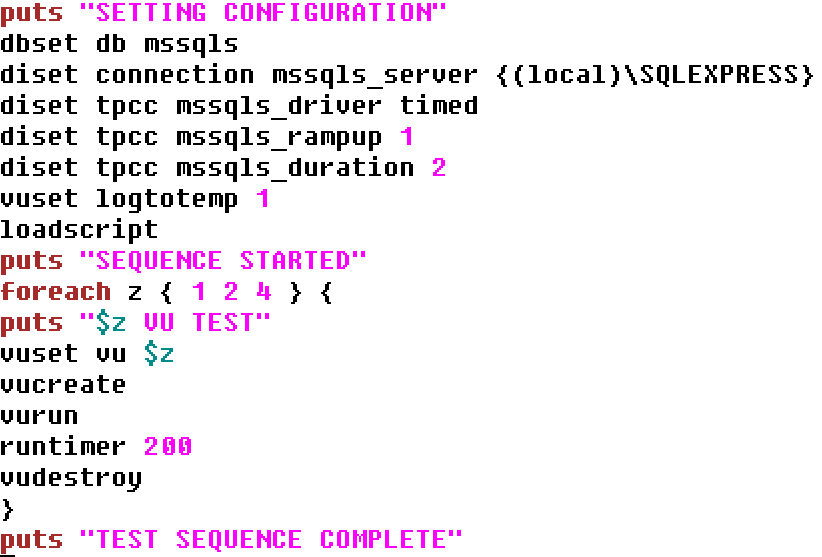
A few things to note. Firstly these scripts are multithreaded so once you do build schema and vurun it is running multiple threads. We need a different approach for both because in the schema build we are waiting for all of the virtual users to finish (vwait forever), however for the driver we are waiting for a set period of time before terminating them. For the build I have created more warehouses but with 5 virtual users to show the multithreaded nature of the build. For the driver we have set a rampup and duration of 3 minutes in total (180 secs) – this runs in the virtual users, then in the main monitor virtual user it runs a timer – this is set to 200 seconds more than the rampup and driver combined (if it is less it will terminate the test before ending).

With both I copied the scripts to C:\Program Files\HammerDB-3.3. I then did:

hammerdbcli.bat auto autorunbuild.tcl

and

hammerdbcli.bat auto autorundrive.tcl

When both are complete the shell will exit as intended therefore it is a good idea to set logtotemp to ensure that you receive both the output and errors (for example if the build script exits because the database already exists).

Build Script – autorunbuild.tcl

puts "SETTING CONFIGURATION"
global complete
proc wait_to_complete {} {
global complete
set complete [vucomplete]
if {!$complete} { after 5000 wait_to_complete } else { exit }
}
puts "SETTING CONFIGURATION"
dbset db mssqls
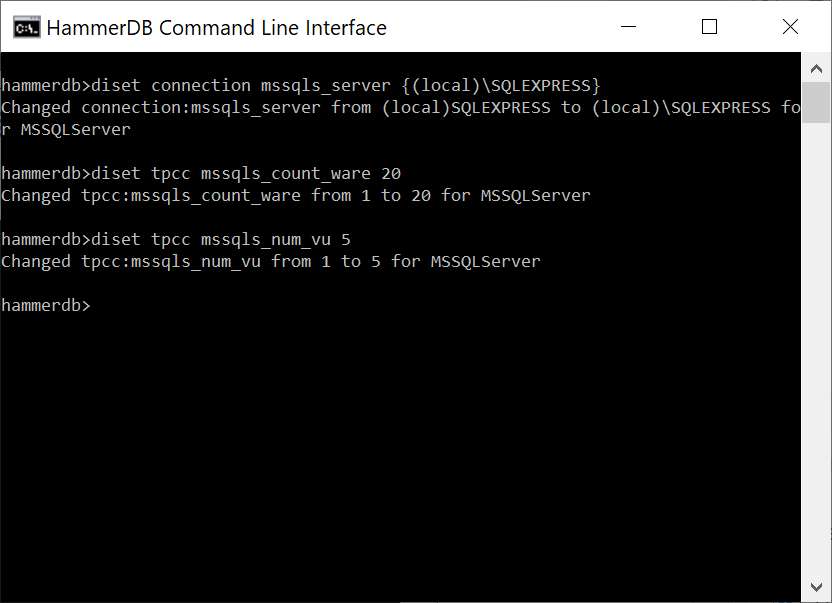
diset connection mssqls_server {(local)\SQLDEVELOP}
diset tpcc mssqls_count_ware 10
diset tpcc mssqls_num_vu 5
vuset logtotemp 1
buildschema
wait_to_complete
vwait forever

Driver Script – autorundrive.tcl

#!/bin/tclsh
proc runtimer { seconds } {
set x 0
set timerstop 0
while {!$timerstop} {
incr x
after 1000
  if { ![ expr {$x % 60} ] } {
          set y [ expr $x / 60 ]
          puts "Timer: $y minutes elapsed"
  }
update
if {  [ vucomplete ] || $x eq $seconds } { set timerstop 1 }
    }
return
}
puts "SETTING CONFIGURATION"
dbset db mssqls
diset connection mssqls_server {(local)\SQLDEVELOP}
diset tpcc mssqls_driver timed
diset tpcc mssqls_rampup 1
diset tpcc mssqls_duration 2
vuset logtotemp 1
loadscript
puts "SEQUENCE STARTED"
foreach z { 1 2 4 } {
puts "$z VU TEST"
vuset vu $z
vucreate
vurun
#Runtimer in seconds must exceed rampup + duration
runtimer 200
vudestroy
after 5000
}
puts "TEST SEQUENCE COMPLETE"

A recommended editor that recognises TCL syntax for editing HammerDB script is Vim. 

How to Graph HammerDB Response Times

The HammerDB workload derived from TPC-C contains a feature to record the response times for the stored procedures that are run in the logfile. This post shows how you can easily convert this data into spreadsheet format to view the response times you have captured over a run.

Firstly, to activate the time profile feature select Time Profile for the GUI or the set the equivalent parameter in the CLI to true.

Time Profile

You can note that when loaded the driver script is modified to report response times for the first active virtual user running the workload. (Only the first virtual user is tracked to minimise the impact on the workload). This data is reported every 10 seconds into the HammerDB log.  The output is in percentile format reporting the minimum, 50th percentile, 95th percentile, 99th percentile and maximum for each of the procedures during that 10 second interval with an extract shown below.

+-----------------+--------------+------+--------+--------------+
 |PERCENTILES 2019-08-23 04:54:21 to 2019-08-23 04:54:31
 |neword|MIN-812|P50%-2320|P95%-3614.5|P99%-4838|MAX-10610|SAMPLES-2221
 |payment|MIN-281|P50%-1136|P95%-1892|P99%-2344|MAX-3725|SAMPLES-2133
 |delivery|MIN-2931|P50%-4048|P95%-5247|P99%-5663|MAX-5989|SAMPLES-197
 |slev|MIN-1521|P50%-2108|P95%-2629|P99%-2859|MAX-3138|SAMPLES-248
 |ostat|MIN-212|P50%-398.5|P95%-610|P99%-770|MAX-1732|SAMPLES-205
 |gettimestamp|MIN-3|P50%-5|P95%-6|P99%-6|MAX-27|SAMPLES-4753
 +-----------------+--------------+------+--------+--------------+
 |PERCENTILES 2019-08-23 04:54:31 to 2019-08-23 04:54:41
 |neword|MIN-797|P50%-2301.5|P95%-3590|P99%-6458|MAX-10130|SAMPLES-2147
 |payment|MIN-299|P50%-1136|P95%-1840|P99%-2301|MAX-3470|SAMPLES-2124
 |delivery|MIN-2922|P50%-4164.5|P95%-5334|P99%-5802|MAX-6179|SAMPLES-247
 |slev|MIN-1342|P50%-2074|P95%-2700|P99%-2945|MAX-3038|SAMPLES-218
 |ostat|MIN-193|P50%-409|P95%-571|P99%-620|MAX-897|SAMPLES-220
 |gettimestamp|MIN-3|P50%-5|P95%-6|P99%-6|MAX-34|SAMPLES-4735
 +-----------------+--------------+------+--------+--------------+

In text from this data can be useful, however often it is better to view this in graphical form. The simple script below can be run at the command line and provided with a logfile with the data for one run only. (Note that it is important that to convert you only provide a logfile for that to convert, otherwise all of the data will be combined).  When run on a logfile with data such as shown above this will output the data in tab delimited format that can be interpreted by a spreadsheet.

#!/bin/tclsh
 set filename [lindex $argv 0]
 set fp [open "$filename" r]
 set file_data [ read $fp ]
 set data [split $file_data "\n"]
 foreach line $data {
 if {[ string match *PERCENTILES* $line ]} {
 set timeval "[ lindex [ split $line ] 3 ]"
 append xaxis "$timeval\t"
         }
     }
 puts "TIME INTERVALS"
 puts "\t$xaxis"
 foreach storedproc {neword payment delivery slev ostat} {
 puts [ string toupper $storedproc ]
 foreach line $data {
 if {[ string match *PROCNAME* $line ]} { break }
 if {[ string match *$storedproc* $line ]} {
 regexp {MIN-[0-9.]+} $line min
 regsub {MIN-} $min "" min
 append minlist "$min\t"
 regexp {P50%-[0-9.]+} $line p50
 regsub {P50%-} $p50 "" p50
 append p50list "$p50\t"
 regexp {P95%-[0-9.]+} $line p95
 regsub {P95%-} $p95 "" p95
 append p95list "$p95\t"
 regexp {P99%-[0-9.]+} $line p99
 regsub {P99%-} $p99 "" p99
 append p99list "$p99\t"
 regexp {MAX-[0-9.]+} $line max
 regsub {MAX-} $max "" max
 append maxlist "$max\t"
     }
       }
 puts -nonewline "MIN\t"
 puts $minlist
 unset -nocomplain minlist
 puts -nonewline "P50\t"
 puts $p50list 
 unset -nocomplain p50list
 puts -nonewline "P95\t"
 puts $p95list 
 unset -nocomplain p95list
 puts -nonewline "P99\t"
 puts $p99list
 unset -nocomplain p99list
 puts -nonewline "MAX\t"
 puts $maxlist
 unset -nocomplain maxlist
     }
 close $fp

In this example we run the script above, pass the name of the logfile for the run where response times were captured and output them to a file with a spreadsheet extension name.  Note that it is important to output the data to a file and not to a terminal with that data then cut and paste into a spreadsheet. If output to a terminal it may format the output by removing the tab characters which are essential to the formatting.

$ ./extracttp.tcl pgtp.log > pgtp.txt

If we look in this file we can see that it has extracted the data and output them into rows with the extracted values.

$ more pgtp.txt
TIME INTERVALS
     04:49:51    04:50:01    04:50:11    04:50:21    04:50:31    04:50:41    04:50:51    04:51:01    04:51:11    04:51:21    04:51:31    04:51:41    04:51:51    04:52:01    04:52:11    04:52:21    04:52:31    04:52:41    04:52:51    04:53:01    04:53:11    04:53:21    04:53:31    04:53:41    04:53:51    04:54:01    04:54:11    04:54:21    04:54:31    04:54:41    04:54:51    04:55:01    04:55:11    04:55:21    04:55:31    04:55:41    04:55:51    04:56:01    04:56:11    04:56:21    04:56:31    04:56:41    
 NEWORD
 MIN    457 519 684 734 828 829 795 894 803 880 775 840 774 851 821 792 720 849 751 813 715 879 823 778 853 739 807 812 797 781 841 852 775 865 832 686 805 845 813 822 863 833 
 P50    866 1099    1455    1918.5  2318    2267    2271    2307    2315    2347    2299    2296    2301.5  2313    2314    2351    2324    2312    2284    2347    2344 ...

We now have an option.  In testing with Excel 2013 we can simply give this file a .xls extension and open it. If we do it will give the following warning, however if you click OK it will open with the correctly formatted data.

Excel extension

Alternatively if we open the file with the .txt extension it will show 3 steps for the Text Import Wizard.  Click through the Wizard until Finish.

Text Import 1
Text Import 2
Text Import 3

After clicking Finish the data has been imported into the spreadsheet without warnings.

Imported Data

As an example we will highlight the rows we want to graph by clicking on the row numbers.

Highlighted Spreadsheet

If we then click on Insert and Recommended Charts, the default graph produced by Excel is shown below with the addition of a vertical axis title and a chart header.

Finally make sure when saving the spreadsheet it is saved in Excel format rather than the imported Tab (Text Delimited).

With this approach it is straightforward to turn the captured response times into a visual representation to being further analysis to your workloads.

HammerDB v3.3 event driven scaling

HammerDB v3.3 includes a new feature called event driven scaling to enable the scaling of virtual users to thousands of sessions running with keying and thinking time enabled. This feature adds additional benefit to your testing scenarios with the ability to handle large numbers of connections or testing with connection pooling. This post explains the benefits that this feature brings and how to enable it.

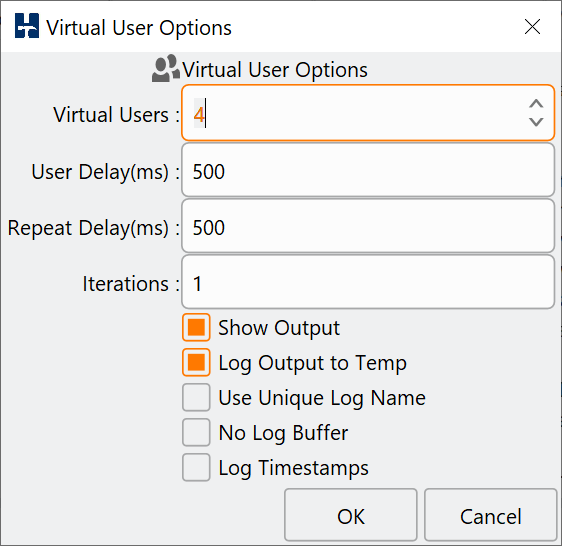
When running transactional workloads with HammerDB the default mode is CPU intensive meaning that one virtual user will run as many transactions as possible.  As an example  we will run a simple test by creating a 10 warehouse TPC-C schema and configuring a single virtual user to run a test in this default mode.

Once we’ve created this Virtual User and run the test for 1 minute on a simple PC configuration we receive a result showing that the Virtual User ran many thousands of transactions a minute.

Using HammerDB metrics we can also see that this single Virtual User was using a fair amount of CPU.

Now lets select keying and thinking time by checking the “Keying and Thinking Time” option we can now see that the transaction rate has dropped considerably.

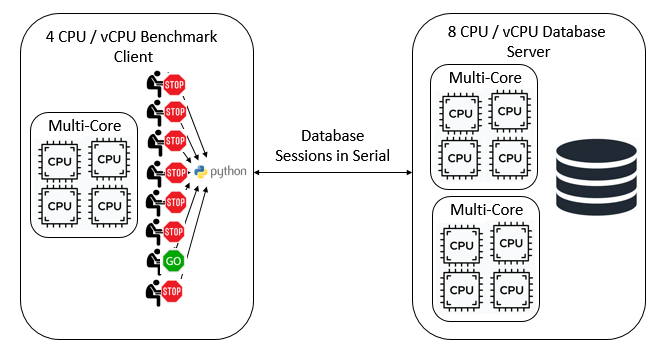
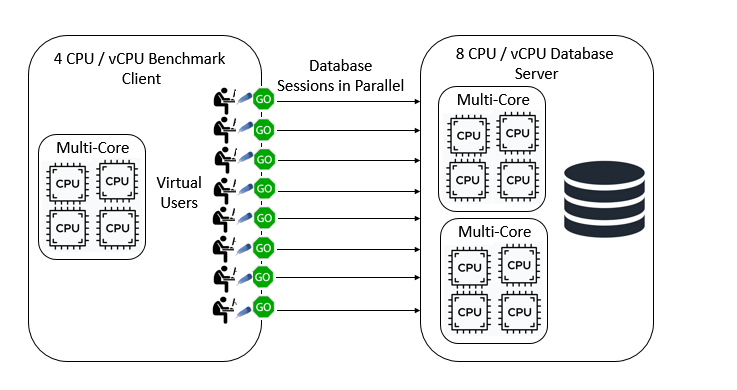
It is clear that we would need to create a large number of Virtual Users to even begin approaching the same number of transactions that a single virtual user could process without keying and thinking time. Event driven scaling is a feature that enables each Virtual User to create multiple database sessions and manage the keying and thinking time for each asynchronously in an event-driven loop enabling HammerDB to create a much larger session count.  It should be clear that this feature is only designed to work with keying and thinking time enabled as it is only the keying and thinking time that is managed asynchronously.
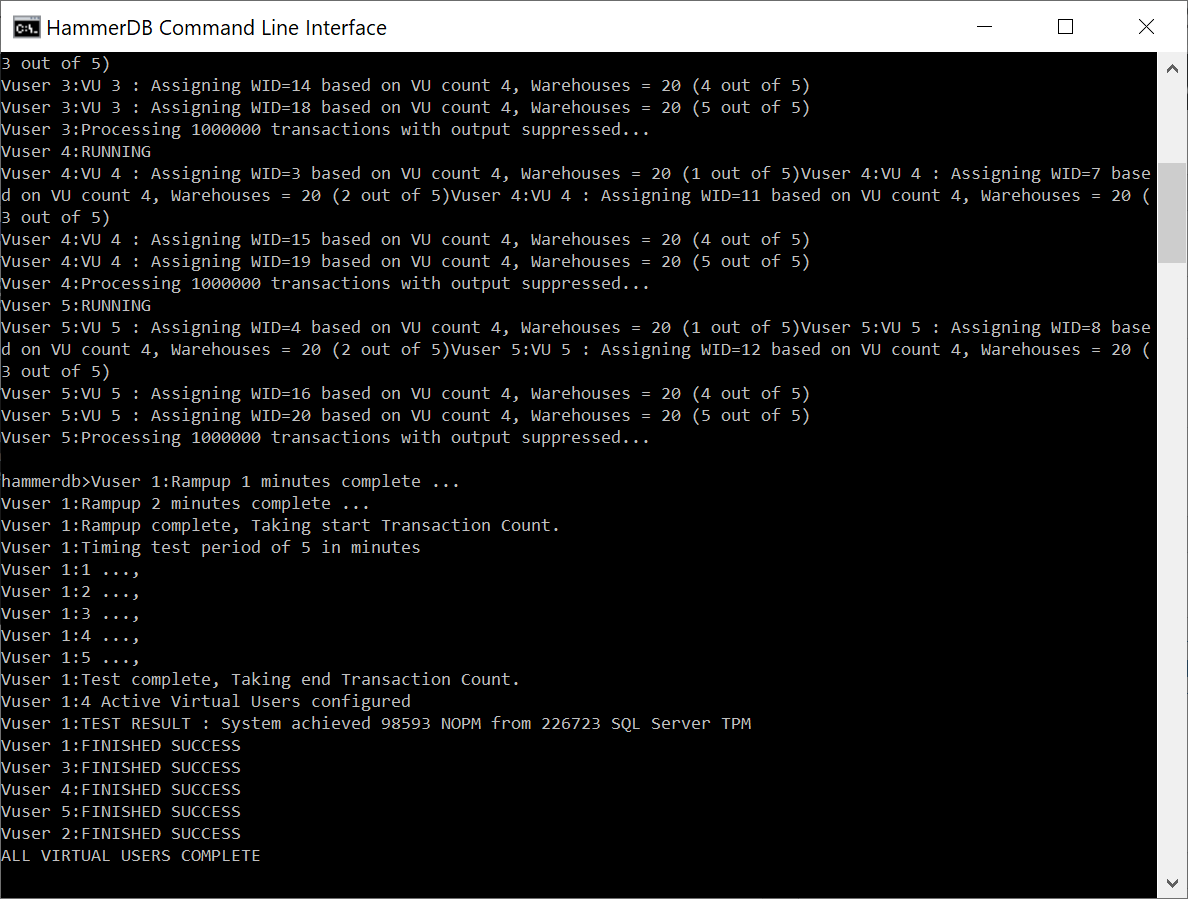
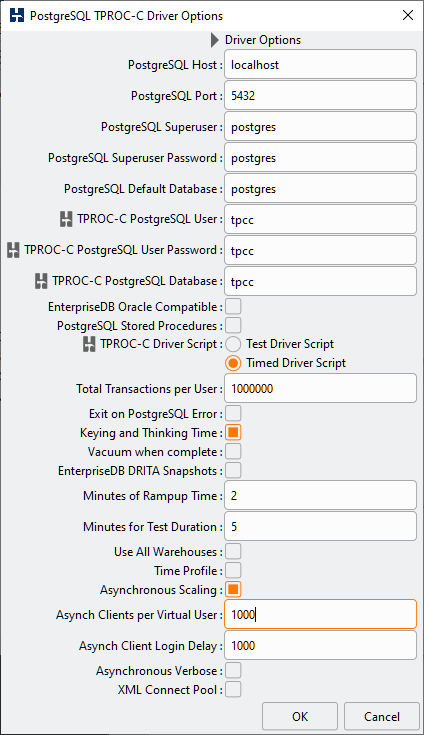
To configure this feature we now select Asynchronous Scaling noting that Keying and Thinking Time is automatically selected. We have also selected a 1000 clients for our one Virtual User and a Login Delay of 60ms. This means that each client will wait for 60ms after the previous client has logged in before then logging in itself. Finally we have chosen verbose output.  Note that with this feature it is important to allow the clients enough time to both login fully before measuring performance and also at the end it will take additional time for the clients to all complete their current keying and thinking time and to exit before the virtual user reports all clients as complete.

We now create a single virtual user as before. However this time once all the clients have connected we now see that there are the 1000 asynchronous clients connected to the test database.

SELECT DB_NAME(dbid) as DBName, COUNT(dbid) as NumberOfConnections FROM sys.sysprocesses WHERE dbid > 0 GROUP BY dbid;
DBName NumberOfConnections
master 43
tempdb 1
tpcc 1003

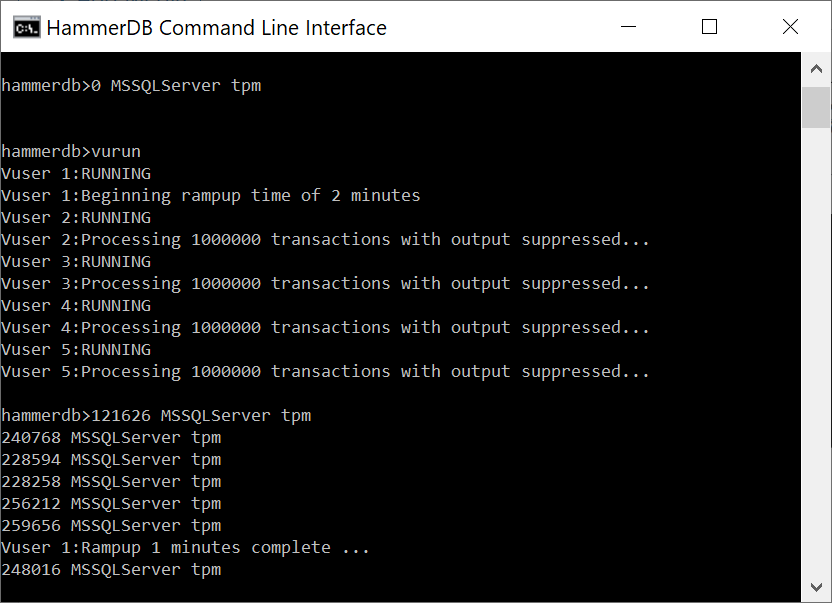
When the workload has completed (noting as before that additional time must be given to allow all of the asynchronous clients to complete their work and log off) we can see that HammerDB reports the active sessions based on the asynchronous client count and the transaction rate for the single virtual user is considerably higher with keying and thinking time.
The event driven scaling feature is not intended to replace the default CPU intensive mode of testing and it is expected that this will continue to be the most popular methodology. Instead being able to increase up client sessions with keying and thinking time adds additional test scenarios for highly scalable systems.

How to maximize CPU performance for PostgreSQL 12.0 benchmarks on Linux

HammerDB doesn’t publish competitive database benchmarks, instead we always encourage people to be better informed by running their own.  Nevertheless in this blog sometimes we do publish performance data to highlight best practices or potential configuration pitfalls and although we’ve mentioned this one before it is worth dedicating an entire post to it as this issue seems to appear numerous times running database workloads on Linux.

As noted previously  the main developer of HammerDB is an Intel employee (#IAMINTEL) however HammerDB is a personal open source project and any opinions are my own, specific to the context of HammerDB as an independent personal project and not representing Intel.

So over at Phoronix some database benchmarks were published showing   PostgreSQL 12 Performance With AMD EPYC 7742 vs. Intel Xeon Platinum 8280 Benchmarks  

So what jumps out immediately here is the comment “The single-threaded PostgreSQL 12 performance was most surprising.” Usually when benchmark results are surprising it is a major hint that something could be misconfigured  and that certainly seems the case here, so what could it be?  Well its difficult to be entirely sure however the tests have all the characteristics of tests observed previously where the CPUs are running in powersave mode.

So lets take an Ubuntu system with Platinum 8280 CPUs with the following Ubuntu OS, reboot and check the CPU configuration before running any tests.

# uname -a
Linux ubuntu19 5.3.0-rc3-custom #1 SMP Mon Aug 12 14:07:33 UTC 2019 x86_64 x86_64 x86_64 GNU/Linux

Welcome to Ubuntu 19.04 (GNU/Linux 5.3.0-rc3-custom x86_64)

So by default, the system boots into powersave.  You can see this by running the “cpupower frequency-info” command and checking the governor line. Note that this is also the case on the developer’s Ubuntu based laptop and therefore is a logical default where systems may be running on battery power.  it is also extremely important to note that for Intel CPUs the driver must show “intel_pstate” if it doesn’t then either your kernel does not support the CPU or you have misconfigured BIOS settings. (Yes it is worth reiterating that for Intel CPUs the driver MUST show intel_pstate, if it doesn’t then something is set up wrong)

cpupower frequency-info
analyzing CPU 0:
driver: intel_pstate
CPUs which run at the same hardware frequency: 0
CPUs which need to have their frequency coordinated by software: 0
maximum transition latency: Cannot determine or is not supported.
hardware limits: 1000 MHz - 4.00 GHz
available cpufreq governors: performance powersave
current policy: frequency should be within 1000 MHz and 4.00 GHz.
The governor "powersave" may decide which speed to use
within this range.
current CPU frequency: Unable to call hardware
current CPU frequency: 1.00 GHz (asserted by call to kernel)
boost state support:
Supported: yes
Active: yes

So after installing PostgreSQL 12.0 we can install and run the single-threaded pgbench fairly simply (as a single threaded test we verified that the scale factor does not impact the result).

./bin/createdb pgbench
./bin/pgbench -i -s \$SCALING_FACTOR pgbench
./bin/pgbench -c 1 -S -T 60 pgbench
starting vacuum...end.
transaction type: <builtin: select only>
scaling factor: 1000
query mode: simple
number of clients: 1
number of threads: 1
duration: 60 s
number of transactions actually processed: 1377426
latency average = 0.044 ms
tps = 22957.058444 (including connections establishing)
tps = 22957.628615 (excluding connections establishing)

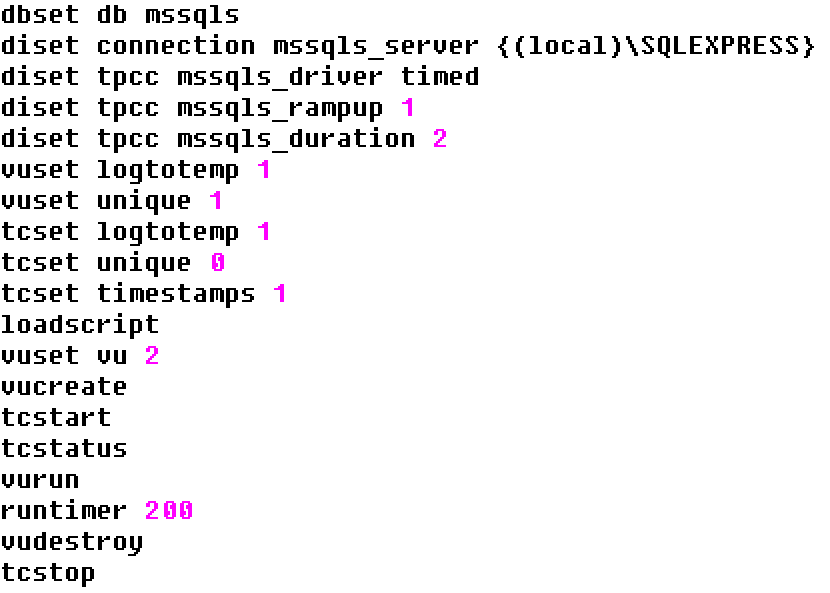
As this result is pretty lacklustre, lets check the frequency that the CPU is running at using the turbostat command.  Note that turbostat will show you the maximum frequency your system can run out depending on how many cores are utilised. Therefore in this case for a single-threaded workload we should be able to run up to 4GHz depending on what else is running at the time.
# ./turbostat
turbostat version 18.07.27 - Len Brown <lenb@kernel.org></lenb@kernel.org>
CPUID(0): GenuineIntel 0x16 CPUID levels; 0x80000008 xlevels;
...
33 * 100.0 = 3300.0 MHz max turbo 28 active cores
35 * 100.0 = 3500.0 MHz max turbo 24 active cores
37 * 100.0 = 3700.0 MHz max turbo 20 active cores
37 * 100.0 = 3700.0 MHz max turbo 16 active cores
37 * 100.0 = 3700.0 MHz max turbo 12 active cores
37 * 100.0 = 3700.0 MHz max turbo 8 active cores
38 * 100.0 = 3800.0 MHz max turbo 4 active cores
40 * 100.0 = 4000.0 MHz max turbo 2 active cores
...

Now running turbostat while pgbench is running we can see one core is busy, however it is only running at an average of 2.7 – 2.8 GHz over the snapshot time with a couple of examples below.

Package Core CPU Avg_MHz Busy% Bzy_MHz TSC_MHz 
0 1 1 2784 73.00 3823 2694
--
0 4 4 2864 74.83 3834 2696 

Remember that you have configured the system to save power rather than performance so it will not be running anywhere near full potential.  So lets switch the system to performance mode with one command.

./cpupower frequency-set --governor=performance
Setting cpu: 0
Setting cpu: 1
Setting cpu: 2
Setting cpu: 3
Setting cpu: 4
Setting cpu: 5
Setting cpu: 6
Setting cpu: 7
Setting cpu: 8
Setting cpu: 9
...

We can now see that the CPUs are set to performance mode.

./cpupower frequency-info
analyzing CPU 0:
driver: intel_pstate
CPUs which run at the same hardware frequency: 0
CPUs which need to have their frequency coordinated by software: 0
maximum transition latency: Cannot determine or is not supported.
hardware limits: 1000 MHz - 4.00 GHz
available cpufreq governors: performance powersave
current policy: frequency should be within 1000 MHz and 4.00 GHz.
The governor "performance" may decide which speed to use
within this range.
current CPU frequency: Unable to call hardware
current CPU frequency: 3.52 GHz (asserted by call to kernel)
boost state support:
Supported: yes
Active: yes

We don’t have to stop there, we can also change the energy performance bias setting to performance as well.

./x86_energy_perf_policy
cpu0: EPB 7
cpu0: HWP_REQ: min 10 max 40 des 0 epp 128 window 0x0 (0*10^0us) use_pkg 0
cpu0: HWP_CAP: low 7 eff 10 guar 27 high 40
cpu1: EPB 7
cpu1: HWP_REQ: min 10 max 40 des 0 epp 128 window 0x0 (0*10^0us) use_pkg 0
cpu1: HWP_CAP: low 7 eff 10 guar 27 high 40
cpu2: EPB 7
...

./x86_energy_perf_policy performance

./x86_energy_perf_policy
cpu0: EPB 0
cpu0: HWP_REQ: min 10 max 40 des 0 epp 128 window 0x0 (0*10^0us) use_pkg 0
cpu0: HWP_CAP: low 7 eff 10 guar 27 high 40
cpu1: EPB 0
cpu1: HWP_REQ: min 10 max 40 des 0 epp 128 window 0x0 (0*10^0us) use_pkg 0
cpu1: HWP_CAP: low 7 eff 10 guar 27 high 40
cpu2: EPB 0
cpu2: HWP_REQ: min 10 max 40 des 0 epp 128 window 0x0 (0*10^0us) use_pkg 0
cpu2: HWP_CAP: low 7 eff 10 guar 27 high 40
cpu3: EPB 0

Note how the EPB value changed from 7 to 0 to change the balance towards performance. It is also worth noting that C-states are an important part of balancing power and performance and in this case we leave them enabled.

./cpupower idle-info
CPUidle driver: intel_idle
CPUidle governor: menu
analyzing CPU 0:
Number of idle states: 4
Available idle states: POLL C1 C1E C6

So now lets see what we get in performance mode, an almost 32% improvement (and 53% higher than the published benchmarks). 

./bin/pgbench -c 1 -S -T 60 pgbench
starting vacuum...end.
transaction type: <builtin: select only>
scaling factor: 1000
query mode: simple
number of clients: 1
number of threads: 1
duration: 60 s
number of transactions actually processed: 1815653
latency average = 0.033 ms
tps = 30260.836480 (including connections establishing)
tps = 30261.819189 (excluding connections establishing)

and turbostat tells us that we are running at almost 3.8GHz making it clear the reason for the performance gain. We asked the system to emphasise performance over power.


Package Core CPU Avg_MHz Busy% Bzy_MHz TSC_MHz
0 0 56 3779 98.12 3860 2694
--
0 25 22 3755 97.88 3846 2694

PgBench is based on TPC-B and there is an excellent post on what it is running here Do you know what you are measuring with pgbench?  so instead to run a more enterprise based transactional workload  we will run the HammerDB OLTP workload that is derived from TPC-C to see the overall impact of running transactional benchmarks in powersave mode. 

One of the most important aspects of running your own database benchmarks is that you can generate a performance profile  this means that instead of taking a single data point as a measure of database performance you run a series of tests back-to-back increasing the virtual user count each time until you have reached maximum performance.  HammerDB has the autopilot feature in the GUI or scripting in the command line to run these profiles unattended. So in this case we will do just that once in performance mode and once in powersave mode with the results shown below.

Clearly it is a good job we took the time to measure the full performance profile. Whereas in performance mode the results measured in NOPM reach a peak and then remain fairly constant in powersave mode we see the system throttle back performance with the balance towards saving power, exactly as the setting has asked it to do.  Also note that this is not an either/or scenario and you can have multiple configurations in-between, however by default powersave is chosen.

It is also important to note however that at the level of peak performance approached at 80 virtual users in this case. We are only seeing around 50% utilization across all of the CPUs in the system. The screenshot below of a subsection of the CPUs in the system (using the HammerDB metrics option in the GUI) shows that this is evenly distributed across all of the cores.  As you increase the number of virtual users you increase the CPU utilization but don’t increase the throughput (NOPM), why is this?

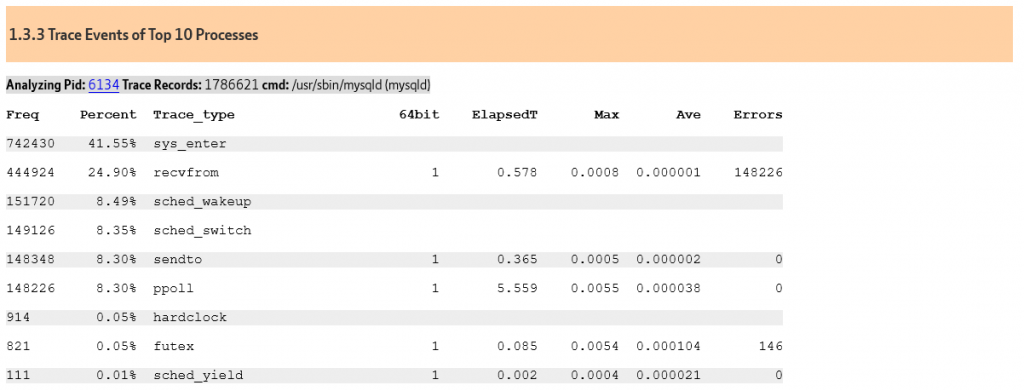
So is there a bottleneck in HammerDB or the TPC-C workload?  The answer is no. HammerDB has a signficant advantage of being able to run on multiple databases allowing this sort of question again to be answered from your running your own tests. HammerDB and the TPC-C derived workload can achieve signficantly higher levels of throughput running at 95%+ CPU utilization with some of the commercial database software offerings.  Instead in this case we are hitting the ceiling of PostgreSQL scalability for this type of transactional workload.  There is also an excellent presentation on exactly this topic called Don’t Stop the World which is well worth reviewing to understand the limitations. If we review the workload we can see that PostgreSQL is spending most of its time in locking.

and at the CPU level we can see PostgreSQL is using the atomic operation cmpxchg

At this point PostgreSQL is already doing considerably more than 2M PostgreSQL TPM and 1M NOPM so the scability is already incredibly good. However  it is clear that adding CPU resource beyond this point will only result in more time spent waiting in locking and will not improve performance for this intensive OLTP workload beyond a certain point.  (It is always accepted that there may be options to tune the stored procedures or postgresql.conf for some gains, however this does impact the core argument around database scalability).  Therefore it is especially important that you ensure that your CPUs are not running in powersave mode to see the maximum return on your configuration.

Finally it is worth noting that our focus has been on OLTP transactional workloads. However the CPU configuration advice applies equally to OLAP read only workloads.  For these workloads HammerDB includes an implementation derived from the TPC-H benchmark to run complex ad-hoc analytic queries against a PostgreSQL database.  In particular this is ideally suited to testing the PostgreSQL Parallel Query feature utilizing multiple cores for a single query and there is an example of this type of parallel query test here.

Benchmark on a Parallel Processing Monster!

But If we haven’t emphasised it enough, firstly whatever database benchmark you are running make sure that your CPUs are not configured to run in powersave mode.

How to add your database to HammerDB – Pt4 Commit changes and pull request

In parts 1 to 3 of this series we have gone through the steps of taking the HammerDB code and adding support for a new database.  At the moment these changes are on the local development system. in summary we have modified database.xml in the config directory, added a new mariadb.xml file, created a mariadb directory in the src directory and then added and updated the metrics, options, oltp, olap and transaction counter files for our new database.  So the next stage is to add these changes:

~/HammerDB-Fork/HammerDB$ git add .
~/HammerDB-Fork/HammerDB$ git status
On branch 54
Changes to be committed:
(use "git reset HEAD ..." to unstage)

modified: config/database.xml
new file: config/mariadb.xml
new file: src/mariadb/mariamet.tcl
new file: src/mariadb/mariaolap.tcl
new file: src/mariadb/mariaoltp.tcl
new file: src/mariadb/mariaopt.tcl
new file: src/mariadb/mariaotc.tcl

and commit then to the branch we are working on.

~/HammerDB-Fork/HammerDB$ git commit -m "Template for adding MariaDB as separate database"
[54 8ababeb] Template for adding MariaDB as separate database
7 files changed, 3471 insertions(+)
create mode 100755 config/mariadb.xml
create mode 100755 src/mariadb/mariamet.tcl
create mode 100755 src/mariadb/mariaolap.tcl
create mode 100755 src/mariadb/mariaoltp.tcl
create mode 100755 src/mariadb/mariaopt.tcl
create mode 100755 src/mariadb/mariaotc.tcl

They can then be pushed to the repository.

~/HammerDB-Fork/HammerDB$ git push origin 54
...
remote: Resolving deltas: 100% (4/4), completed with 4 local objects.
remote:
remote: Create a pull request for '54' on GitHub by visiting:
remote: https://github.com/sm-shaw/HammerDB/pull/new/54
remote:
To https://github.com/sm-shaw/HammerDB.git
* [new branch] 54 -> 54

If you think you are ready for the changes for your additional database to be included in HammerDB then you should open a pull request.  In this example there is more work to do and therefore we will not be opening the pull request at this point in time.
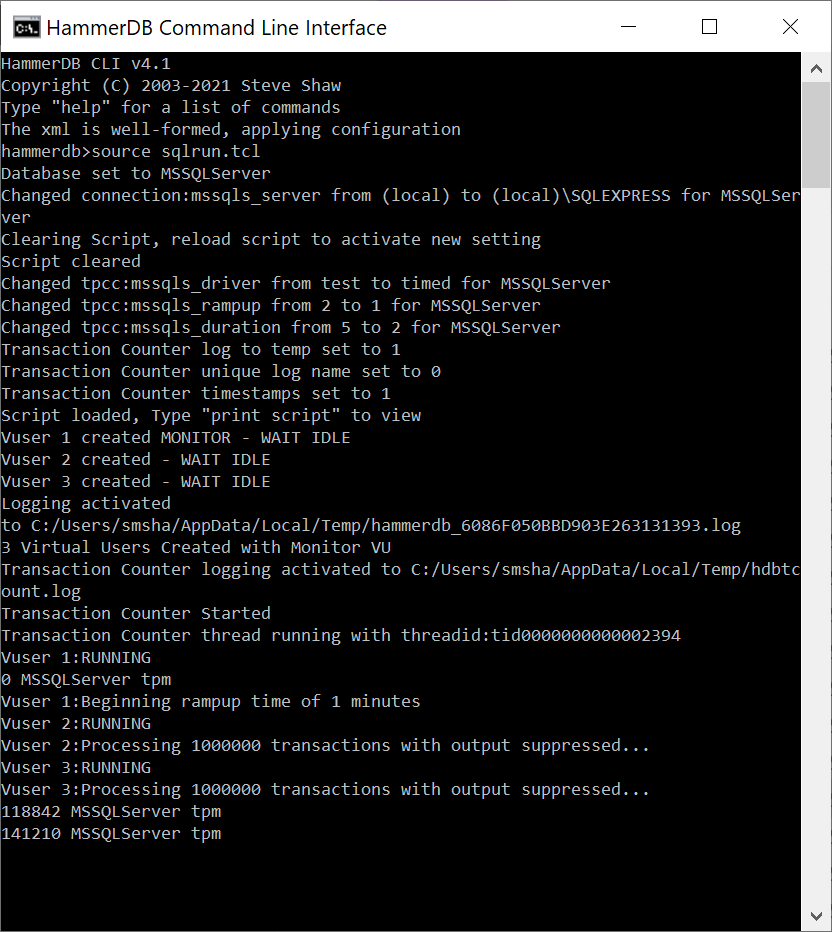
At the same time as opening the pull request you should update the Issue you opened in part 1 to discuss the changes you made.  In particular if there are new binaries required to support both Linux and Windows then this will be necessary for discussion to support the new binaries in a future release.
Finally bear in mind that the pull request to add a new database will be very much the start as opposed to the end of the process of adding a database.  As users begin to use your contributions to test your chosen database they will inevitably have questions for support therefore you will be required to provide assistance and respond accordingly to any questions that they may have.

How to add your database to HammerDB – Pt3 Adding to and modifying the source

From the previous post we now have source and binary copies of HammerDB for modification and test. The next step is to see if there is an Issue already created for the database we want to add or whether we should create one. In this example using MariaDB there is already an Issue created Add MariaDB as a separate database #54  although note that this can be for any database you choose.  You now want to create a new branch for this work,  in this case using the Issue number for branch.

git checkout -b 54
Switched to a new branch '54'
git branch
* 54
61
master

git status will also show you the current branch. You can now begin modifying the source to add your database.  Firstly in the database.xml in the config directory add the information for your new database.  Note in particular the prefix that will be used for variables and file and procedure names.  The commands section is used to identify words for highlighting in the script editor only. 

<mariadb>
<name>MariaDB</name>
<description>MariaDB</description>
<prefix>maria</prefix>
<library>mysqltcl</library>
<workloads>TPC-C TPC-H</workloads>
mysql::sel mysqluse mysqlescape mysqlsel mysqlnext mysqlseek mysqlmap mysqlexec mysqlclose mysqlinfo mysqlresult mysqlcol mysqlstate mysqlinsertid mysqlquery mysqlendquery mysqlbaseinfo mysqlping mysqlchangeuser mysqlreceive
mariadb>

Then create an xml file with the name of the database, in this case mariadb.xml with values that will become the user defined variables in your workload.

<?xml version="1.0" encoding="utf-8"?>
<mariadb>
<connection>
<maria_host>127.0.0.1</maria_host>
<maria_port>3306</maria_port>
</connection>
<tpcc>
<schema>
<maria_count_ware>1</maria_count_ware>
<maria_num_vu>1</maria_num_vu>
<maria_user>root</maria_user>
<maria_pass>mysql</maria_pass>
<maria_dbase>tpcc</maria_dbase>
<maria_storage_engine>innodb</maria_storage_engine>
<maria_partition>false</maria_partition>
</schema>
<driver>
...

As a test having created the config files and copied them to the binaries directory and run it we can see that MariaDB has been added as a database but cannot find the files that define the configuration and workloads, clearly this is  because we have not created them yet!

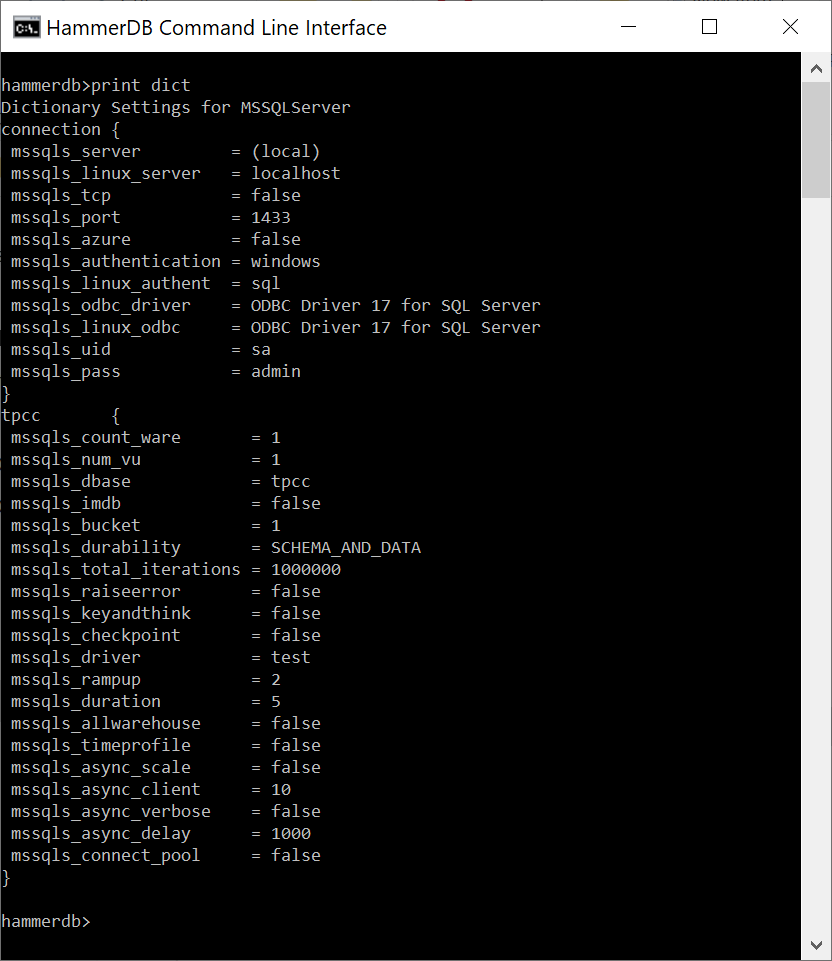
If you run the CLI you will see the same message. However you can now set your database to MariaDB and print dict will show the variables you defined in the XML file.

~/HammerDB-Fork/HammerDB-3.2$ ./hammerdbcli 
HammerDB CLI v3.2
Copyright (C) 2003-2019 Steve Shaw
Type "help" for a list of commands
The xml is well-formed, applying configuration
Error loading database source files/mariadb/mariaopt.tcl
Error loading database source files/mariadb/mariaoltp.tcl
Error loading database source files/mariadb/mariaolap.tcl
Error loading database source files/mariadb/mariaotc.tcl
hammerdb>dbset db maria
Database set to MariaDB

hammerdb>print dict
Dictionary Settings for MariaDB
connection {
maria_host = 127.0.0.1
maria_port = 3306
}
tpcc {
maria_count_ware = 1
maria_num_vu = 1
maria_user = root
maria_pass = mysql
maria_dbase = tpcc
maria_storage_engine = innodb
maria_partition = false
maria_total_iterations = 1000000
maria_raiseerror = false
maria_keyandthink = false
maria_driver = test
maria_rampup = 2
maria_duration = 5
maria_allwarehouse = false
maria_timeprofile = false
}

 What you clearly  need to do next is to create the directory named after your database and the required files of mariadb/mariaopt.tcl  for the graphical options screens, mariadb/mariamet.tcl  for metrics, mariadb/mariaoltp.tcl for the scripts for the TPC-C  workloads, mariadb/mariaolap.tcl for the TPC-H workloads and mariadb/mariaotc.tcl for the online transaction counter.  You then need to modify these files according to your needs.  In this case as MariaDB is a fork of MySQL and the workloads are so close we are going to copy all of the required files from the MySQL directory, rename them and update the variable and procedure names from mysql to mariadb.

A key feature is that the XML file where you defined the variables is stored as a dict structure with the prefix config and the name of your database. In this case configmariadb.  It is this dict which you use in the scripts to fetch and update the variables.

Starting with mariadb/mariaopt.tcl we are setting the graphical options to interact with this dict.  In this case the options are the same for MariaDB as they are for MySQL however will be different for different databases. Copying the modified source to the binary directories enables testing.

After modifying the graphical options we can then update and test the TPC-C schema build and tests in mariadb/mariaoltp.tcl. As well as ensuring we are using configmariadb and updating the variable names we also need to change the procedure names to include the prefix defined in the XML file, in this case maria. Therefore the following procedures will exist for the schema build, test and timed test scripts respectively.

proc build_mariatpcc
proc loadmariatpcc
proc loadtimedmariatpcc

Once these changes have been made we can test the schema build.

and timed test.

and the transaction counter is updated in mariadb/mariaotc.tcl

Similarly we can update the TPC-H workload in mariadb/mariaolap.tcl and then test the schema build.

and TPC-H query test

At this point we have now created a new database under MariaDB but are running exactly the same schema builds and tests as the regular MySQL schemas. However this now gives us the opportunity to make the changes we want for MariaDB only such as adding PL/SQL compatibility for the TPC-C workload or changes to support column stores for TPC-H. The important point is that  we have added support for a completely new database and all of the code changes do not impact any of the other databases in any way.

Note that if you do not want your database to appear as an option in HammerDB it can be commented out in the database.xml file.


<trafodion>
<name>Trafodion</name>
<description>Trafodion</description>
<prefix>traf</prefix>
tdbc::odbc
<workloads>TPC-C</workloads>
tdbc::odbc
</trafodion>
-->

How to add you database to HammerDB – Pt2 Fork, clone and binary downloads

As noted in the previous post to add a database to HammerDB you will need to change the source code.  There are different ways to do this, however the recommended way is as follows.  Firstly make a fork of the latest HammerDB source on GitHub to your account. To do this select fork in the top right hand corner of the GitHub page and follow the instructions. Shortly you should have your own copy of HammerDB under your account showing that it was forked from the main site.

Next you will want a development copy on your own system. This can be done with Clone or download.  in this example we will use the command line to do this using the web URL shown in the Clone or download link.

For this example with a development system on Linux we will make a directory to show that we are working in a fork of HammerDB.

mkdir HammerDB-Fork
cd HammerDB-Fork

Then in this directory clone using the URL above.

git clone https://github.com/sm-shaw/HammerDB.git
Cloning into 'HammerDB'...
...
Resolving deltas: 100% (193/193), done.

Under the working directory we know have the HammerDB source code in which to add the new database.

~/HammerDB-Fork$ ls
HammerDB
~/HammerDB-Fork$ ls HammerDB/
agent hammerdbcli.bat hammerdbws.bat license
ChangeLog hammerdb modules config hammerdb.bat readme
config.xml hammerdbcli hammerdbws images src

It is also good practice to add the upstream HammerDB site so that you can also apply changes made here to your fork

git remote add upstream https://github.com/TPC-Council/HammerDB.git

The git remote command will show the remote repositories.

git remote
origin
upstream

So just for interest let’s try and run HammerDB from the source to see what happens.

~/HammerDB-Fork/HammerDB$ ./hammerdb
While loading component file "gentheme.tcl"...
can't find package ttk::theme::clearlooks
while executing
"package require ttk::theme::$theme"
(procedure "ttk::setTheme" line 4)
invoked from within
"ttk::setTheme $theme"
(file "./src/generic/gentheme.tcl" line 354)
invoked from within
"source [ file join $UserDefaultDir src generic $f ]"

So HammerDB started as I already had TCL installed on my system but then failed to find a package it needed.  As identified in the previous post we don’t have the correct bin and lib directory so need to download the binaries version from here.  Install these alongside your source directory.  In the newly installed binaries directory you will notice that there are the bin and lib directories we need and that HammerDB will run in this directory.

~/HammerDB-Fork$ ls
HammerDB HammerDB-3.2 HammerDB-3.2-Linux.tar.gz

As the source directory will be updated from time to time from the upstream remote and the bin and lib directories are different for both Linux and Windows it is best to make your changes to the source and copy these to binary build for testing as you do not want to commit any of the binary files into the source.

Now we have a copy of HammerDB that we can make changes to, to add a new database. In the next post – we will show adding MariaDB as a separate database into HammerDB.  As a fork of MySQL this has the advantage that at least initially we can use the already provided mysqltcl3.052 interface.